. 2018 Oct;18(20):e1800108.
doi: 10.1002/pmic.201800108.

Quantitative Analysis of the Brain Ubiquitylome in Alzheimer's Disease

Affiliations

Quantitative Analysis of the Brain Ubiquitylome in Alzheimer's Disease

Measho H Abreha et al. Proteomics. 2018 Oct.

Abstract

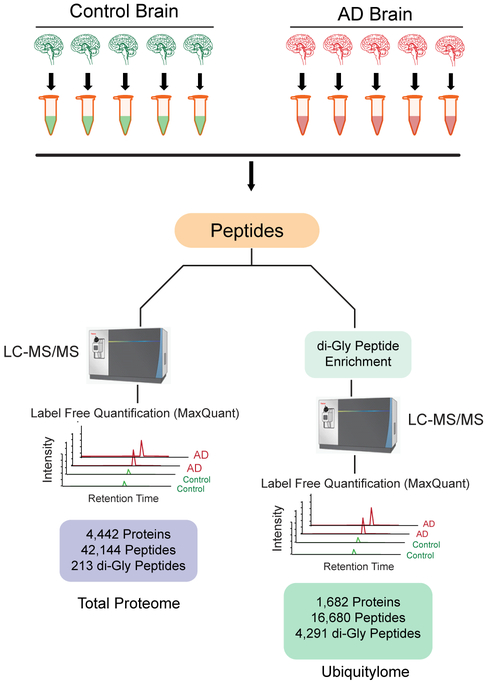
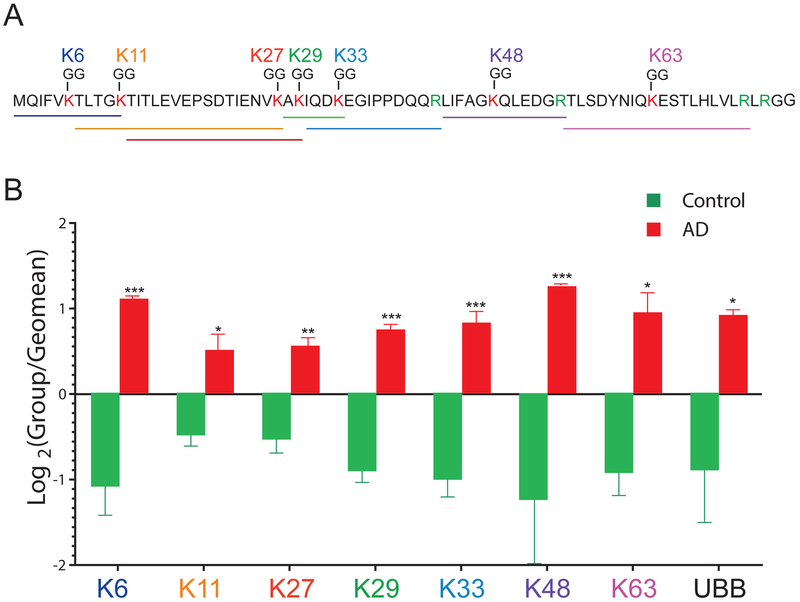
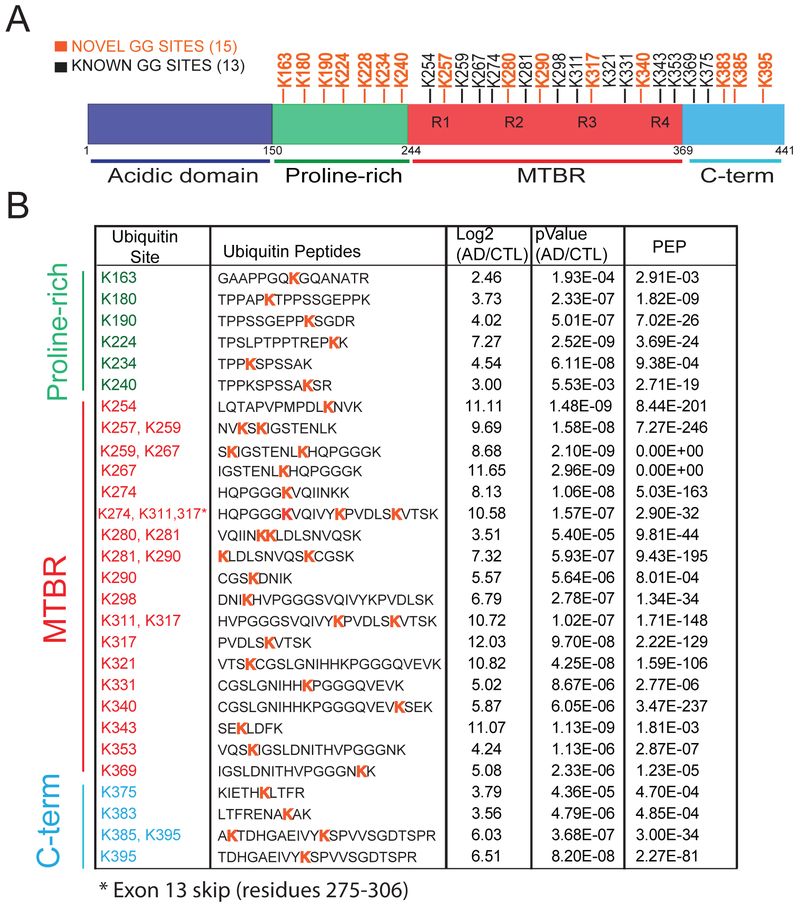
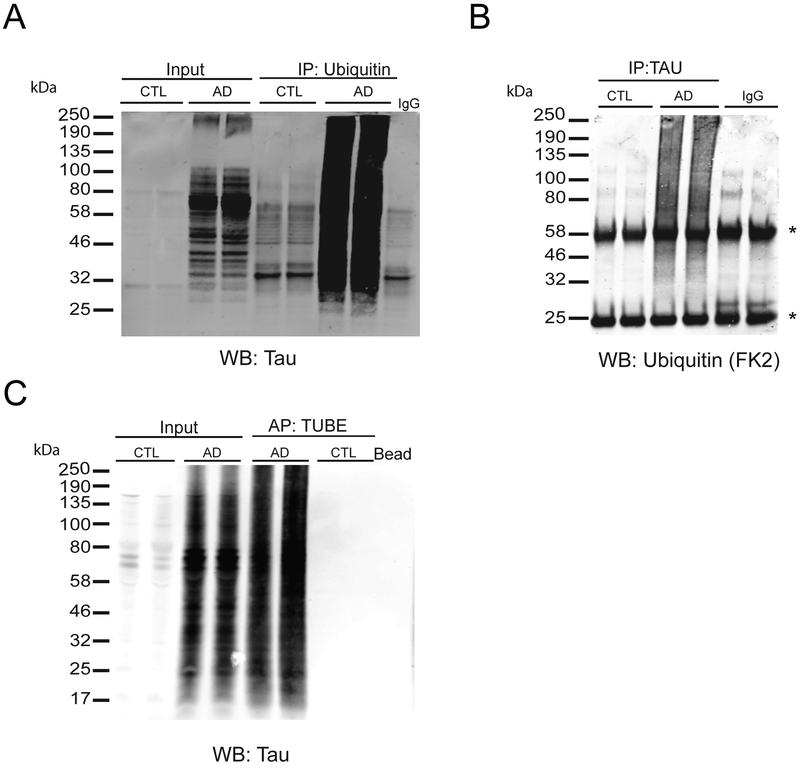
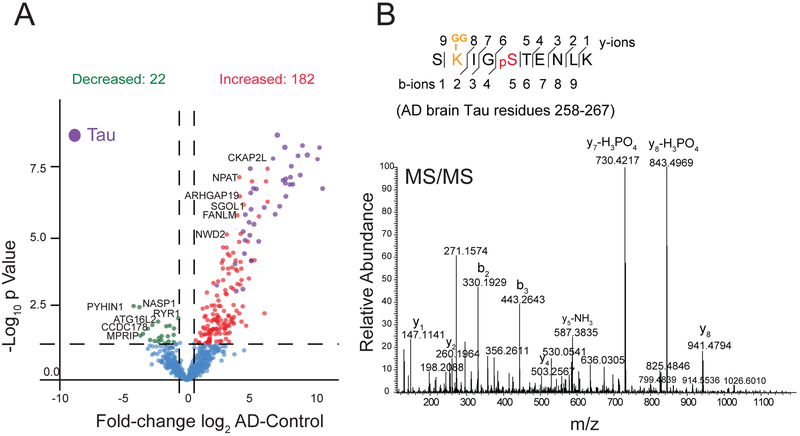
Several neurodegenerative diseases including Alzheimer's Disease (AD) are characterized by ubiquitin-positive pathological protein aggregates. Here, an immunoaffinity approach is utilized to enrich ubiquitylated isopeptides after trypsin digestion from five AD and five age-matched control postmortem brain tissues. Label-free MS-based proteomic analysis identifies 4291 unique ubiquitylation sites mapping to 1682 unique proteins. Differential enrichment analysis shows that over 800 ubiquitylation sites are significantly altered between AD and control cases. Of these, ≈80% are increased in AD, including seven poly ubiquitin linkages, which is consistent with proteolytic stress and high burden of ubiquitylated pathological aggregates in AD. The microtubule associated protein Tau, the core component of neurofibrillary tangles, has the highest number of increased sites of ubiquitylation per any protein in AD. Tau poly ubiquitylation from AD brain homogenates is confirmed by reciprocal co-immunoprecipitation and by affinity capture using tandem ubiquitin binding entities. Co-modified peptides, with both ubiquitylation and phosphorylation sites, are also enriched in AD. Notably, many of the co-modified peptides mapped to Tau within KXGS motifs in the microtubule binding region suggesting that crosstalk between phosphorylation and ubiquitylation occurs on Tau in AD. Overall, these findings highlight the utility of MS to map ubiquitylated substrates in human brain and provides insight into mechanisms underlying pathological protein posttranslational modification in AD.

Keywords: mass spectrometry; neurodegeneration; post-translational modifications; protein aggregation; proteomics; ubiquitylation.


Figures

Figure 1.
Figure 1.
Experiment workflow. A) Control and AD human postmortem frontal cortex brain tissues (n=5 each group) were homogenized in 8M urea lysis buffer. For both global and ubiquitylome analysis, brain protein extracts from each sample was first denatured, alkylated and proteolytically digested followed by peptide desalting as described in methods. For global proteome analysis, peptides were analyzed by LC-MS/MS on Orbitrap Fusion Tribrid mass spectrometer. For brain ubiquitylome analysis, peptides were subjected to di-Gly affinity enrichment as described in methods followed by LC-MS/MS analysis in replicate on an Orbitrap Fusion Tribrid mass spectrometer. Protein abundance was calculated by peptide ion-intensity measurements across LC-MS runs using the label free quantification (LFQ) algorithm in MaxQuant.
Figure 2.
Figure 2.
Quantitative analysis of total brain proteome. A) Comparison of Aβ peptide levels measured by LFQ ion intensities in AD and control brain samples showed a significant increase in Aβ peptide levels in AD. Error bars represent ± SD (**p<0.05). B) Comparison of Tau protein levels in AD vs control cases measured by LFQ ion intensities showed a significant increase in Tau measures in AD. Error bars represent ± SD (**p<0.05). C) AD and control brain samples homogenized in 8M Urea lysis buffer were resolved on SDS-PAGE followed by western blot analysis using anti-pTau-S231 antibody. D) Volcano plot displays individual proteins (log2 fold-change) vs. t test significance [-log10(p value)]. Statistically significant proteins [-log10(p value) ≥ 1.30 and ±1.5-fold-change) are colored as red (increased) or green (decreased) whereas proteins that did not meet criteria are colored in blue. Among these, 362 proteins (red) showed a 1.5-fold-increase in AD samples and 229 proteins (green) showed a 1.5-fold-decrease in AD cases compared to controls.
Figure 3.
Figure 3.
Quantitative analysis of AD brain ubiquitylome following di-Gly peptide enrichment. A) Comparison of the percentage of di-Gly peptide spectral matches (MS/MS count) in total proteome vs GG-enriched proteome. In the total brain proteome only 0.18% (55/29322) of matched peptides were di-Gly modified versus 28.9% (3411/11768) of matched peptides in immunoaffinity (di-Gly specific antibody) enriched proteome. Error bars represent ± SD (***p<0.0001). B) Volcano plots displays individual di-Gly peptides log2-fold-change vs. t test significance [-log10(p value)] for AD vs Control. Red (n=674) and green (n=160) points represent significantly (-log10(p value) ≥ 1.30, at least ±1.5-fold change) differentially increased or decreased di-Gly peptides in the AD compared to controls, respectively. Blue points are di-Gly peptides identified that are not significant. C) Hierarchical clustering analysis using di-Gly peptide intensities segregates AD cases based on ubiquitylation pattern. Log2 di-Gly peptide intensities were converted to Z scores (mean centered abundance, fold of standard deviation) for clustering.
Figure 4.
Figure 4.
Polyubiquitin-linkage analysis in AD brain. A) Amino acid sequence of a 76 amino acid ubiquitin, depicting the seven internal lysine residues (red) that are sites of polyubiquitin attachment. Arginine is highlighted (green) as a site of trypsin cleavage. Peptide lengths of each linkage are underlined and color-coded B) A bar graph depicting increased polyubiquitin linkage peptide intensities (K6, K11, K27, K29, K33, K48, K63) and total ubiquitin protein (UBB) levels measured by LFQ ion intensities. Each log2 GG-peptide intensity was normalized to the geometric mean across all AD and control samples (n=10). Significance was measured using one-way non-parametric ANOVA (*p<0.05, **p<0.001, ***p<0.0001).
Figure 5.
Figure 5.
Quantification of Tau ubiquitin sites in AD Brain. A) schematic representation of Tau protein domains and ubiquitylation sites identified in this study. Residues are numbered according to Tau 441 isoform (P10636–8). A total of 15 novel ubiquitylation sites are indicated in orange, whereas previously known sites are in black. B) Statistical analysis (Student’s t test) indicates a significant fold change increase in Tau ubiquitin site intensities in AD compared to controls (p<0.05). PEP (posterior error probability) measures a probability of a peptide to be a false hit. All ubiquitin sites had localization probabilities above 90 percent, as assessed on the fragmentation spectra by MaxQuant. *Exon 13 skip event (amino acid 275–306 in Tau 441 isoform).
Figure 6.
Figure 6.
Validation of Tau ubiquitylation in AD brain. A) Validation of Tau polyubiquitylation in AD. Immunoprecipitation (IP) analysis performed on control and AD brain extracts (n=2, each) using anti-ubiquitin antibody (FK2) followed by immunoblotting using tau antibody. B) Reciprocal IP was performed on AD and control brain extracts using anti-Tau antibody followed by immunoblotting using anti-ubiquitin antibody (FK2) shows high molecular weight immunoreactivity in AD cases. *Indicates light and heavy immunoglobulin chains. C) Affinity precipitation (AP) of polyubiquitylated proteins using TUBE-biotin followed by western blot analysis using anti-tau antibody to detect polyubiquitylated Tau. Lysates incubated with beads alone were used as negative controls. Inputs refer to protein lysates prior immunoprecipitation.
Figure 7.
Figure 7.
Co-modification of Tau by phosphorylation and ubiquitylation in AD brain A) Volcano plot displays log2 fold change of intensities in AD versus control of co-modified peptides with both ubiquitylation and phosphorylation sites (minimum ±1.5-fold change, and Student’s t test significance, p<0.05). Red dots represent 182 dually modified peptides significantly increased in AD cases compared to controls and green dots represent 22 dually modified peptides decreased in AD compared to controls. Co-modified peptides from Tau protein are highlighted in purple. B) A representative MS/MS spectrum of a Tau peptide SK-GGIGPSTENLK (Residue 258–267) with ubiquitylation site at K259 and phosphorylation site at S262.

References

    1. Bence NF, Sampat RM, Kopito RR, Science 2001, 292, 1552. - PubMed
    1. Gilberto S, Peter M, The Journal of cell biology 2017, 216, 2259; - PMC - PubMed
    2. Grillari J, Grillari Voglauer R, Jansen-Durr P, Advances in experimental medicine and biology 2010, 694, 172; - PubMed
    3. Muratani M, Tansey WP, Nature reviews Molecular cell biology 2003, 4, 192; - PubMed
    4. Ciechanover A, The EMBO journal 1998, 17, 7151; - PMC - PubMed
    5. Hershko A, Ciechanover A, Annual Reviews 4139 El Camino Way, PO Box 10139, Palo Alto, CA 94303–0139, USA, 1998.
    1. Scheffner M, Nuber U, Huibregtse JM, Nature 1995, 373, 81. - PubMed
    1. Weissman AM, Nature reviews Molecular cell biology 2001, 2, 169; - PubMed
    2. Scheffner M, Huibregtse JM, Vierstra RD, Howley PM, Cell 1993, 75, 495. - PubMed
    1. Kerscher O, Felberbaum R, Hochstrasser M, Annu. Rev. Cell Dev. Biol 2006, 22, 159. - PubMed

Publication types