. 2018 Sep;6(18):e13827.
doi: 10.14814/phy2.13827.

Ambient particulate matter enhances the pulmonary allergic immune response to house dust mite in a BALB/c mouse model by augmenting Th2- and Th17-immune responses

Affiliations

Ambient particulate matter enhances the pulmonary allergic immune response to house dust mite in a BALB/c mouse model by augmenting Th2- and Th17-immune responses

Alejandro R Castañeda et al. Physiol Rep. 2018 Sep.

Abstract

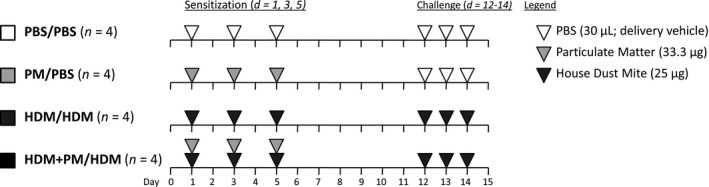
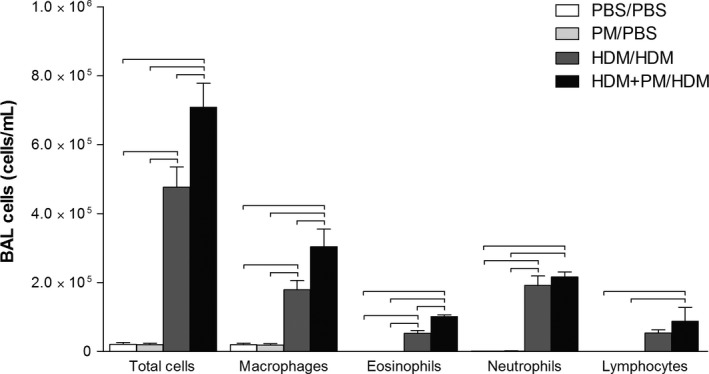
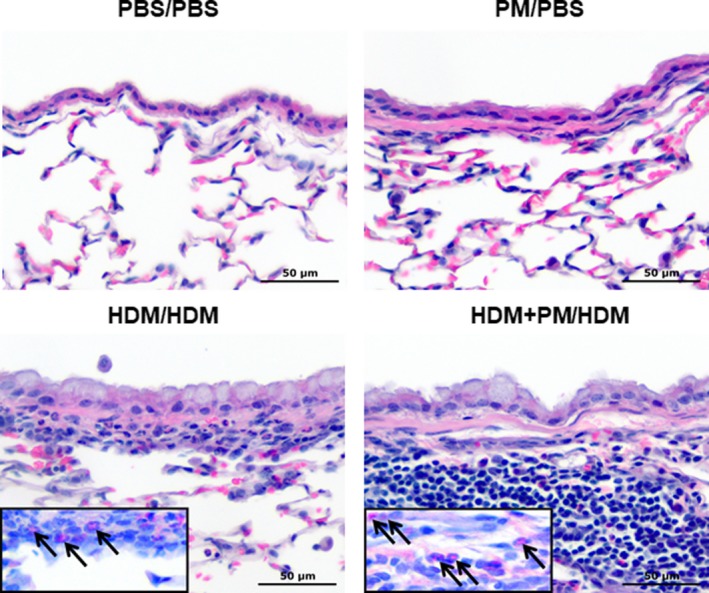
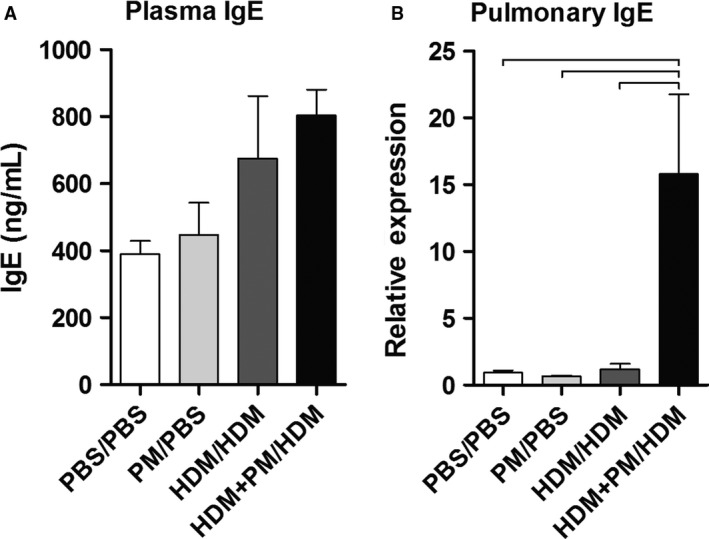
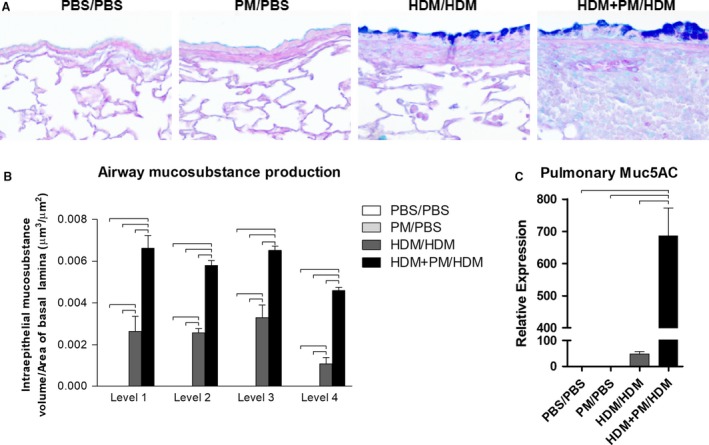
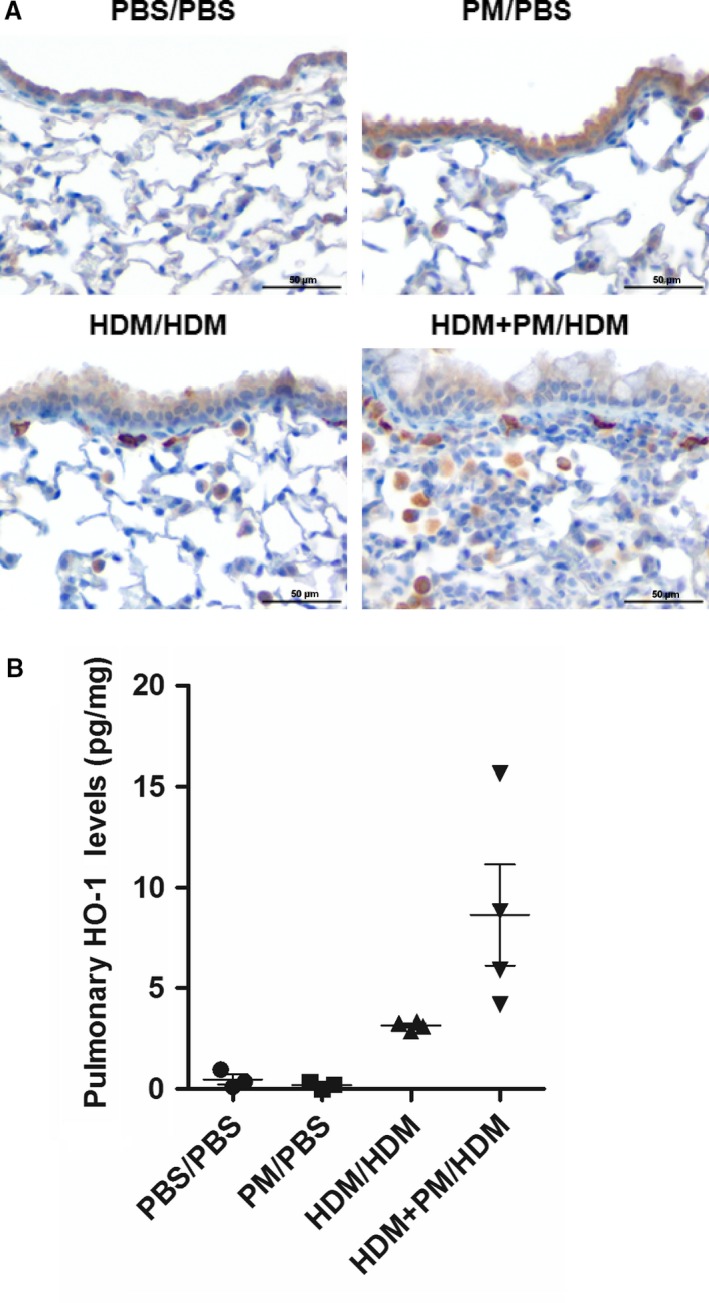
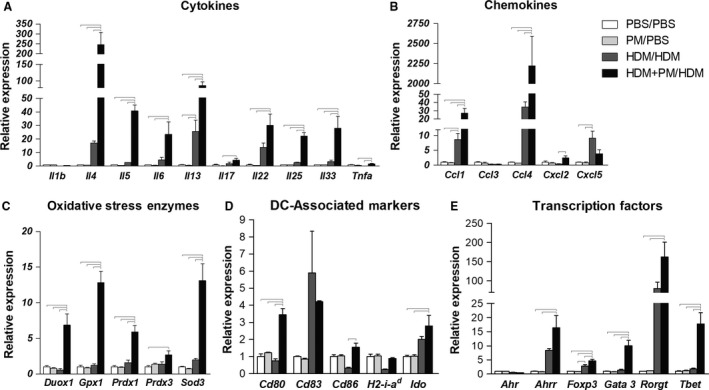
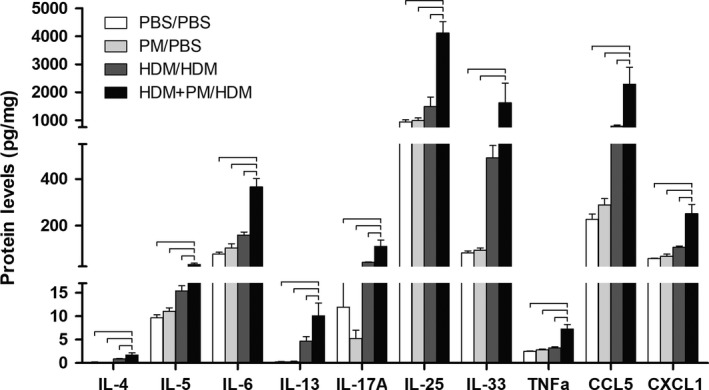
Ambient particulate matter (PM) exacerbates airway inflammation and hyper-reactivity in asthmatic patients. Studies show that PM has adjuvant-like properties that enhance the allergic inflammatory response; however, the mechanisms through which PM enhances these processes remain elusive. The objective of the study was to examine how ambient PM enhances the allergic immune response. Eight-week-old BALB/c mice were sensitized with house dust mite (HDM) or HDM and ambient particulate matter (PM, 2.5 μm; Sacramento, CA) to assess how PM modulates the development of adaptive immune responses against allergens. Both groups were challenged with HDM only. Bronchoalveolar lavage (BAL) was analyzed for extent of airway inflammation. Lung tissue was used for histological analysis, mucosubstance quantification, and heme oxygenase-1 (HO-1) localization/quantification. Gene expression was analyzed in whole lung to characterize immune markers of inflammation: cytokines, chemokines, antioxidant enzymes, and transcription factors. Cytokine and chemokine protein levels were quantified in whole lung to confirm gene expression patterns. Compared to HDM-only sensitization, exposure to PM during HDM sensitization led to significant immune cell recruitment into the airway subepithelium, IgE gene expression, mucosubstance production, and Th2-associated cytokine expression. HO-1 levels were not significantly different between the treatment groups. Gene expression profiles suggest that polycyclic aromatic hydrocarbon (PAH) content in PM activated the aryl hydrocarbon receptor (AhR) and enhanced Th17-responses in the mice that received HDM and PM compared to mice that received HDM-only. The findings suggest that PM enhances allergic sensitization via enhancement of Th2-mediated inflammation and that AhR activation by PAHs in PM promotes Th17-immune responses.

Keywords: Allergic airway inflammation; Th17 immunity; Th2 immunity; allergy; house dust mite allergen; particulate matter.


Figures

Figure 1
Figure 1
Allergic sensitization and challenge protocol. BALB/c mice were sensitized (day 1, 3, and 5) and challenged (day 12–14) intranasally with either PBS (30 μL/day; delivery vehicle; white triangles; n = 4), PM (33.3 μg/day, light grey triangles; n = 4), HDM (25 μg/day, dark grey triangles; n = 4) or HDM + PM (n = 4). Mice were euthanized 24 h after the final challenge (day 15) to assess pulmonary inflammation.
Figure 2
Figure 2
Cellular profiles of recovered bronchoalveolar lavage (BAL) fluid. PM enhanced HDM‐induced allergic airway inflammation compared to HDM treatment‐alone. BALB/c mice were sensitized/challenged with PBS/PBS(control; white), PM/PBS (light gray), HDM/HDM (dark grey), or HDM + PM/HDM (black). Total cells, macrophages, eosinophils, neutrophils, and lymphocytes are shown in number of cells counted per milliliter (cells/mL). Data are presented as mean ± SEM (= 4/group). Bars indicate a significant difference of < 0.05 between groups.
Figure 3
Figure 3
Histopathology of the lung. HDM + PM/HDM treatment induces greater sub‐epithelial influx of monocytes/macrophages and eosinophils compared to HDM‐alone treatment. Micrographs of the epithelium of central airways from paraffin‐embedded lung tissue sections (×400 magnification) stained with hematoxylin & eosin. Inserts show serial sections of lung tissue stained with combined eosinophil and mast cell stain, arrows indicate eosinophils. The scale bar represents a distance of 50 μm.
Figure 4
Figure 4
Immunoglobulin E (IgE) protein levels from blood plasma (A) and IgE pulmonary gene expression levels (B). Plasma IgE levels were measured to characterize the systemic allergic response and are expressed as nanograms of IgE per milliliter of plasma (ng/mL). Pulmonary IgE gene expression levels are shown as relative expression to Gapdh housekeeping gene. Data are presented as mean ± SEM (n = 3–4 mice/group). Plasma IgE protein levels were analyzed in duplicate (A). Bars indicate a significant difference of < 0.05 between groups.
Figure 5
Figure 5
Mucosubstance distribution, abundance, and gene expression. PM exposure during allergen sensitization (HDM + PM/HDM) leads to enhanced mucosubstance secretion upon allergen challenge, compared to allergen‐only sensitized animals (HDM/HDM). (A) Micrographs of paraffin‐embedded lung tissue sections (×400 magnification) stained with Alcian blue and periodic acid‐Schiff (ABPAS). Mucosubstances are stained blue. The scale bar represents a distance of 50 μm. (B) Mucosubstance production was quantified via ImageJ, at four different levels in the lung: Levels 1–4. Mucosubstance production is expressed as intraepithelial mucosubstance volume over the area of basal lamina (μm3/μm2). (C) Pulmonary Muc5ac gene expression was assessed via qPCR. Muc5ac gene expression is shown as relative expression to Gapdh housekeeping gene. Data are presented as mean ± SEM (n = 4/group). Bars indicate a significant difference of < 0.05.
Figure 6
Figure 6
Heme oxygenase‐1 (HO‐1) pulmonary protein levels. (A) Micrographs of paraffin‐embedded lung tissue sections immunohistochemically stained with HO‐1 (400× magnification). The scale bar represents a distance of 50 μm. (B) Pulmonary HO‐1 protein levels measured by ELISA, standardized to total lung protein, and expressed as picograms of protein per milligram of lung tissue (pg/mg). Data are presented as mean ± SEM (n = 4 mice/group). Lung HO‐1 protein levels were analyzed in duplicate.
Figure 7
Figure 7
Pulmonary gene expression profiles of cytokines (A), chemokines (B), oxidative stress enzymes (C), dendritic cell (DC)‐associated molecules (D), and transcription factors (E). Gene expression is shown as relative expression to GAPDH or Eef1a1 housekeeping genes. Abbreviations: Il = interleukin, Tnfa = tumor necrosis factor alpha, Ccl = C‐C motif chemokine ligand, Cxcl = C‐X‐C motif chemokine ligand, Duox = dual oxidase, Gpx = glutathione peroxidase, Prdx = peroxiredoxin, Sod = superoxide dismutase, Cd = cluster of differentiation, H2‐a‐id = major histocompatibility complex II, beta‐chain, Ido = indoleamine 2,3‐dioxygenase, Ahr = aryl hydrocarbon receptor, Ahrr = aryl hydrocarbon receptor repressor, Foxp3 = forkhead box P3, Gata3 = GATA binding protein 3, Rorgt = retinoidrelated orphan receptor gamma t, Tbet = T‐box transcription factor, Th1‐associated. Data are presented as mean ± SEM (n = 3–4/group). Bars indicate a significant difference of < 0.05 between groups.
Figure 8
Figure 8
Pulmonary cytokine and chemokine protein levels. Protein was measured by ELISA, standardized to total lung protein, and expressed as picograms of cytokine per milligram of lung tissue (pg/mg). Data are presented as mean ± SEM (n = 4/group). Samples were analyzed in duplicate. Bars indicate a significant difference of < 0.05 between groups.

References

    1. Ayres, J. G. , Borm P., Cassee F. R., Castranova V., Donaldson K., Ghio A., et al. 2008. Evaluating the toxicity of airborne particulate matter and nanoparticles by measuring oxidative stress potential–a workshop report and consensus statement. Inhal Toxicol 20:75–99. - PubMed
    1. Bein, K. , and Wexler A.. 2014. A high‐efficiency, low‐bias method for extracting particulate matter from filter and impactor substrates. Atmos. Environ. 90:87–95.
    1. Bein, K. , and Wexler A.. 2015. Compositional variance in extracted particulate matter using different filter extraction techniques. Atmos. Environ. 107:24–34.
    1. Bowatte, G. , Lodge C., Lowe A. J., Erbas B., Perret J., Abramson M. J., et al. 2015. The influence of childhood traffic‐related air pollution exposure on asthma, allergy and sensitization: a systematic review and a meta‐analysis of birth cohort studies. Allergy 70:245–256. - PubMed
    1. Brain, J. D. , Bloom S. B., Valberg P. A., and Gehr P.. 1984. Correlation between the behavior of magnetic iron oxide particles in the lungs of rabbits and phagocytosis. Exp. Lung Res. 6:115–131. - PubMed

Publication types

Substances