. 2019 Oct;25(12):1580-1592.
doi: 10.1177/1352458518799583. Epub 2018 Sep 19.

Glutamate-sensitive imaging and evaluation of cognitive impairment in multiple sclerosis

Affiliations

Glutamate-sensitive imaging and evaluation of cognitive impairment in multiple sclerosis

Kristin P O'Grady et al. Mult Scler. 2019 Oct.

Abstract

Background: Cognitive impairment (CI) profoundly impacts quality of life for patients with multiple sclerosis (MS). Dysfunctional regulation of glutamate in gray matter (GM) has been implicated in the pathogenesis of MS by post-mortem pathological studies and in CI by in vivo magnetic resonance spectroscopy, yet GM pathology is subtle and difficult to detect using conventional T1- and T2-weighted magnetic resonance imaging (MRI). There is a need for high-resolution, clinically accessible imaging techniques that probe molecular changes in GM.

Objective: To study cortical GM pathology related to CI in MS using glutamate-sensitive chemical exchange saturation transfer (GluCEST) MRI at 7.0 Tesla (7T).

Methods: A total of 20 patients with relapsing-remitting MS and 20 healthy controls underwent cognitive testing, anatomical imaging, and GluCEST imaging. Glutamate-sensitive image contrast was quantified for cortical GM, compared between cohorts, and correlated with clinical measures of CI.

Results and conclusion: Glutamate-sensitive contrast was significantly increased in the prefrontal cortex of MS patients with accumulated disability (p < 0.05). In addition, glutamate-sensitive contrast in the prefrontal cortex was significantly correlated with symbol digit modality test (rS = -0.814) and choice reaction time (rS = 0.772) scores in patients (p < 0.05), suggesting that GluCEST MRI may have utility as a marker for GM pathology and CI.

Keywords: Multiple sclerosis; cognitive dysfunction; glutamate; gray matter; magnetic resonance imaging; prefrontal cortex.


Conflict of interest statement

Conflict of interest

The authors declare that there is no conflict of interest.

Figures

Figure 1:
Figure 1:. Anatomical images, B0 shift maps, GluCEST contrast maps, and segmented GM GluCEST contrast maps for 7T MRI.
A healthy control (27-year-old female) is shown in (A-D) and a patient with MS (37-year-old female, EDSS = 2.5, duration = 6 years) is shown in (D-F). GM = gray matter.
Figure 2:
Figure 2:
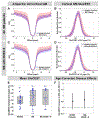
GluCEST in cortical GM. CEST z-spectra (A, C) and cortical GM GluCEST (B, D) differ between healthy controls (solid blue line) and patients with MS (dashed red line) for the entire patient cohort (A, B) and for the subset of MS patients with EDSS scores greater than 0 (C, D). There is a trend toward greater cortical GM GluCEST in MS as shown by the raw GluCEST data (E) and age-corrected disease effects plots (F). Shaded areas represent standard deviation for each cohort. For (A, B), n=20 healthy controls and 20 patients with MS. For (C, D), n = 20 healthy controls and 11 patients with MS. EDSS = Expanded Disability Status Scale, GM = gray matter.
Figure 3:
Figure 3:
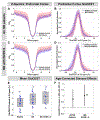
GluCEST in prefrontal cortex. CEST z-spectra (A, C) and GluCEST for the prefrontal region of cortical GM (B, D) differ between healthy controls (solid blue line) and patients with MS (dashed red line) for the entire patient cohort (A-B) and for a subset of patients with EDSS scores greater than 0 (C-D). Raw GluCEST data show a trend toward greater prefrontal cortex GluCEST in MS (E), and age-corrected comparisons between healthy controls and patients with MS show a significant increase in prefrontal cortex GluCEST for the subset of patients with EDSS > 0 (G, *p<0.05). Shaded areas represent standard deviation for each cohort. For (A, B), n=20 healthy controls and 20 patients with MS. For (C, D), n = 20 healthy controls and 11 patients with MS. EDSS = Expanded Disability Status Scale.
Figure 4:
Figure 4:
Associations between cognitive measures and GluCEST. Performance on the Symbol Digit Modalities Test (A-B) and Choice Reaction Time (C-D) correlates significantly with GluCEST in the overall cortical GM (A, C) and in the prefrontal cortex (B, D) in the subset of patients with EDSS scores greater than 0. GM = gray matter, SDMT = symbol digit modalities test, CRT = choice reaction time.

References

    1. Rocca MA, Amato MP, De Stefano N, et al. Clinical and imaging assessment of cognitive dysfunction in multiple sclerosis. Lancet Neurol 2015; 14: 302–317. DOI: 10.1016/S1474-4422(14)70250-9. - DOI - PubMed
    1. Chiaravalloti ND and DeLuca J. Cognitive impairment in multiple sclerosis. Lancet Neurol 2008; 7: 1139–1151. DOI: 10.1016/S1474-4422(08)70259-X. - DOI - PubMed
    1. Ruet A, Deloire M, Hamel D, et al. Cognitive impairment, health-related quality of life and vocational status at early stages of multiple sclerosis: a 7-year longitudinal study. J Neurol 2013; 260: 776–784. DOI: 10.1007/s00415-012-6705-1. - DOI - PubMed
    1. Vahter L, Zopp I, Kreegipuu M, et al. Clean intermittent self-catheterization in persons with multiple sclerosis: the influence of cognitive dysfunction. Mult Scler 2009; 15: 379–384. DOI: 10.1177/1352458508098599. - DOI - PubMed
    1. Schultheis MT, Garay E and DeLuca J. The influence of cognitive impairment on driving performance in multiple sclerosis. Neurology 2001; 56: 1089–1094. - PubMed

Publication types

LinkOut - more resources