

Analysis of autoantibody profiles in two asbestiform fiber exposure cohorts
- PMID: 30230971
- PMCID: PMC6336195
- DOI: 10.1080/15287394.2018.1512432
Analysis of autoantibody profiles in two asbestiform fiber exposure cohorts
Abstract
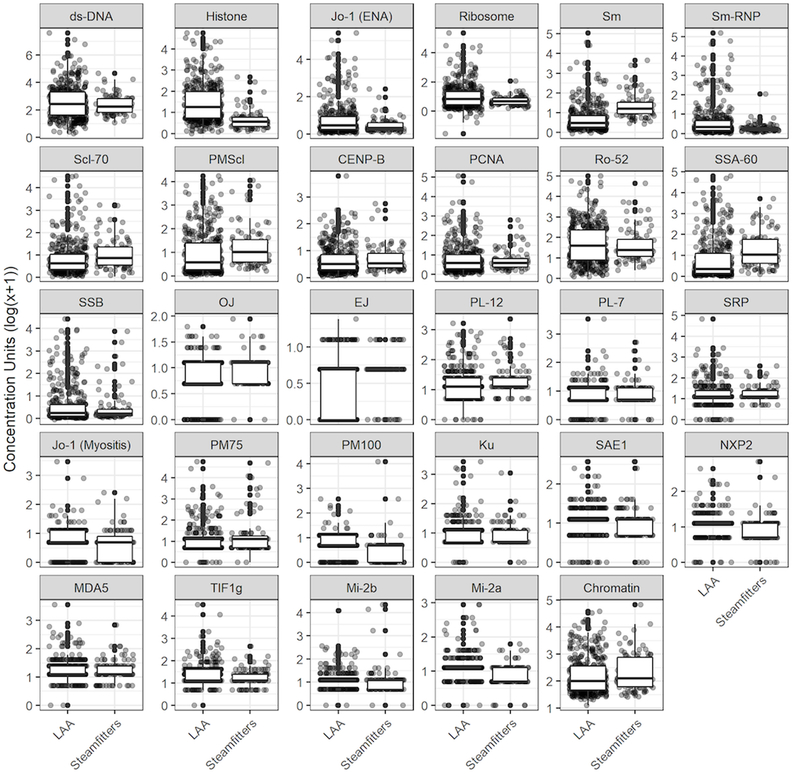
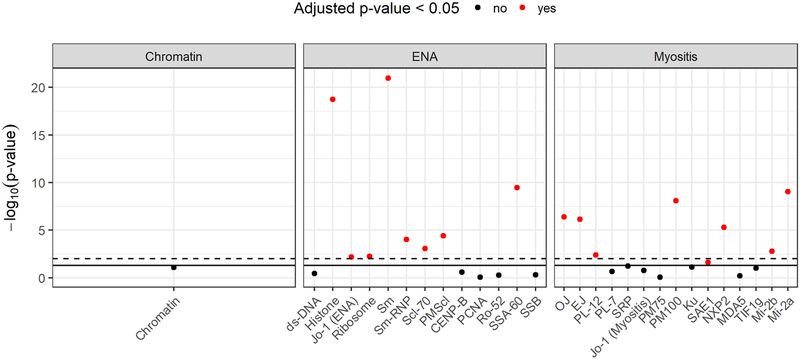
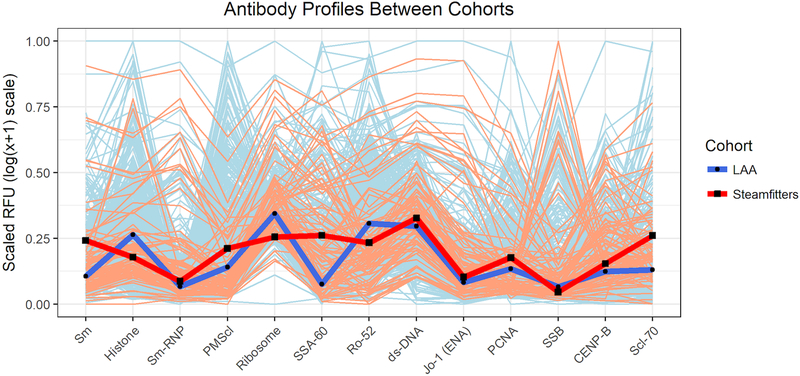
An increased risk for Systemic Autoimmune Diseases (SAID) was reported in the population of Libby, Montana, where extensive exposure to asbestiform amphiboles occurred through mining and use of asbestiform fiber-laden vermiculite. High frequencies of antinuclear autoantibodies (ANA) were detected in individuals and mice exposed to Libby Asbestiform Amphiboles (LAA). Among the 6603 individuals who have undergone health screening at the Center for Asbestos Related Diseases (CARD, Libby MT), the frequencies of rheumatoid arthritis, systemic lupus erythematosus, sarcoidosis, and systemic sclerosis are significantly higher than expected prevalence in the United States. While these data support the hypothesis that LAA can trigger autoimmune responses, evidence suggests that chrysotile asbestos does not. Serological testing was therefore performed in subjects exposed to LAA or predominantly chrysotile (New York steamfitters) using multiplexed array technologies. Analyses were performed in order to determine a) autoantibody profiles in each cohort, and b) whether the two populations could be distinguished through predictive modeling. Analysis using perMANOVA testing confirmed a significant difference between autoantibody profiles suggesting differential pathways leading to autoantibody formation. ANA were more frequent in the LAA cohort. Specific autoantibodies more highly expressed with LAA-exposure were to histone, ribosomal P protein, Sm/Ribonucleoproteins, and Jo-1 (histidyl tRNA synthetase). Myositis autoantibodies more highly expressed in the LAA cohort were Jo-1, PM100, NXP2, and Mi2a. Predictive modeling demonstrated that anti-histone antibodies were most predictive for LAA exposure, and anti-Sm was predictive for the steamfitters' exposure. This emphasizes the need to consider fiber types when evaluating risk of SAID with asbestos exposure.
Keywords: Asbestos; amphibole; autoantibodies; chrysotile; libby montana.
Conflict of interest statement
Disclosure of Interest:
Dr. Fritzler is a consultant to Inova Diagnostics Inc. (San Diego, CA) and Werfen International (Barcelona, Spain) and his laboratory has received gifts in kind from Euroimmun GmbH (Luebeck, Germany). The other authors have no conflicts of interest to disclose.
Figures
Similar articles
-
Case series: rheumatological manifestations attributed to exposure to Libby Asbestiform Amphiboles.J Toxicol Environ Health A. 2018;81(15):734-747. doi: 10.1080/15287394.2018.1485124. Epub 2018 Jun 21. J Toxicol Environ Health A. 2018. PMID: 29927712
-
Evaluation of anti-nuclear antibodies and kidney pathology in Lewis rats following exposure to Libby amphibole asbestos.J Immunotoxicol. 2013 Oct-Dec;10(4):329-33. doi: 10.3109/1547691X.2012.747230. Epub 2012 Dec 21. J Immunotoxicol. 2013. PMID: 23256773
-
Comparative health effects in mice of Libby amphibole asbestos and a fibrous amphibole from Arizona.Toxicol Appl Pharmacol. 2017 Nov 1;334:24-34. doi: 10.1016/j.taap.2017.08.022. Epub 2017 Sep 8. Toxicol Appl Pharmacol. 2017. PMID: 28870655
-
Libby vermiculite exposure and risk of developing asbestos-related lung and pleural diseases.Curr Opin Pulm Med. 2012 Mar;18(2):161-7. doi: 10.1097/MCP.0b013e32834e897d. Curr Opin Pulm Med. 2012. PMID: 22139761 Free PMC article. Review.
-
Amphibole asbestos as an environmental trigger for systemic autoimmune diseases.Autoimmun Rev. 2024 Jul-Aug;23(7-8):103603. doi: 10.1016/j.autrev.2024.103603. Epub 2024 Aug 20. Autoimmun Rev. 2024. PMID: 39154740 Free PMC article. Review.
Cited by
-
Occupational exposure to asbestos and silica and risk of developing rheumatoid arthritis: findings from a Swedish population-based case-control study.RMD Open. 2019 Jul 11;5(2):e000978. doi: 10.1136/rmdopen-2019-000978. eCollection 2019. RMD Open. 2019. PMID: 31413868 Free PMC article.
-
Autoantibodies and cancer among asbestos-exposed cohorts in Western Australia.J Toxicol Environ Health A. 2021 Jun 3;84(11):475-483. doi: 10.1080/15287394.2021.1889424. Epub 2021 Mar 7. J Toxicol Environ Health A. 2021. PMID: 33678145 Free PMC article.
-
Pneumoconiosis combined with connective tissue disease in China: a cross-sectional study.BMJ Open. 2023 Apr 3;13(4):e068628. doi: 10.1136/bmjopen-2022-068628. BMJ Open. 2023. PMID: 37012009 Free PMC article.
-
Autoimmune markers for progression of Libby amphibole lamellar pleural thickening.Inhal Toxicol. 2019 Sep-Oct;31(11-12):409-419. doi: 10.1080/08958378.2019.1699616. Epub 2019 Dec 8. Inhal Toxicol. 2019. PMID: 31814459 Free PMC article.
-
Lifetime Pesticide Use and Antinuclear Antibodies in Male Farmers From the Agricultural Health Study.Front Immunol. 2019 Jul 11;10:1476. doi: 10.3389/fimmu.2019.01476. eCollection 2019. Front Immunol. 2019. PMID: 31354699 Free PMC article.
References
-
- Anderson MJ 2001. A new method for non-arametric multivariate analysis of ariance. Austral Ecol 26: 32–46. doi:Doi 10.1046/J.1442-9993.2001.01070.X - DOI
-
- Benjamini Y, and Hochberg Y. 1995. Controlling the false discovery rate: A practical and powerful approach to multiple testing. J Roy Stat Soc Ser B 57289–300.
-
- Bernatsky SM, Smargiassi A, Joseph L, Awadall P, Comegna I, Hudson M, Fritzler MJ. 2017. Industrial air emissions, and proximity to major industrial emitters, are associated with anti-citrullinated protein antibodies. Environ Res 157:60–63. - PubMed
-
- Bernatsky SM, Pfau JC, and Fritzler MJ. 2017. Environmental exposures and biomarkers predictive of rheumatoid arthritis and the pathway to precision medicine. J Lab Precision Med 2: 1–4.
MeSH terms
Substances
Grants and funding
LinkOut - more resources
Full Text Sources
Other Literature Sources
Medical