. 2018 Sep 20;379(12):1128-1138.
doi: 10.1056/NEJMoa1716766.

Variation in Childhood Diarrheal Morbidity and Mortality in Africa, 2000-2015

Affiliations

Variation in Childhood Diarrheal Morbidity and Mortality in Africa, 2000-2015

Robert C Reiner Jr et al. N Engl J Med. .

Abstract

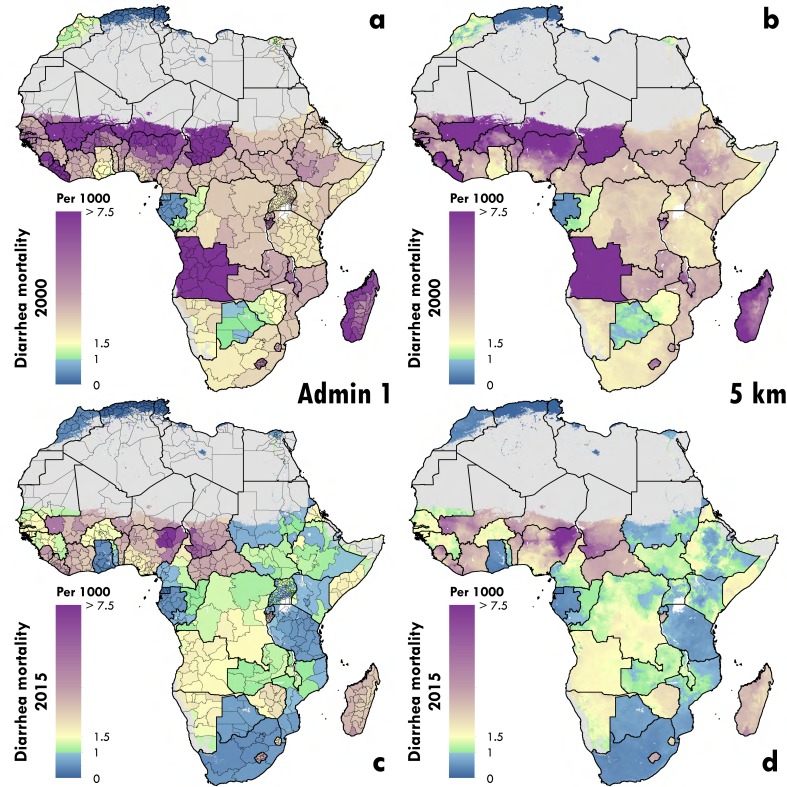
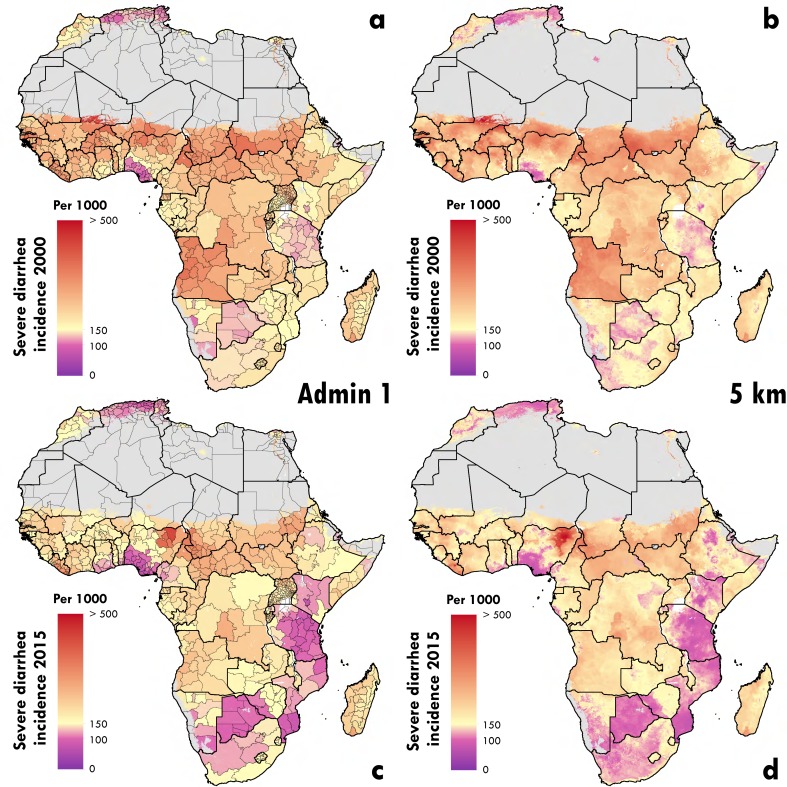
Background: Diarrheal diseases are the third leading cause of disease and death in children younger than 5 years of age in Africa and were responsible for an estimated 30 million cases of severe diarrhea (95% credible interval, 27 million to 33 million) and 330,000 deaths (95% credible interval, 270,000 to 380,000) in 2015. The development of targeted approaches to address this burden has been hampered by a paucity of comprehensive, fine-scale estimates of diarrhea-related disease and death among and within countries.

Methods: We produced annual estimates of the prevalence and incidence of diarrhea and diarrhea-related mortality with high geographic detail (5 km2) across Africa from 2000 through 2015. Estimates were created with the use of Bayesian geostatistical techniques and were calibrated to the results from the Global Burden of Diseases, Injuries, and Risk Factors Study 2016.

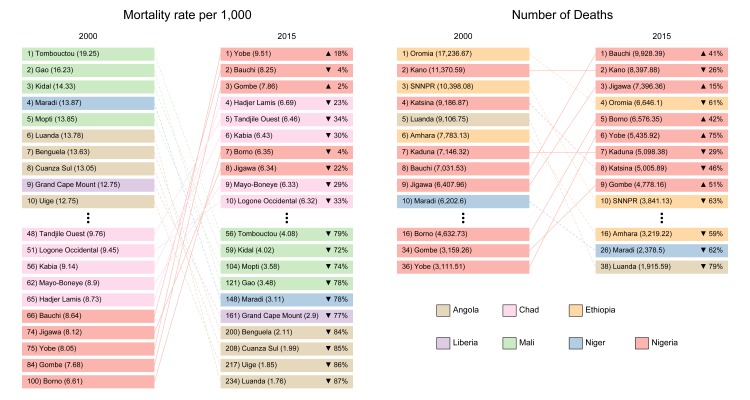
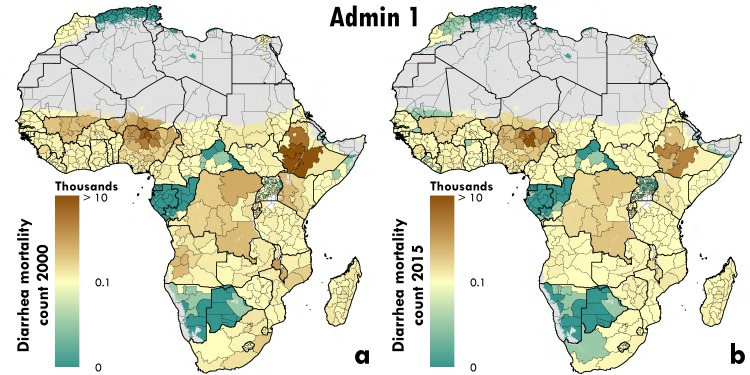
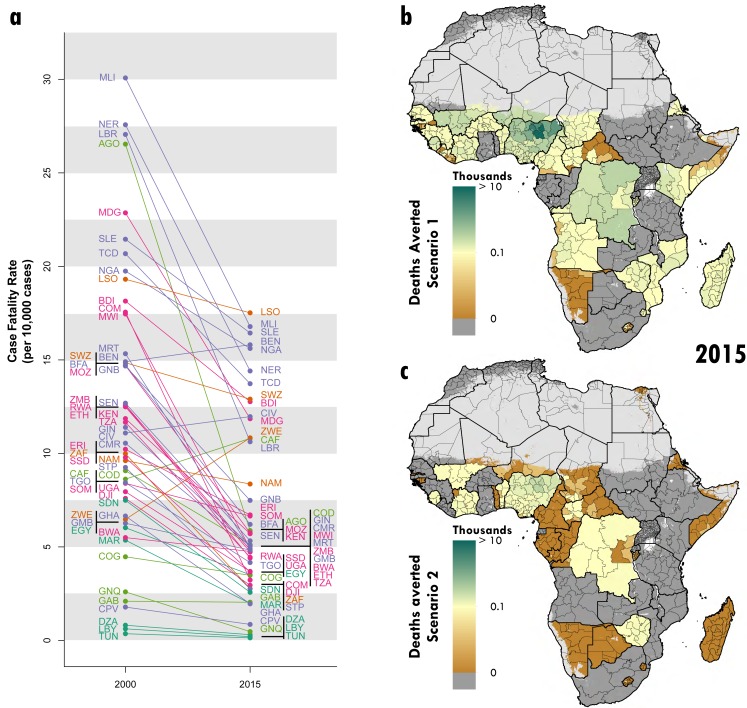
Results: The results revealed geographic inequality with regard to diarrhea risk in Africa. Of the estimated 330,000 childhood deaths that were attributable to diarrhea in 2015, more than 50% occurred in 55 of the 782 first-level administrative subdivisions (e.g., states). In 2015, mortality rates among first-level administrative subdivisions in Nigeria differed by up to a factor of 6. The case fatality rates were highly varied at the national level across Africa, with the highest values observed in Benin, Lesotho, Mali, Nigeria, and Sierra Leone.

Conclusions: Our findings showed concentrated areas of diarrheal disease and diarrhea-related death in countries that had a consistently high burden as well as in countries that had considerable national-level reductions in diarrhea burden. (Funded by the Bill and Melinda Gates Foundation.).


Figures

Figure 1: Diarrhea mortality rates in children under 5 in 2000 and
2015
Figure 1: Diarrhea mortality rates in children under 5 in 2000 and 2015
Panels A and B show the estimated mean rate per 1,000 of mortality attributable to diarrhea in 2000. Panels C and D show the estimated mean rate per 1,000 of mortality attributable to diarrhea in 2015. Panels B and D display the rates at the 5-km2 scale at which the model is fit. Panels A and C display the rates aggregated up to first administrative subdivision using population weighting. The color scales for mortality are set to indicate the locations in which the mean mortality rate estimates have achieved the GAPPD goal of less than 1 in 1,000. Pixels with fewer than ten people per 1-km2 and classified as “barren or sparsely vegetated” are colored in grey.
Figure 2: Ten highest number and rates of diarrhea associated mortality
by first administrative subdivision from 2000 to 2015
Figure 2: Ten highest number and rates of diarrhea associated mortality by first administrative subdivision from 2000 to 2015
The left panel shows the 10 first administrative subdivisions with the most childhood death counts associated with diarrhea in 2000 and 2015. The right panel shows the 10 first administrative units with the highest mortality rates (per 1,000) associated with diarrhea in 2000 and 2015. Regions not in the top 10 in both 2000 and 2015 are listed below vertical ellipses with associated year-specific rank. The lines connecting regions are solid if rank increased from 2000 to 2015 and dashed if the rank decreased. Relative change in values is shown in the 2015 columns. SNNPR: Southern Nations, Nationalities, and People’s Region.
Figure 3: Number of diarrheal deaths in children under 5 in 2000 and
2015
Figure 3: Number of diarrheal deaths in children under 5 in 2000 and 2015
Panel A shows the estimated mean number of diarrheal death counts in 2000. Panel B shows the estimated mean number of diarrheal death counts in 2015. Both panels display diarrheal death counts aggregated up to the first administrative subdivision using population weighting. All color scales are on a log scale. Pixels with fewer than ten people per 1-km2 and classified as “barren or sparsely vegetated” are colored in grey.
Figure 4: Severe diarrhea incidence rates in children under 5 in 2000 and
2015 in first administrative units
Figure 4: Severe diarrhea incidence rates in children under 5 in 2000 and 2015 in first administrative units
Panels A and B show the estimated mean rate per 1,000 of severe diarrhea episodes in 2000. Panels C and D show the estimated mean rate per 1,000 of severe diarrhea episodes in 2015. Panels B and D display the rates at the 5-km2 scale at which the model is fit. Panels A and C display the rates aggregated up to the first administrative subdivision using population weighting. Pixels with fewer than ten people per 1-km2 and classified as “barren or sparsely vegetated” are colored in grey.
Figure 5: Diarrhea CFR between 2000 and 2015 and deaths averted
Panel A shows each country’s diarrheal CFR value in 2000 and in 2015. Panel B shows “Scenario 1,” the estimated number of deaths averted had all countries with the highest 50% CFRs in 2015 achieved the median CFR in 2015. Panel C shows, “Scenario 2,” the estimated number of deaths averted had the countries with the worst change in CFR between 2000-2015 achieved the median CFR change during that time period. Pixels with fewer than ten people per 1-km2 and classified as “barren or sparsely vegetated” are colored in grey.

References

    1. GBD 2015 Diarrhoeal Diseases Collaborators. Estimates of global, regional, and national morbidity, mortality, and aetiologies of diarrhoeal diseases: a systematic analysis for the Global Burden of Disease Study 2015. Lancet Infect Dis 2017;17(9):909–48. - PMC - PubMed
    1. Parashar UD, Johnson H, Steele AD, Tate JE. Health Impact of Rotavirus Vaccination in Developing Countries: Progress and Way Forward. Clin Infect Dis Off Publ Infect Dis Soc Am 2016;62 Suppl 2:S91-95. - PMC - PubMed
    1. Paternina-Caicedo A, Parashar UD, Alvis-Guzmán N, et al. Effect of rotavirus vaccine on childhood diarrhea mortality in five Latin American countries. Vaccine 2015;33(32):3923–8. - PMC - PubMed
    1. Clasen T, Schmidt W-P, Rabie T, Roberts I, Cairncross S. Interventions to improve water quality for preventing diarrhoea: systematic review and meta-analysis. BMJ 2007;334(7597):782. - PMC - PubMed
    1. Cairncross S, Hunt C, Boisson S, et al. Water, sanitation and hygiene for the prevention of diarrhoea. Int J Epidemiol 2010;39(suppl 1):i193–205. - PMC - PubMed

Publication types