. 2018 Sep 18;16(9):341.
doi: 10.3390/md16090341.

Stress-Induced Mucus Secretion and Its Composition by a Combination of Proteomics and Metabolomics of the Jellyfish Aurelia coerulea

Affiliations

Stress-Induced Mucus Secretion and Its Composition by a Combination of Proteomics and Metabolomics of the Jellyfish Aurelia coerulea

Wenwen Liu et al. Mar Drugs. .

Abstract

Background: Jellyfish respond quickly to external stress that stimulates mucus secretion as a defense. Neither the composition of secreted mucus nor the process of secretion are well understood.

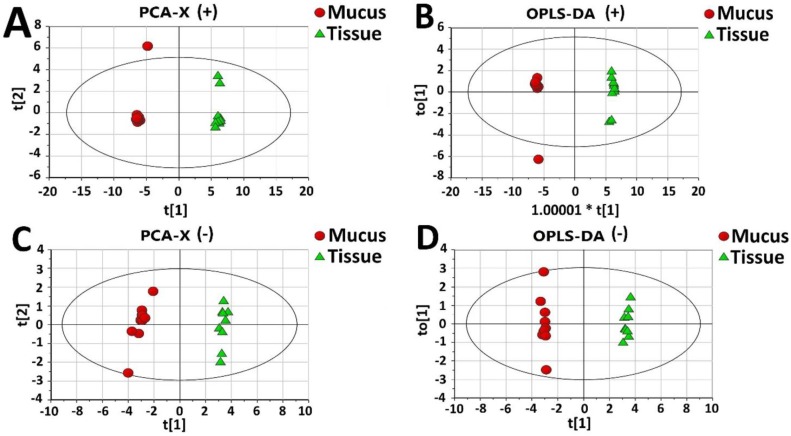
Methods: Aurelia coerulea jellyfish were stimulated by removing them from environmental seawater. Secreted mucus and tissue samples were then collected within 60 min, and analyzed by a combination of proteomics and metabolomics using liquid chromatography coupled with tandem mass spectrometry (LC-MS/MS) and ultra-performance liquid chromatography/quadrupole time-of-flight mass spectrometry (UPLC-QTOF-MS/MS), respectively.

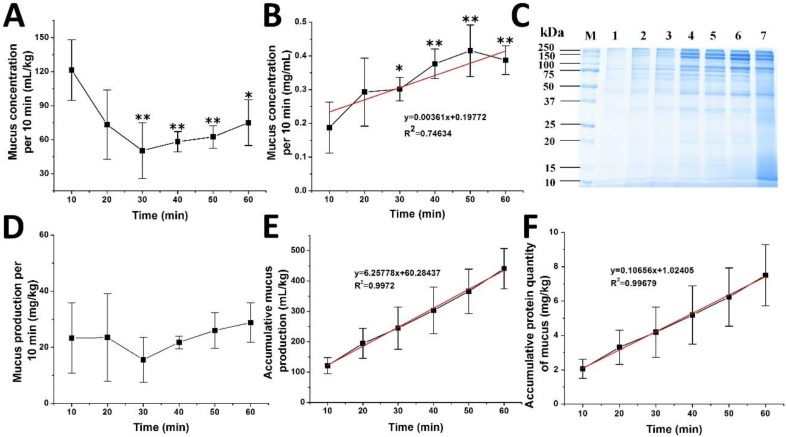
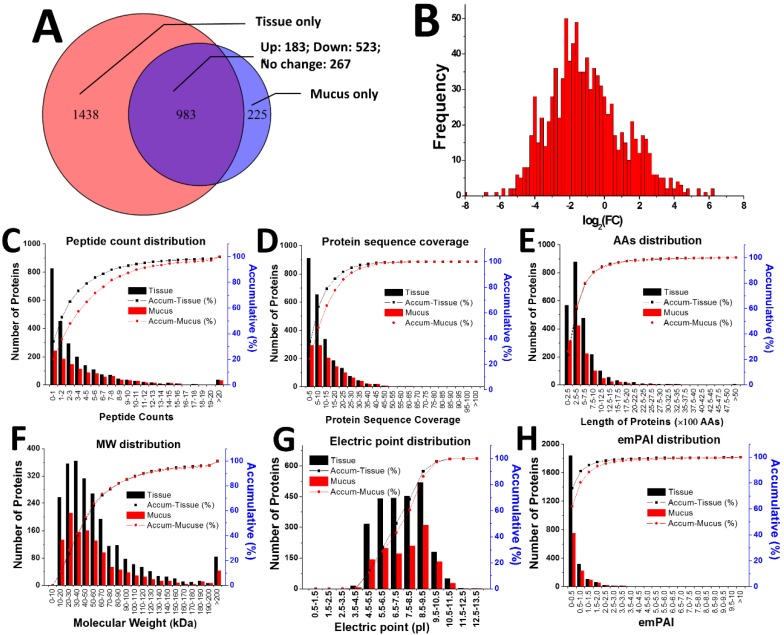
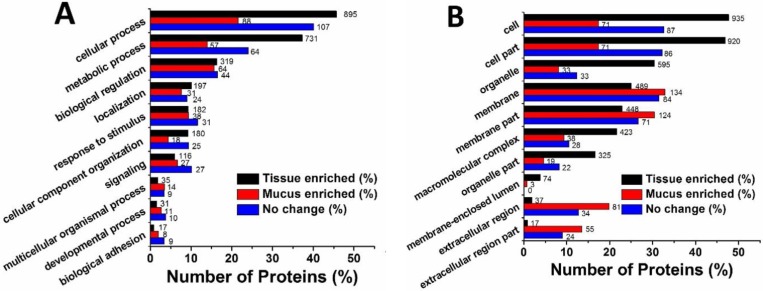
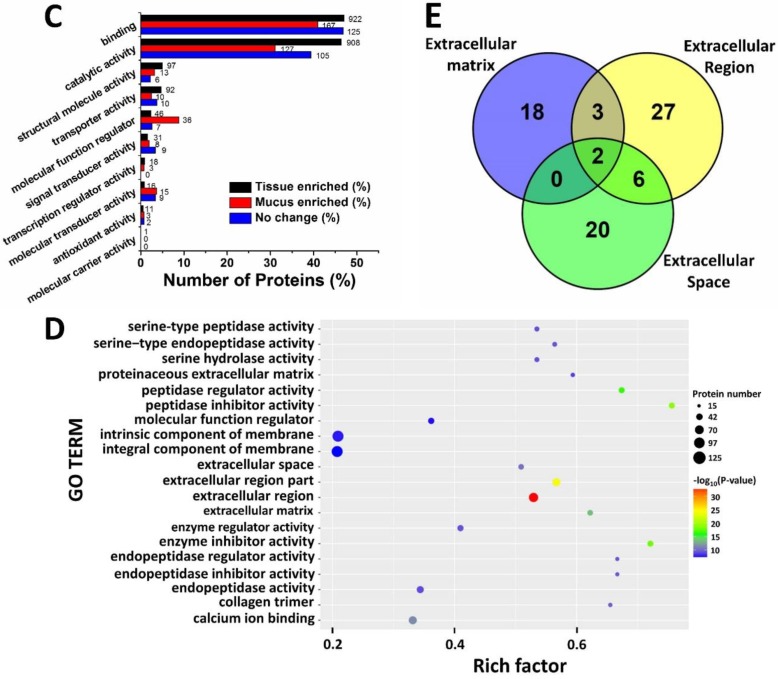
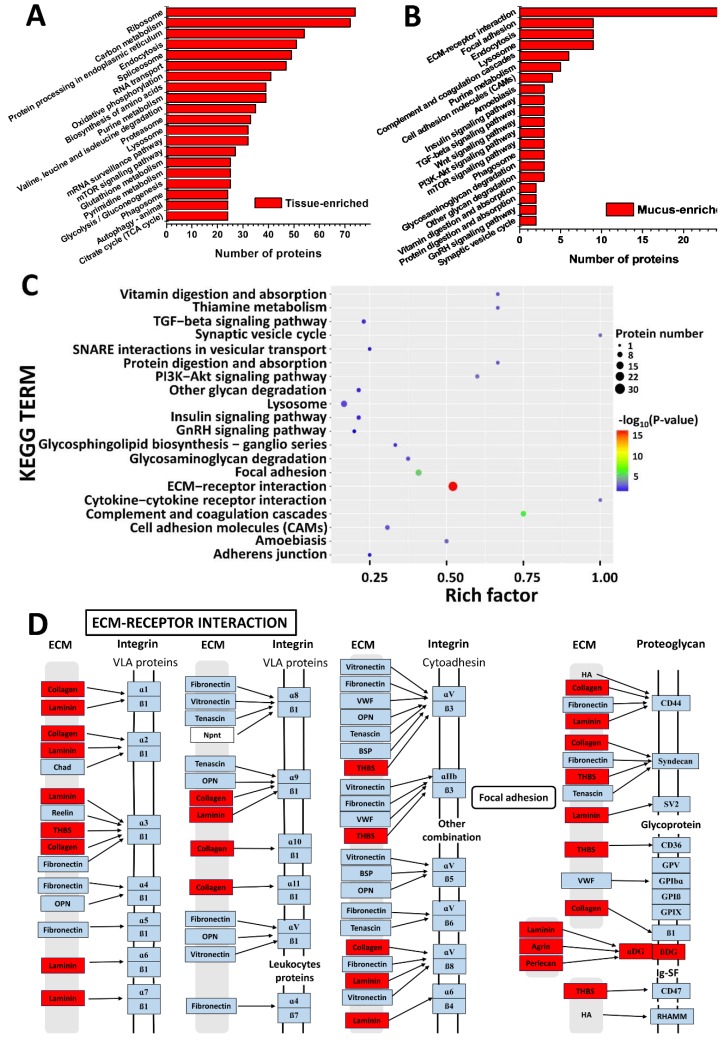
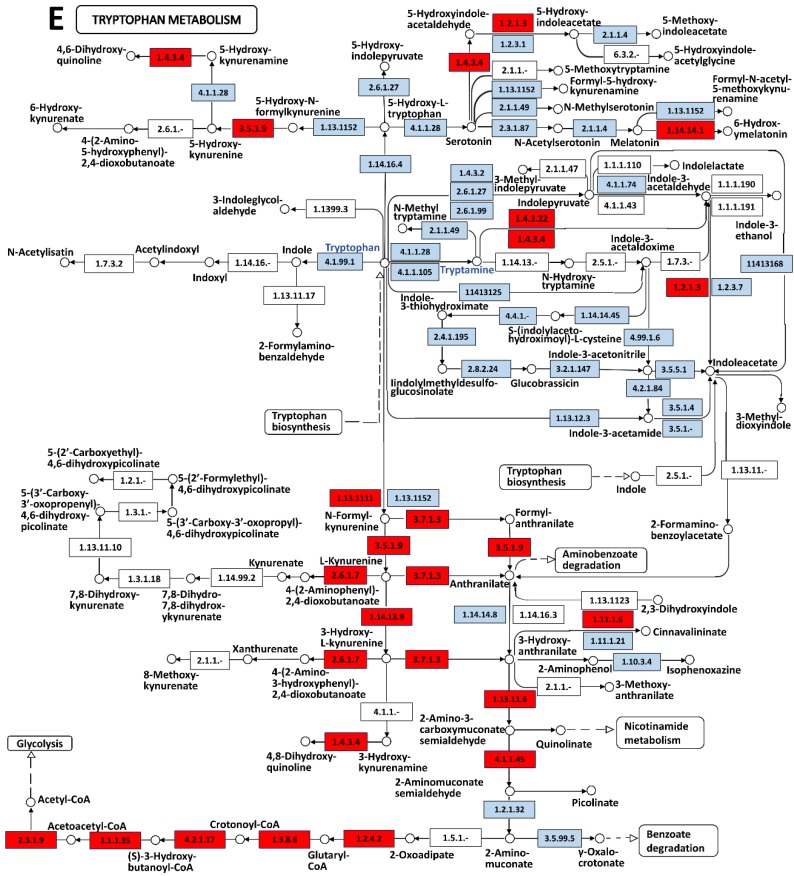
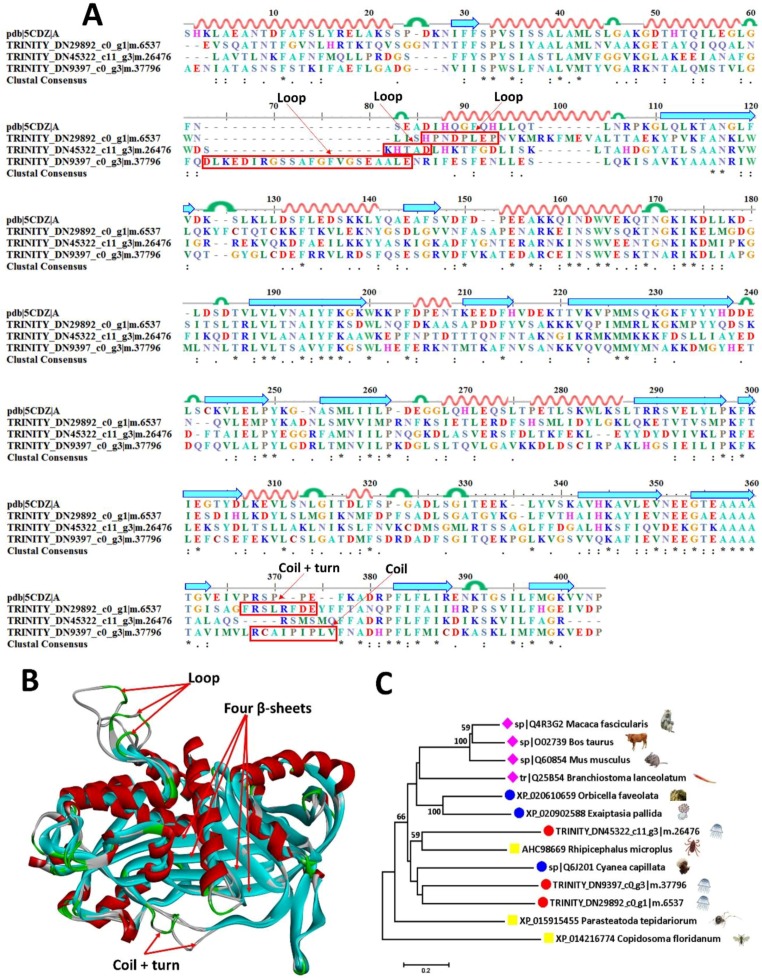
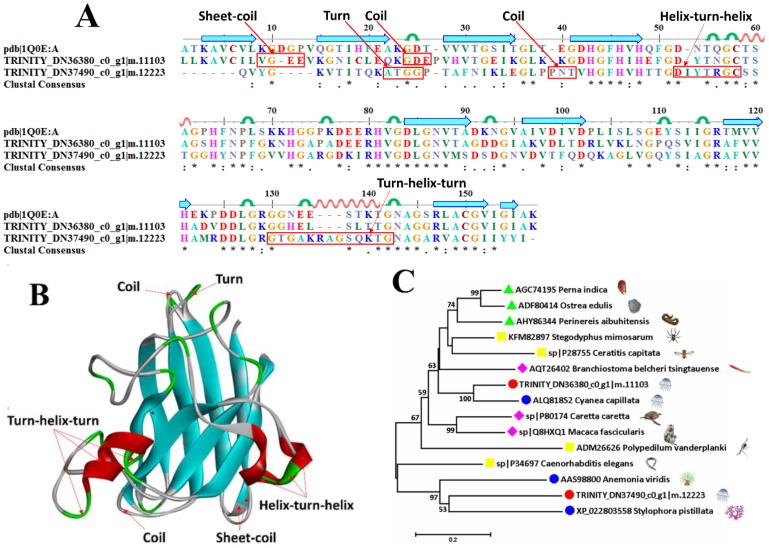
Results: Two phases of sample collection displayed a quick decrease in volume, followed by a gradual increase. A total of 2421 and 1208 proteins were identified in tissue homogenate and secreted mucus, respectively. Gene Ontology (GO) analysis showed that the mucus-enriched proteins are mainly located in extracellular or membrane-associated regions, while the tissue-enriched proteins are distributed throughout intracellular compartments. Tryptamine, among 16 different metabolites, increased with the largest-fold change value of 7.8 in mucus, which is consistent with its involvement in the Kyoto Encyclopedia of Genes and Genomes (KEGG) pathway 'tryptophan metabolism'. We identified 11 metalloproteinases, four serpins, three superoxide dismutases and three complements, and their presence was speculated to be related to self-protective defense.

Conclusions: Our results provide a composition profile of proteins and metabolites in stress-induced mucus and tissue homogenate of A. coerulea. This provides insight for the ongoing endeavors to discover novel bioactive compounds. The large increase of tryptamine in mucus may indicate a strong stress response when jellyfish were taken out of seawater and the active self-protective components such as enzymes, serpins and complements potentially play a key role in innate immunity of jellyfish.

Keywords: Aurelia coerulea; jellyfish; metabolomics; mucus; proteomics.


Conflict of interest statement

The authors declare no conflict of interest.

Figures

Figure 1
Figure 1
Stress-induced mucus secretion and autolysis of A. coerulea. (A) Mucus volume of each sample/10 min; (B) Protein concentration of each sample/10 min was determined by the Bradford method; (C) SDS-PAGE of collected mucus and tissue homogenate of A. coerulea. M: protein molecular size marker; Lanes 1–6: mucus samples of A. coerulea collected in 60 min; Lane 7: jellyfish tissue homogenate; (D) Protein quantity (mg/kg)/10 min; (E) Accumulative volume of mucus (mL/kg)/60 min; (F) Accumulative protein quantity of mucus (mg/kg)/60 min. Mean ± SD (n = 4) is shown. * p < 0.05 and ** p < 0.01 indicate a significance difference as compared to the control.
Figure 2
Figure 2
Proteomic comparison of secreted mucus and tissue homogenate. (A) Venn diagram of protein composition in mucus and tissue. There were 2421 proteins identified in tissue and 1208 identified in mucus. 1438 and 225 proteins were only found in tissue and mucus, respectively. Of these 983 overlapping proteins in both groups, 183 were found at elevated levels in mucus, while 523 were at lower levels and 267 were at consistent levels when compared to those in tissue. (B) Histogram of quantitative ratio of the overlapped proteins between the two groups. The log2(FC) (fold change) value from mucus (numerator) vs. tissue (denominator) is distributed mainly between −6 to +6, with a peak located at around −2 instead of 0. Six indexes, including peptide count distribution (C), protein sequence coverage (D), AA distribution (E), MW distribution (F), electric point distribution (G), and emPAI distribution (H), are compared for tissue and mucus.
Figure 3
Figure 3
Comparative Gene Ontology (GO) analysis of identified proteins in tissue and mucus of A. coerulea. Three groups, namely ‘tissue-enriched proteins’, ‘mucus-enriched proteins’, and ‘proteins with no change’ are displayed. The tissue-enriched proteins or mucus-enriched proteins represent proteins exclusively and highly expressed in tissue homogenate (FC < 0.5) or secreted mucus (FC > 2). The group ‘proteins with no change’ implies that the proteins expressed in both mucus and tissue show no obvious difference (0.5 < FC < 2). (A) Biological process (BP). The horizontal axis is the ratio of proteins in the total identified proteins, whereas the vertical axis provides description of the matched GO terms. The protein numbers are labeled on the right side of each transverse column. (B) Cellular component (CC). (C) Molecular function (MF). (D) Diagram of GO enrichment in mucus-enriched proteins. The horizontal axis indicates the rich factor, i.e., the proportion of the number of differentially expressed proteins vs. the total number of proteins in the same GO term. The vertical ordinates represent the matched GO terms. The bubble shows the number of proteins matched in each GO term. The color represents −log10(p value): Logarithmic conversion of Fisher exact test p value. (E) Venn diagram of the extracellular proteins in mucus-enriched proteins. Three subclasses ‘extracellular matrix’, ‘extracellular region’ and ‘extracellular space’ are colored by blue, yellow and green, respectively.
Figure 3
Figure 3
Comparative Gene Ontology (GO) analysis of identified proteins in tissue and mucus of A. coerulea. Three groups, namely ‘tissue-enriched proteins’, ‘mucus-enriched proteins’, and ‘proteins with no change’ are displayed. The tissue-enriched proteins or mucus-enriched proteins represent proteins exclusively and highly expressed in tissue homogenate (FC < 0.5) or secreted mucus (FC > 2). The group ‘proteins with no change’ implies that the proteins expressed in both mucus and tissue show no obvious difference (0.5 < FC < 2). (A) Biological process (BP). The horizontal axis is the ratio of proteins in the total identified proteins, whereas the vertical axis provides description of the matched GO terms. The protein numbers are labeled on the right side of each transverse column. (B) Cellular component (CC). (C) Molecular function (MF). (D) Diagram of GO enrichment in mucus-enriched proteins. The horizontal axis indicates the rich factor, i.e., the proportion of the number of differentially expressed proteins vs. the total number of proteins in the same GO term. The vertical ordinates represent the matched GO terms. The bubble shows the number of proteins matched in each GO term. The color represents −log10(p value): Logarithmic conversion of Fisher exact test p value. (E) Venn diagram of the extracellular proteins in mucus-enriched proteins. Three subclasses ‘extracellular matrix’, ‘extracellular region’ and ‘extracellular space’ are colored by blue, yellow and green, respectively.
Figure 4
Figure 4
Kyoto Encyclopedia of Genes and Genomes (KEGG) pathway annotation of identified proteins in tissue and mucus of A. coerulea. (A) KEGG pathway annotation of tissue-enriched proteins. The horizontal axis is the number of proteins, whereas the vertical ordinates are the terms of the KEGG pathways. (B) KEGG pathway annotation of mucus-enriched proteins. (C) KEGG pathway enrichment of mucus-enriched proteins. The horizontal axis indicates rich factor and vertical ordinates are the terms of the KEGG pathways. Rich factor is the proportion of the number of differentially expressed proteins vs. the total number of proteins in the same KEGG pathway. The bubble shows the number of proteins matched in the KEGG pathway. The color represents −log10(p value): Logarithmic conversion of Fisher exact test p value. (D) The ‘ECM-receptor interaction’ pathway matched from the KEGG PATHWAY database where the elevated proteins from mucus-enriched proteins are colored by red.
Figure 5
Figure 5
Plots of multivariate statistical analysis of all experimental groups in electrospray ionization (ESI) positive and negative-ion MS detection modes. The difference in substances between the two groups was screened by a variable importance plot (VIP). (A) Principal component analysis-X variogram (PCA-X) (+) and (B) Orthogonal partial least-squares-discriminant analysis (OPLS-DA) (+) scores plot of the mucus and tissue groups in the ESI positive-ion mode. Asterisk (*) indicates multiplication sign. (C) PCA-X (−) and (D) OPLS-DA (−) scores plot of the mucus and tissue groups in the ESI negative ion mode. The red plots represent the data from the secreted mucus, whereas the green plots represent data from the tissue homogenate. (E) The ‘Tryptophan metabolism’ pathway from KEGG PATHWAY database where the mRNAs from the transcriptomics of jellyfish tissue are colored by red, while the light blue and white boxes represent the background genes annotated or not in the KEGG PATHWAY database. Meanwhile, the metabolites ‘Tryptophan’ and ‘Trytamine’ are highlighted by blue.
Figure 5
Figure 5
Plots of multivariate statistical analysis of all experimental groups in electrospray ionization (ESI) positive and negative-ion MS detection modes. The difference in substances between the two groups was screened by a variable importance plot (VIP). (A) Principal component analysis-X variogram (PCA-X) (+) and (B) Orthogonal partial least-squares-discriminant analysis (OPLS-DA) (+) scores plot of the mucus and tissue groups in the ESI positive-ion mode. Asterisk (*) indicates multiplication sign. (C) PCA-X (−) and (D) OPLS-DA (−) scores plot of the mucus and tissue groups in the ESI negative ion mode. The red plots represent the data from the secreted mucus, whereas the green plots represent data from the tissue homogenate. (E) The ‘Tryptophan metabolism’ pathway from KEGG PATHWAY database where the mRNAs from the transcriptomics of jellyfish tissue are colored by red, while the light blue and white boxes represent the background genes annotated or not in the KEGG PATHWAY database. Meanwhile, the metabolites ‘Tryptophan’ and ‘Trytamine’ are highlighted by blue.
Figure 6
Figure 6
Sequence alignment, 3D modeling and phylogenetic analysis of putative zinc metalloproteinases from A. coerulea. (A) Three putative sequences TRINITY_DN45838_c0_g1|m.27904, TRINITY_DN44124_c13_g11|m.23323, and TRINITY_DN35212_c0_g1|m.10040 in mucus-enriched proteins are aligned with a model metalloproteinase (pdb ID: 3LQB). At the bottom of columns, asterisks (*) show conserved positions, colons (:) show conserved substitutions and points (.) show non-conserved substitutions. Grey line, green bend, blue banded arrowhead and red solenoid represent coil, turn, sheet and helix, respectively. Different fragments are framed by red lines. (B) 3D modeling was simulated using the template metalloproteinase (pdb ID: 3LQB) by SWISS-MODEL and viewed by Discovery Studio 4.5. The colors grey, green, blue and red represent coils, turns, sheets and helices, respectively. Different fragments are indicated by red arrows. (C) Phylogenetic tree constructed using three putative zinc metalloproteinases and 11 other sequences from different species using MEGA 7 with the Neighbor-Joining method.
Figure 7
Figure 7
Sequence alignment, 3D modeling and phylogenetic analysis of the putative serpins from A. coerulea. (A) Three putative sequences TRINITY_DN45322_c11_g3|m.26476, TRINITY_DN9397_c0_g3|m.37796, and TRINITY_DN29892_c0_g1|m.6537 in mucus-enriched proteins are aligned with a model serpin (pdb ID: 5CDZ). At the bottom of columns, asterisks (*) show conserved positions, colons (:) show conserved substitutions and points (.) show non-conserved substitutions. Grey line, green bend, blue banded arrowhead and red solenoid represent coil, turn, sheet and helix, respectively. Different fragments are framed by red lines. (B) 3D modeling was simulated using the template serpin (pdb ID: 5CDZ) by SWISS-MODEL and viewed by Discovery Studio 4.5. The colors grey, green, blue and red represent coils, turns, sheets and helices, respectively. Different fragments are indicated by red arrows. (C) Phylogenetic tree constructed by three putative serpins and 10 other sequences from different species using MEGA 7 with the Neighbor-Joining method.
Figure 8
Figure 8
Sequence alignment, 3D modeling and phylogenetic analysis of the putative Cu/Zn superoxide dismutases (SODs) from A. coerulea. (A) Two putative sequences, TRINITY_DN36380_c0_g1|m.11103 and TRINITY_DN37490_c0_g1|m.12223, in mucus-enriched proteins are aligned with a model SOD (pdb ID: 1Q0E). At the bottom of columns, asterisks (*) show conserved positions, colons (:) show conserved substitutions and points (.) show non-conserved substitutions. Grey lines, green bends, blue-banded arrowheads and red solenoids represent coils, turns, sheets and helices, respectively. Different sections are framed by red lines. (B) 3D modeling was simulated using the template SOD (pdb ID: 1Q0E) by SWISS-MODEL and viewed by Discovery Studio 4.5. The colors grey, green, blue and red represent coils, turns, sheets and helices, respectively. Different sections are indicated by red arrows. (C) Phylogenetic tree constructed by two putative SODs in mucus-enriched proteins and 13 representative sequences from different species by MEGA 7 with the Neighbor-Joining method.

Similar articles

Cited by

References

    1. Zoccarato L., Celussi M., Pallavicini A., Fonda Umani S. Aurelia aurita Ephyrae Reshape a Coastal Microbial Community. Front. Microbiol. 2016;7:749. doi: 10.3389/fmicb.2016.00749. - DOI - PMC - PubMed
    1. Li R., Yu H., Xue W., Yue Y., Liu S., Xing R., Li P. Jellyfish venomics and venom gland transcriptomics analysis of Stomolophus meleagris to reveal the toxins associated with sting. J. Proteom. 2014;106:17–29. doi: 10.1016/j.jprot.2014.04.011. - DOI - PubMed
    1. Wilcox C.L., Headlam J.L., Doyle T.K., Yanagihara A.A. Assessing the Efficacy of First-Aid Measures in Physalia sp. Envenomation, Using Solution- and Blood Agarose-Based Models. Toxins. 2017;9:149. doi: 10.3390/toxins9050149. - DOI - PMC - PubMed
    1. Zhang L., He Q., Wang Q., Zhang B., Wang B., Xu F., Wang T., Xiao L., Zhang L. Intracellular Ca2+ overload induced by extracellular Ca2+ entry plays an important role in acute heart dysfunction by tentacle extract from the jellyfish Cyanea capillata. Cardiovasc. Toxicol. 2014;14:260–274. doi: 10.1007/s12012-014-9250-6. - DOI - PubMed
    1. Lazcanopérez F., Arellano R.O., Garay E., Arreguínespinosa R., Sánchezrodríguez J. Electrophysiological activity of a neurotoxic fraction from the venom of box jellyfish Carybdea marsupialis. Comp. Biochem. Physiol. Part C Toxicol. Pharmacol. 2017;191:177–182. doi: 10.1016/j.cbpc.2016.10.010. - DOI - PubMed

LinkOut - more resources