

d-Amino Acid Pseudopeptides as Potential Amyloid-Beta Aggregation Inhibitors
- PMID: 30231520
- PMCID: PMC6225248
- DOI: 10.3390/molecules23092387
d-Amino Acid Pseudopeptides as Potential Amyloid-Beta Aggregation Inhibitors
Abstract
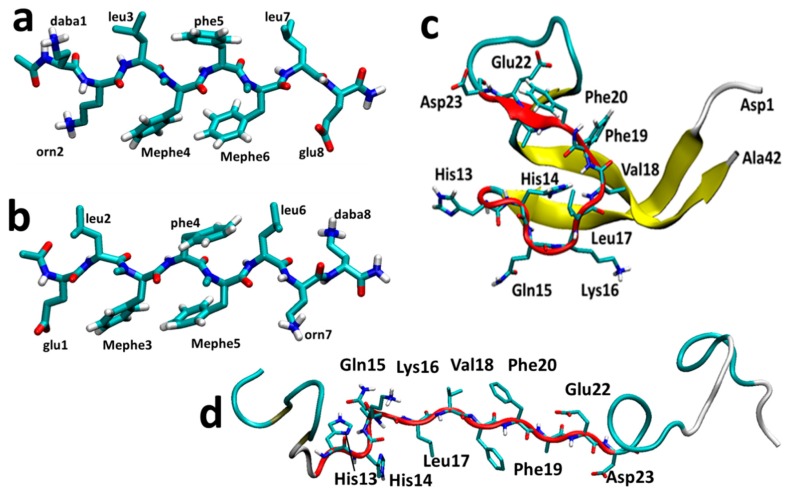
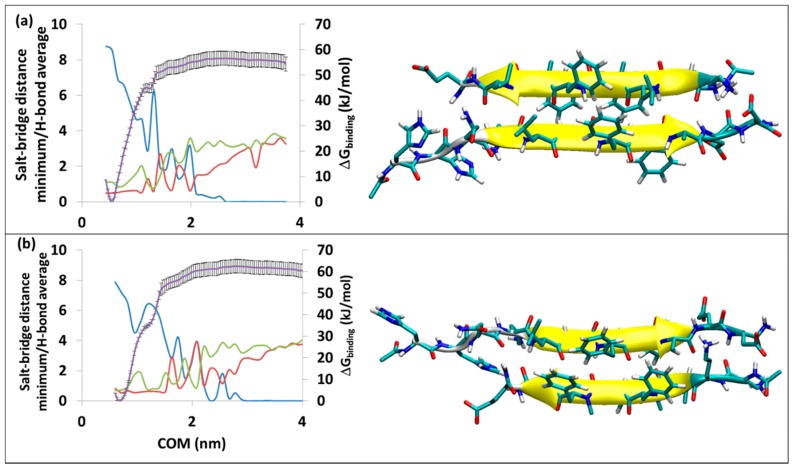
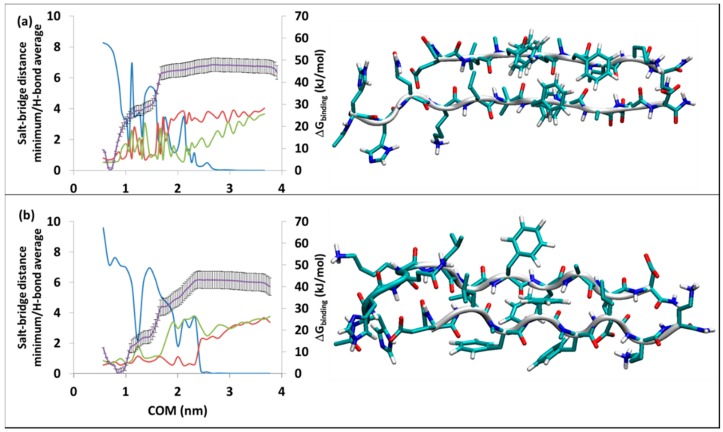
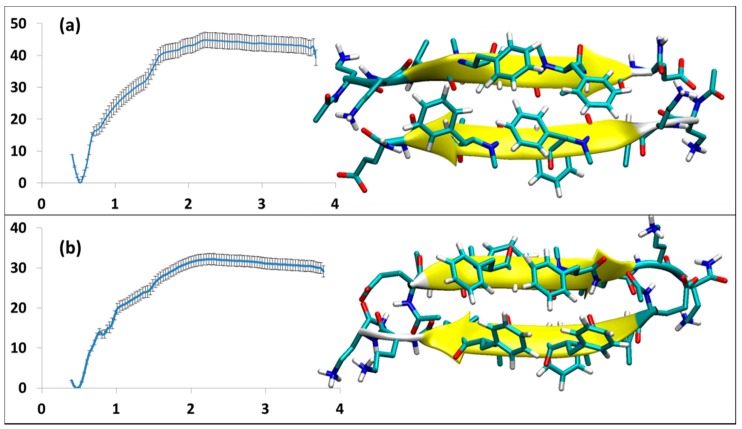
A causative factor for neurotoxicity associated with Alzheimer's disease is the aggregation of the amyloid-β (Aβ) peptide into soluble oligomers. Two all d-amino acid pseudo-peptides, SGB1 and SGD1, were designed to stop the aggregation. Molecular dynamics (MD) simulations have been carried out to study the interaction of the pseudo-peptides with both Aβ13⁻23 (the core recognition site of Aβ) and full-length Aβ1⁻42. Umbrella sampling MD calculations have been used to estimate the free energy of binding, ∆G, of these peptides to Aβ13⁻23. The highest ∆Gbinding is found for SGB1. Each of the pseudo-peptides was also docked to Aβ1⁻42 and subjected up to seven microseconds of all atom molecular dynamics simulations. The resulting structures lend insight into how the dynamics of Aβ1⁻42 are altered by complexation with the pseudo-peptides and confirmed that SGB1 may be a better candidate for developing into a drug to prevent Alzheimer's disease.
Keywords: Alzheimer’s; amyloid-beta; d-amino acids; inhibitors; molecular dynamics; umbrella sampling.
Conflict of interest statement
The authors declare no conflict of interest.
Figures
Similar articles
-
Pseudopeptide Amyloid Aggregation Inhibitors: In Silico, Single Molecule and Cell Viability Studies.Int J Mol Sci. 2021 Jan 21;22(3):1051. doi: 10.3390/ijms22031051. Int J Mol Sci. 2021. PMID: 33494369 Free PMC article.
-
Aβ monomers transiently sample oligomer and fibril-like configurations: ensemble characterization using a combined MD/NMR approach.J Mol Biol. 2013 Sep 23;425(18):3338-59. doi: 10.1016/j.jmb.2013.06.021. Epub 2013 Jun 25. J Mol Biol. 2013. PMID: 23811057 Free PMC article.
-
Evaluation of the Ability of Wasp Venom Bioinspired Peptides (Fraternine-10 and Octovespin) in the Disaggregation and Anti-Aggregation of Amyloid-β Fibrils.Proteins. 2025 Jul;93(7):1257-1268. doi: 10.1002/prot.26806. Epub 2025 Feb 24. Proteins. 2025. PMID: 39989313
-
Rationally Designed Peptides and Peptidomimetics as Inhibitors of Amyloid-β (Aβ) Aggregation: Potential Therapeutics of Alzheimer's Disease.ACS Comb Sci. 2017 Feb 13;19(2):55-80. doi: 10.1021/acscombsci.6b00116. Epub 2017 Jan 18. ACS Comb Sci. 2017. PMID: 28045249 Review.
-
Elucidating the Structures of Amyloid Oligomers with Macrocyclic β-Hairpin Peptides: Insights into Alzheimer's Disease and Other Amyloid Diseases.Acc Chem Res. 2018 Mar 20;51(3):706-718. doi: 10.1021/acs.accounts.7b00554. Epub 2018 Mar 6. Acc Chem Res. 2018. PMID: 29508987 Free PMC article. Review.
Cited by
-
Pseudopeptide Amyloid Aggregation Inhibitors: In Silico, Single Molecule and Cell Viability Studies.Int J Mol Sci. 2021 Jan 21;22(3):1051. doi: 10.3390/ijms22031051. Int J Mol Sci. 2021. PMID: 33494369 Free PMC article.
-
Computer-Aided Drug Design of β-Secretase, γ-Secretase and Anti-Tau Inhibitors for the Discovery of Novel Alzheimer's Therapeutics.Int J Mol Sci. 2020 Jan 21;21(3):703. doi: 10.3390/ijms21030703. Int J Mol Sci. 2020. PMID: 31973122 Free PMC article. Review.
-
Stereoselectivity of Interaction of Nonsteroidal Anti-Inflammatory Drug S-Ketoprofen with L/D-Tryptophan in Phospholipid Membranes.Membranes (Basel). 2022 Apr 24;12(5):460. doi: 10.3390/membranes12050460. Membranes (Basel). 2022. PMID: 35629787 Free PMC article.
-
Polymer Conjugates of Antimicrobial Peptides (AMPs) with d-Amino Acids (d-aa): State of the Art and Future Opportunities.Pharmaceutics. 2022 Feb 19;14(2):446. doi: 10.3390/pharmaceutics14020446. Pharmaceutics. 2022. PMID: 35214178 Free PMC article. Review.
References
MeSH terms
Substances
Grants and funding
LinkOut - more resources
Full Text Sources
Other Literature Sources
