. 2018 Sep 18;10(9):509.
doi: 10.3390/v10090509.

Estimating Vaccine-Driven Selection in Seasonal Influenza

Affiliations

Estimating Vaccine-Driven Selection in Seasonal Influenza

Frank T Wen et al. Viruses. .

Abstract

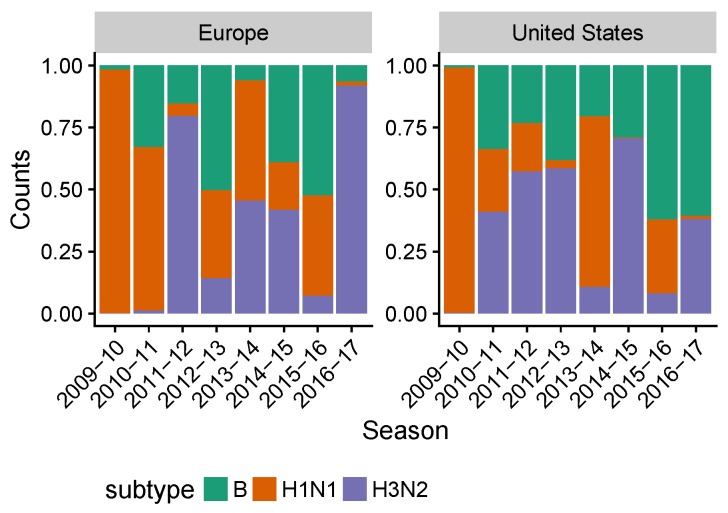
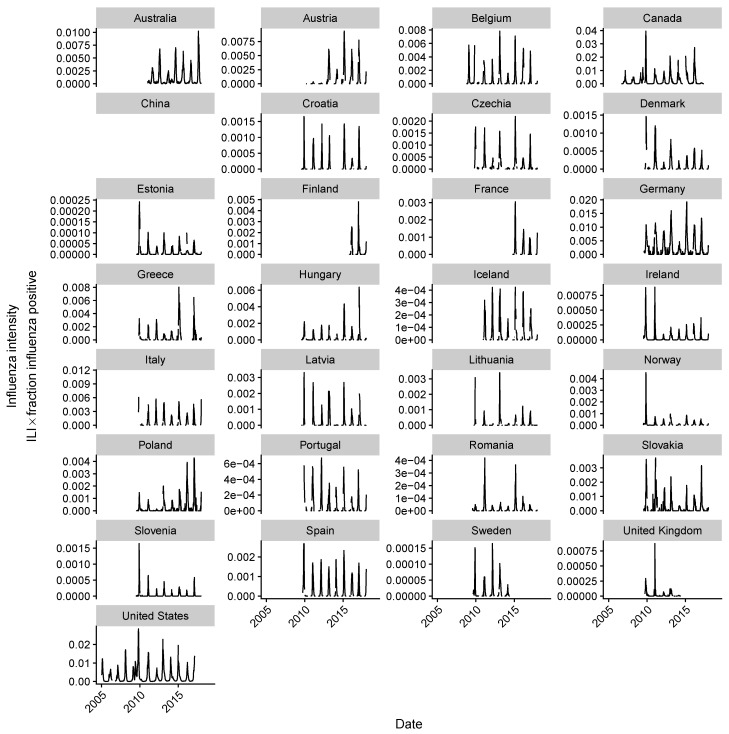
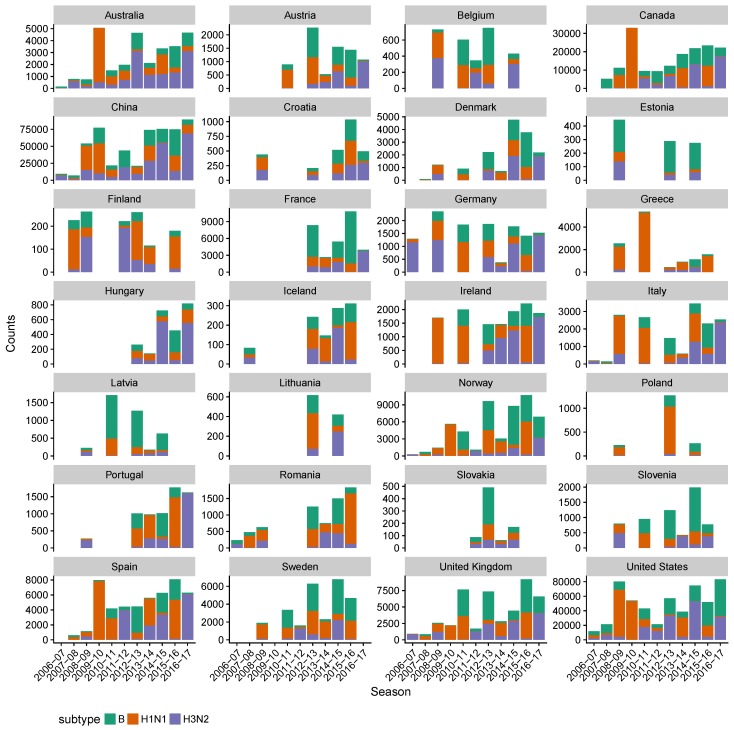
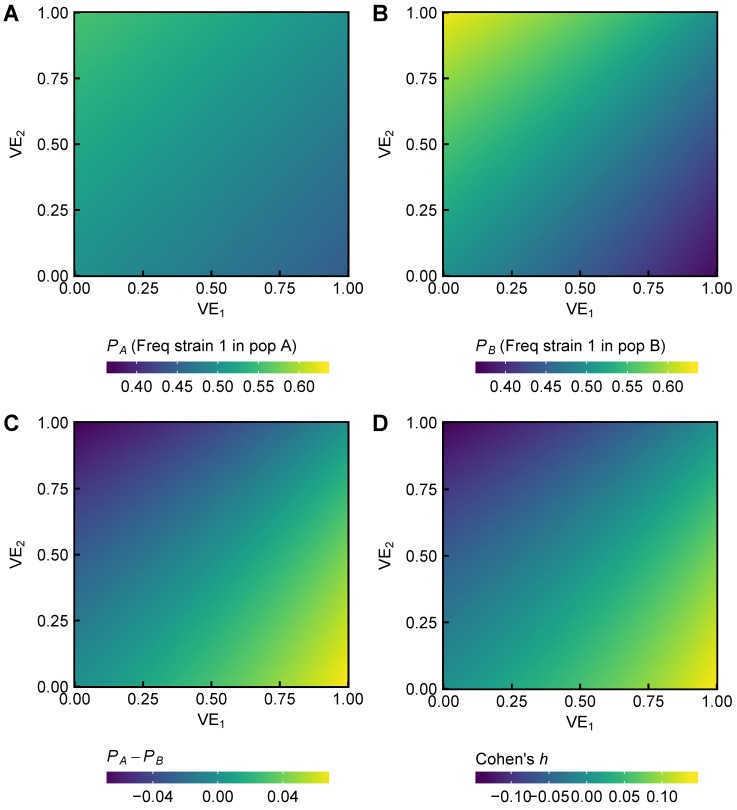
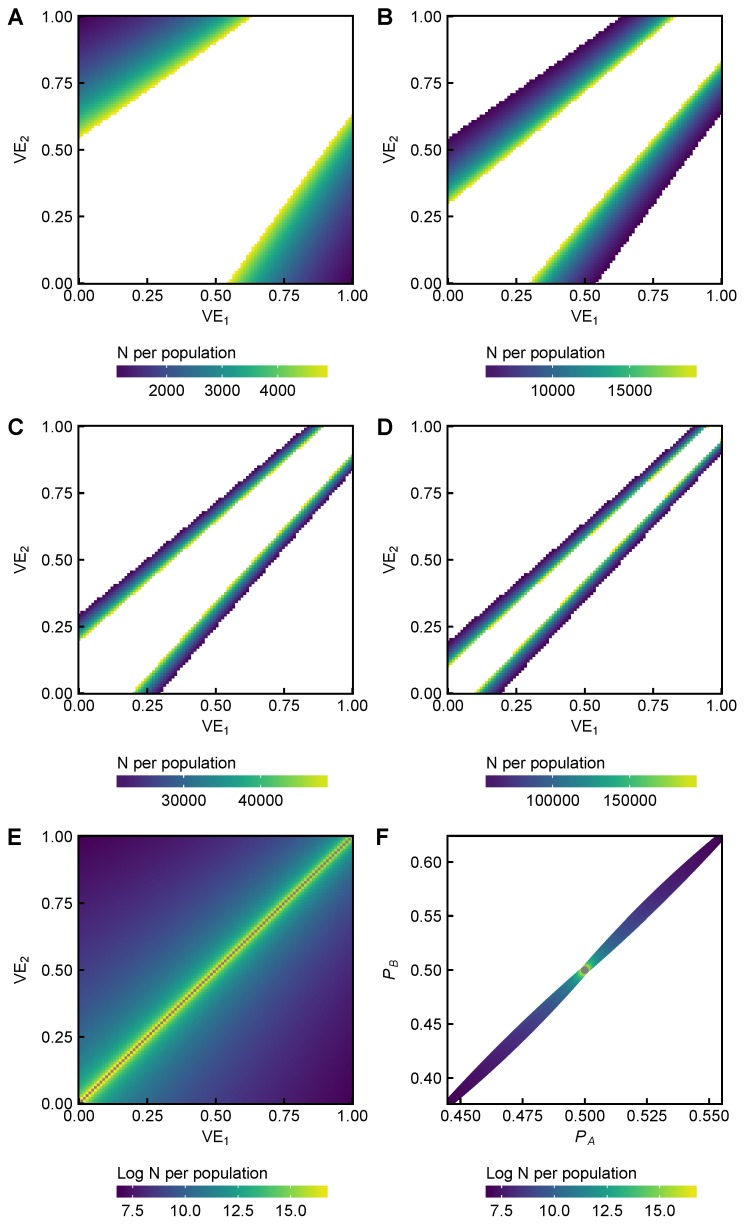
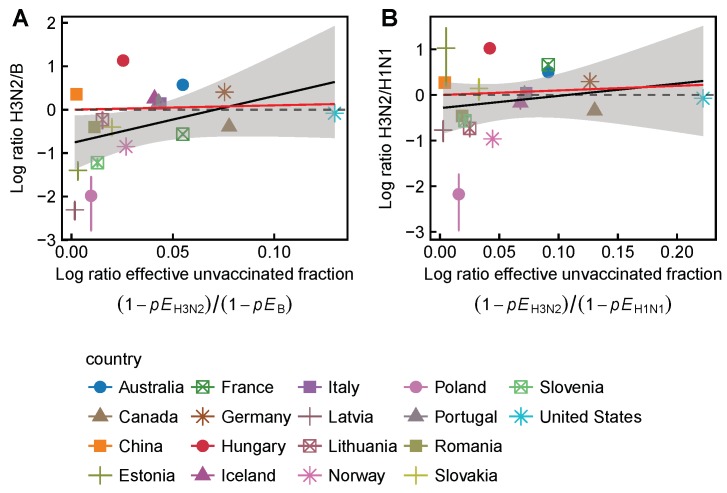
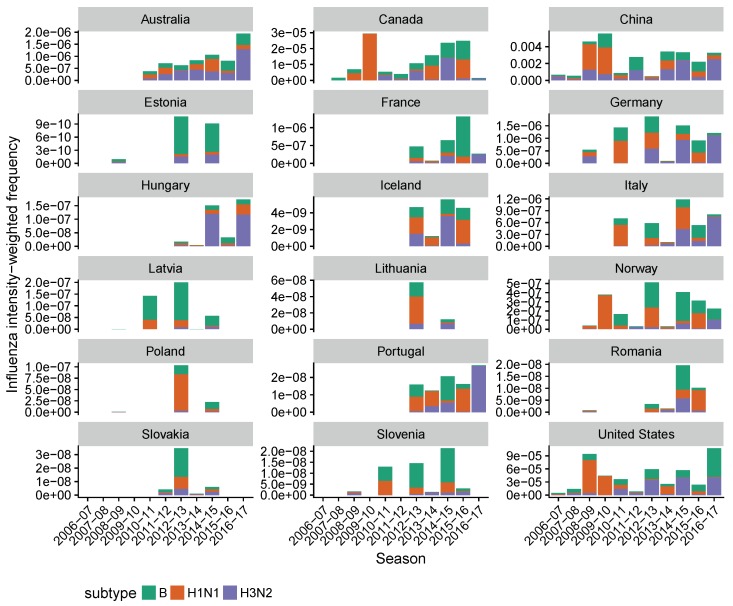
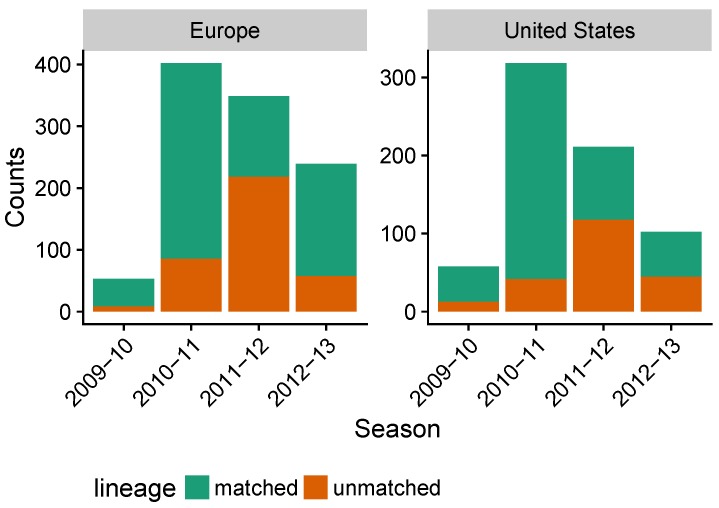
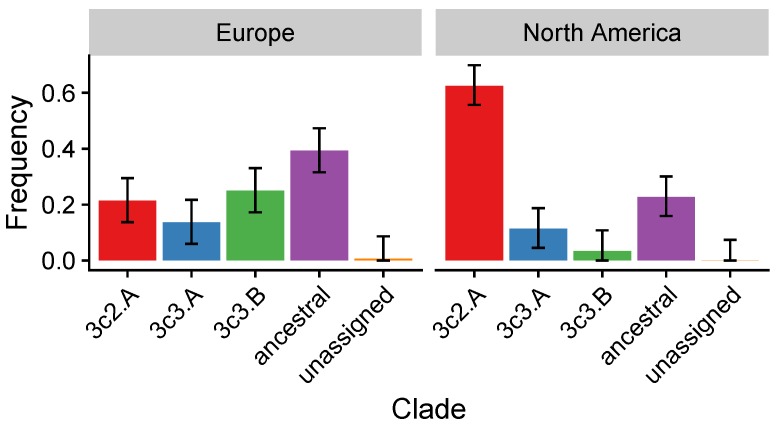
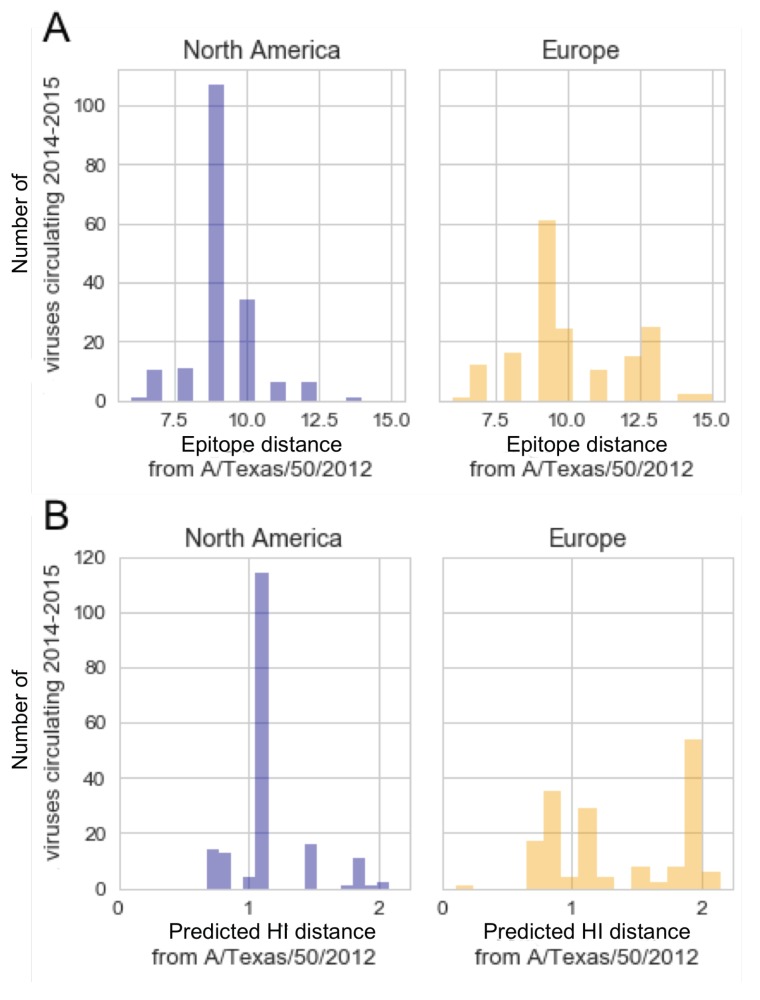
Vaccination could be an evolutionary pressure on seasonal influenza if vaccines reduce the transmission rates of some ("targeted") strains more than others. In theory, more vaccinated populations should have a lower prevalence of targeted strains compared to less vaccinated populations. We tested for vaccine-induced selection in influenza by comparing strain frequencies between more and less vaccinated human populations. We defined strains in three ways: first as influenza types and subtypes, next as lineages of type B, and finally as clades of influenza A/H3N2. We detected spatial differences partially consistent with vaccine use in the frequencies of subtypes and types and between the lineages of influenza B, suggesting that vaccines do not select strongly among all these phylogenetic groups at regional scales. We did detect a significantly greater frequency of an H3N2 clade with known vaccine escape mutations in more vaccinated countries during the 2014⁻2015 season, which is consistent with vaccine-driven selection within the H3N2 subtype. Overall, we find more support for vaccine-driven selection when large differences in vaccine effectiveness suggest a strong effect size. Variation in surveillance practices across countries could obscure signals of selection, especially when strain-specific differences in vaccine effectiveness are small. Further examination of the influenza vaccine's evolutionary effects would benefit from improvements in epidemiological surveillance and reporting.

Keywords: indirect effects; strain replacement; universal vaccines.


Conflict of interest statement

The authors declare no conflict of interest. The funding sponsors had no role in the design of the study; in the collection, analyses, or interpretation of data; in the writing of the manuscript, and in the decision to publish the results.

Figures

Figure A1
Figure A1
Seasonal vaccine effectiveness by type and subtype measured by test-negative design studies in Australia [24,25,26], Canada [27,28,29,30,31,32,33,34], Europe [35], and the United States [36,37,38,39,40,41,42,43] from the 2009–2010 season to the 2016–2017 season. European VEs include data from study sites in Germany, Spain, France, Croatia, Hungary, Ireland, Italy, the Netherlands, Poland, Portugal, Romania, and Sweden. Error bars show 95% CIs. VE in the United States measures effectiveness against medically attended ARI caused by influenza. Elsewhere, VE measures effectiveness against medically attended ILI caused by influenza. European studies enroll individuals over nine years old, while other studies also enroll individuals from younger age groups.
Figure A2
Figure A2
Seasonal VE by type and subtype averaged over time in Australia [24,25,26], Canada [27,28,29,30,31,32,33,34], Europe [35], and the United States [36,37,38,39,40,41,42,43] from the 2009–2010 to the 2016–2017 seasons. European VEs include data from study sites in Germany, Spain, France, Croatia, Hungary, Ireland, Italy, the Netherlands, Poland, Portugal, Romania, and Sweden. Numbers indicate the number of seasons used to calculate each mean. The specific seasons used to compute means are shown in Figure A1. Error bars show 95% CIs. Means and 95% CIs are calculated using arithmetic means of log odds ratios. (Equations (A7)–(A14)).
Figure A3
Figure A3
Seasonal vaccine coverage reported by national agencies [7,46,87,88,89]; vaccine coverage in China estimated from doses distributed as reported by the IFPMA IVS task force [90,91]. (A) vaccine coverage by country; (B) European vaccine coverage compared against United States vaccine coverage. The dashed line shows the total population size of countries reporting vaccine coverage divided by the total population of Europe in each season.
Figure A4
Figure A4
Seasonal influenza vaccination recommendations by age group in Europe [46] and the United States [47] during the 2007–2008 season and the 2014–2015 season.
Figure A5
Figure A5
Seasonal subtype frequencies in the United States and Europe. European frequencies are calculated as an average of country-level frequencies, weighted by population size.
Figure A6
Figure A6
Seasonal influenza intensity in the United States and Europe. European influenza intensity is calculated as a average of country-level influenza intensity, weighted by population size.
Figure A7
Figure A7
Country-level seasonal influenza-like illness (ILI) or acute respiratory illness (ARI) incidence are shown, as reported in the WHO FluID database [53]. ILI incidence as reported is shown for all countries except for France and Germany. Before the 2014–2015 season, ILI incidence in France is estimated from ARI incidence. ARI incidence is shown for Germany. Incidences are reported at weekly resolution. A fixed y-axis scale is shown in Figure A18.
Figure A8
Figure A8
The fraction of laboratory tested influenza positive respiratory samples from National Influenza Centers is shown at weekly resolution, as reported in the WHO FluNet database [52]. A fixed y-axis scale is shown in Figure A19.
Figure A9
Figure A9
Influenza intensity (ILI × fraction of influenza positive respiratory samples [57]) is shown by country at weekly resolution. For China, the influenza intensity is simply the fraction of influenza positive respiratory samples, since ILI (or any other measure of respiratory illness incidence) is not reported. A fixed y-axis scale is shown in Figure A20.
Figure A10
Figure A10
Seasonal counts of laboratory-tested respiratory samples identified by type and subtype, as reported in the WHO FluNet database are shown [52]. These data are used in the type and subtype-level analysis of vaccine-driven selection.
Figure A11
Figure A11
Simulated frequencies of two strains s1 and s2, circulating in populations A (with 20% vaccine coverage) and B with (40% vaccine coverage), calculated according to Equation (A23). Given the vaccine effectiveness against both strains, we calculated the fraction of strain 1 (out of strains 1 and 2) in (A) population A and (B) population B. The absolute difference in frequencies between regions is shown in (C), and the Cohen’s h effect size is shown in (D). These quantities are used to calculate statistical power in Figure A12.
Figure A12
Figure A12
Given differences in vaccine effectiveness against strain 1 and strain 2 (Figure A11), we estimate the sample sizes per population required to achieve 0.90 statistical power to detect the corresponding difference in strain frequencies between populations A (20% vaccine coverage) and B (40% vaccine coverage) at 0.05 significance, assuming equal distribution of sample sizes over time. Required sample sizes are divided into several ranges for visual clarity in (AD), and are shown on a log scale in (E). The required sample size to detect a difference in the proportion of strain 1 in population A versus population B (which is determined by the difference in VE against strain 1 and 2) is shown on a log scale in (F). Also in (F), the white space is outside the range of Equation (A23) when VE is between 0 and 1.
Figure A13
Figure A13
Country-level differences in subtype ratios of countries are not consistent with vaccine-driven selection, accounting for vaccine effectiveness. (A) the ratio of H3N2 to B among countries does not significantly correlate with the theoretical ratio (Pearson’s r=0.21,p=0.40); (B) similarly, the ratio of H3N2 to H1N1 among countries correlates significantly with the theoretical ratio (Pearson’s r=0.50,p=0.04). Theoretical ratios are calculated using Canadian VEs [27,28,29,30,31,32,33,34] for the Northern Hemisphere and Australian VEs for the Southern Hemisphere [24,25,26]. Error bars show 95% confidence intervals estimated using multinomial distributions of seasonal subtype frequencies. Red line shows expectation based on Equation (A23). The number of seasons contributing to each data point is shown in Figure A14.
Figure A14
Figure A14
Influenza intensity-weighted seasonal subtype and type frequencies prior to summation for use in country-level analysis (Figure A13 and Figure 3).
Figure A15
Figure A15
Seasonal counts of influenza B sequences contained in the GISAID database. Colors represent lineages that are matched or unmatched to the vaccine strain in the trivalent inactivated vaccine. These data are used in the influenza B lineage-level analysis of vaccine-driven selection.
Figure A16
Figure A16
Frequencies of H3N2 clades circulating during the 2014–2015 season, stratified by region. Error bars indicate 95% multinomial confidence intervals. Notably, 3c2.A strains are significantly more frequent in North America compared to Europe, and 3c3.B strains are significantly less frequent in North America compared to Europe.Frequencies of H3N2 clades circulating in the 2014-2015 season, stratified by region
Figure A17
Figure A17
Distributions of circulating H3N2 strains with given antigenic distances from the 2014–2015 vaccine strain (A/Texas/50/2012), stratified by region. Antigenic distances in (A) are calculated as Hamming distances between epitope sites, as defined in [60]. H3N2 strains in North America were more antigenically distant from the vaccine strain by epitope Hamming distance (9.2 units, 95% CI: 9.0–9.4) compared to Europe (10.0 units, 95% CI: 9.7–10.3). Antigenic distances in (B) are calculated using HI titers [56,59]. North American H3N2 strains are significantly less distant from the vaccine strain (1.17 units, 95% CI: 1.12–1.21) compared to Europe (1.34 units, 95% CI: 1.26–1.42).
Figure A18
Figure A18
As in Figure A7, but using a fixed y-axis scale for visualization.
Figure A19
Figure A19
As in Figure A8, but using a fixed y-axis scale for visualization.
Figure A20
Figure A20
As in Figure A9, but using a fixed y-axis scale for visualization.
Figure 1
Figure 1
Expected change in the ratios of strains for increasing vaccine coverage. Here, we consider H3N2, H1N1, and B as separate strains. Points show expected subtype ratios at approximate vaccine coverages in the United States and Europe (vertical lines). Dashed lines indicate direct comparisons between expected subtype ratios in the United States and Europe. Here, we assume that subtypes occur at equal frequencies without vaccination, and that VE over multiple seasons is the mean of VEs measured in each season. VE estimates are based on TND studies in Canada [27,28,29,30,31,32,33,34].
Figure 2
Figure 2
Comparing the ratios of (A) H3N2 to B and (B) H3N2 to H1N1 between the United States and Europe from the 2009–2010 to the 2016–2017 seasons. Subtype frequencies from the WHO FluNet database are calculated seasonally. The blue lines and points show the expected direction (but not magnitude) of the spatial difference in lineage ratios based on subtype-specific VEs. Ratios are calculated by first averaging seasonal subtype frequencies weighted by the intensity of influenza that season (Equation (4)). Error bars show 95% confidence intervals estimated using multinomial distributions of seasonal subtype frequencies. Unweighted seasonal frequencies are shown in Figure A5, and seasonal influenza intensities are shown in Figure A6.
Figure 3
Figure 3
Differences in countries’ subtype ratios are partially consistent with vaccine-driven selection. (A) the ratio of H3N2 to B among countries does not significantly correlate with the average seasonal vaccine coverage (Pearson’s r=0.24,p=0.33); (B) the ratio of H3N2 to H1N1 among countries significantly correlates with the average seasonal vaccine coverage (Pearson’s r=0.50,p=0.03). Subtype ratios are adjusted for seasonal influenza intensity (Equation (4)). Error bars show 95% confidence intervals estimated using multinomial distributions of seasonal subtype frequencies. Red lines show expectations based on Equation (A23), estimated using VE measured in Canada, and are identical to the trajectories shown in Figure 1. Dashed lines representing no effect of vaccination on subtype ratios are placed for visual reference. The number of seasons contributing to each data point is shown in Figure A14.
Figure 4
Figure 4
The ratios of vaccine-unmatched to matched B lineages differ marginally between the United States and Europe from the 2009–2010 to the 2012–2013 seasons (p=0.05). The blue line and points show the expectation of no spatial difference in lineage ratios under the assumption that VE does not differ between lineages. Error bars indicate 95% binomial confidence intervals. Unweighted seasonal lineage frequencies are shown in Figure A15.
Figure 5
Figure 5
Ratios of (A) 3c2.A to 3c3.B, (B) 3c2.A to ancestral (3c and 3c3) viruses, and (C) 3c3.B to ancestral viruses during the 2014–2015 season in the United States and Europe. The blue lines and points show the expected direction (but not magnitude) of the spatial difference in lineage ratios based on (A) clade-specific VEs or (B,C) antigenic differences between clades. Error bars indicate 95% multinomial confidence intervals. Complete clade frequencies are shown in Figure A16.

References

    1. Jefferson T., Rivetti A., Di Pietrantonj C., Demicheli V. Vaccines for preventing influenza in healthy children. Cochrane Database Syst. Rev. 2018;2:CD004879. - PMC - PubMed
    1. Demicheli V., Jefferson T., Ferroni E., Rivetti A., Di Pietrantonj C. Vaccines for preventing influenza in healthy adults. Cochrane Database Syst. Rev. 2018;2:CD001269. - PMC - PubMed
    1. Hurwitz E.S., Haber M., Chang A., Shope T., Teo S., Ginsberg M., Waecker N., Cox N.J. Effectiveness of influenza vaccination of day care children in reducing influenza-related morbidity among household contacts. JAMA. 2000;284:1677–1682. doi: 10.1001/jama.284.13.1677. - DOI - PubMed
    1. Principi N., Esposito S., Marchisio P., Gasparini R., Crovari P. Socioeconomic impact of influenza on healthy children and their families. Pediatr. Infec. Dis. J. 2003;22:S207–S210. doi: 10.1097/01.inf.0000092188.48726.e4. - DOI - PubMed
    1. Loeb M., Russell M.L., Moss L., Fonseca K., Fox J., Earn D.J.D., Aoki F., Horsman G., Van Caeseele P., Chokani K., et al. Effect of influenza vaccination of children on infection rates in Hutterite communities: A randomized trial. JAMA. 2010;303:943–950. doi: 10.1001/jama.2010.250. - DOI - PubMed

Publication types

Substances

LinkOut - more resources