. 2018 Sep 19;18(1):202.
doi: 10.1186/s12870-018-1417-z.

Exploring transcription factors reveals crucial members and regulatory networks involved in different abiotic stresses in Brassica napus L

Affiliations

Exploring transcription factors reveals crucial members and regulatory networks involved in different abiotic stresses in Brassica napus L

Pei Wang et al. BMC Plant Biol. .

Abstract

Background: Brassica napus (B. napus) encompasses diverse transcription factors (TFs), but thorough identification and characterization of TF families, as well as their transcriptional responsiveness to multifarious stresses are still not clear.

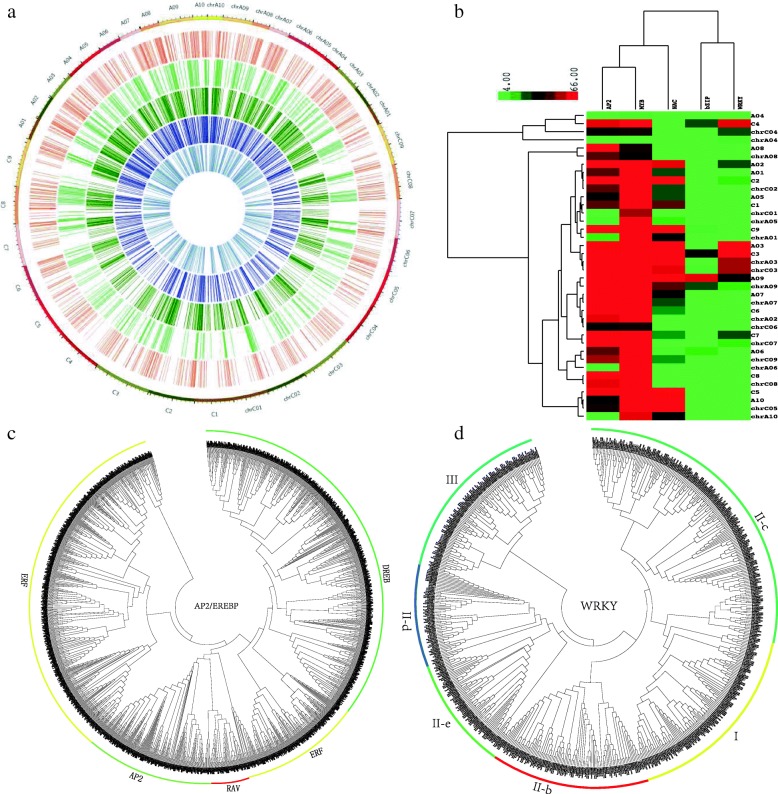
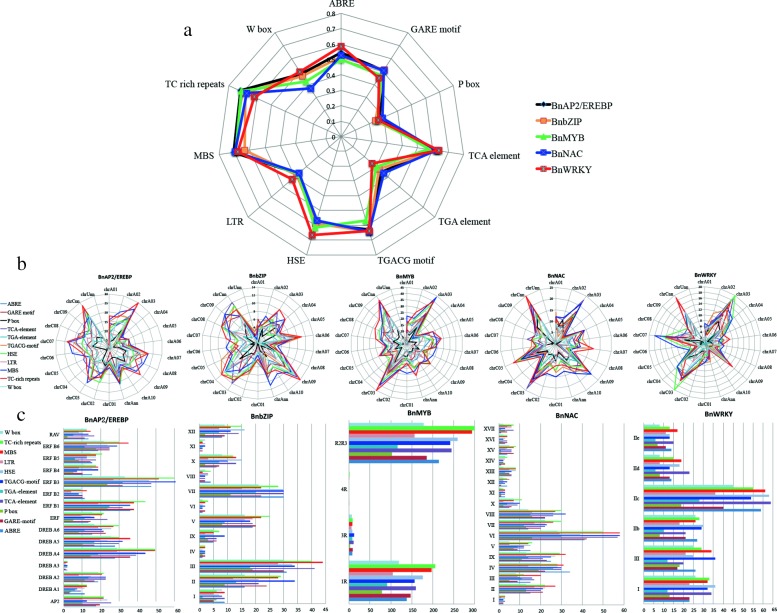
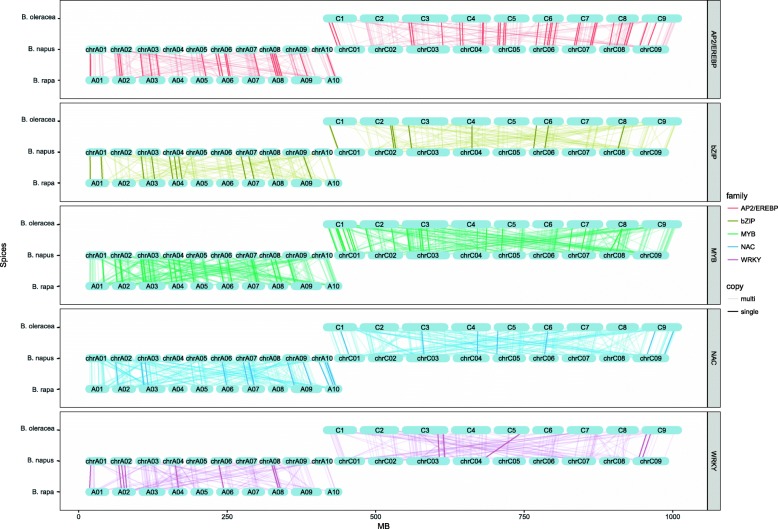
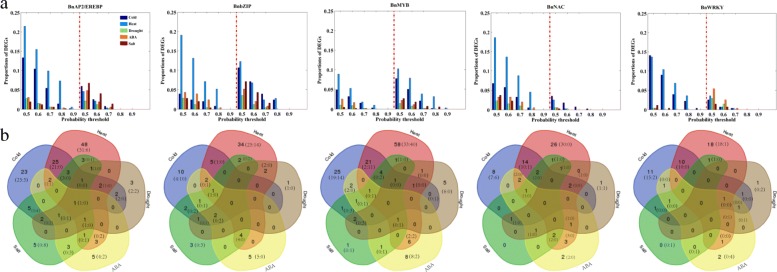
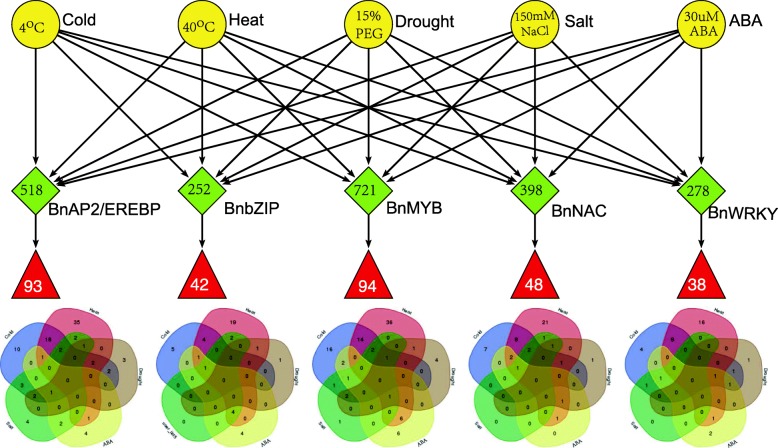
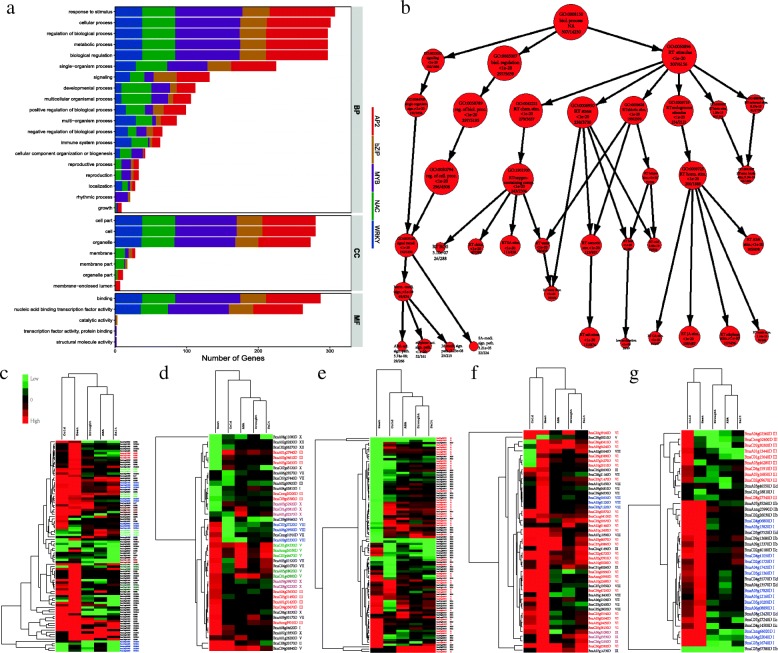
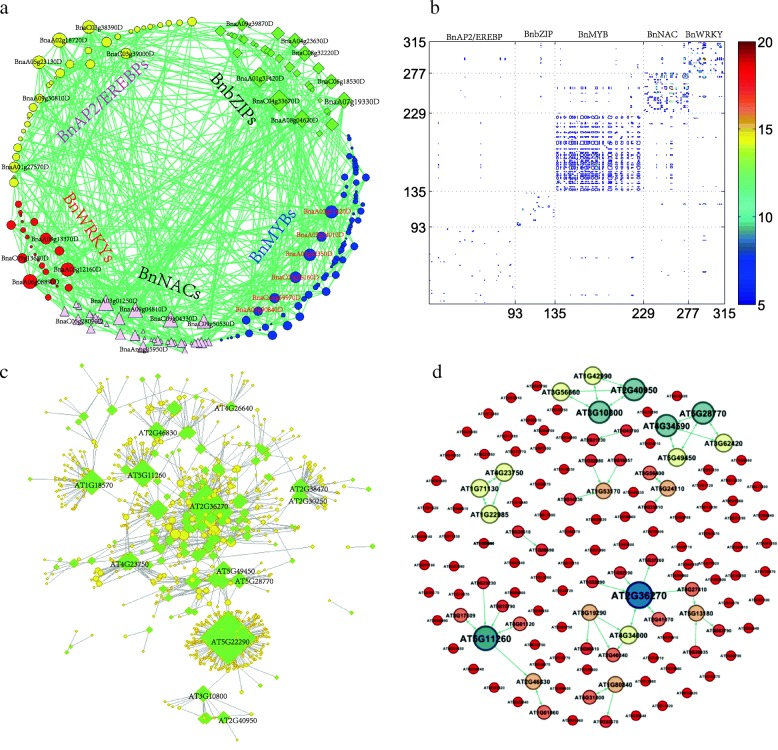
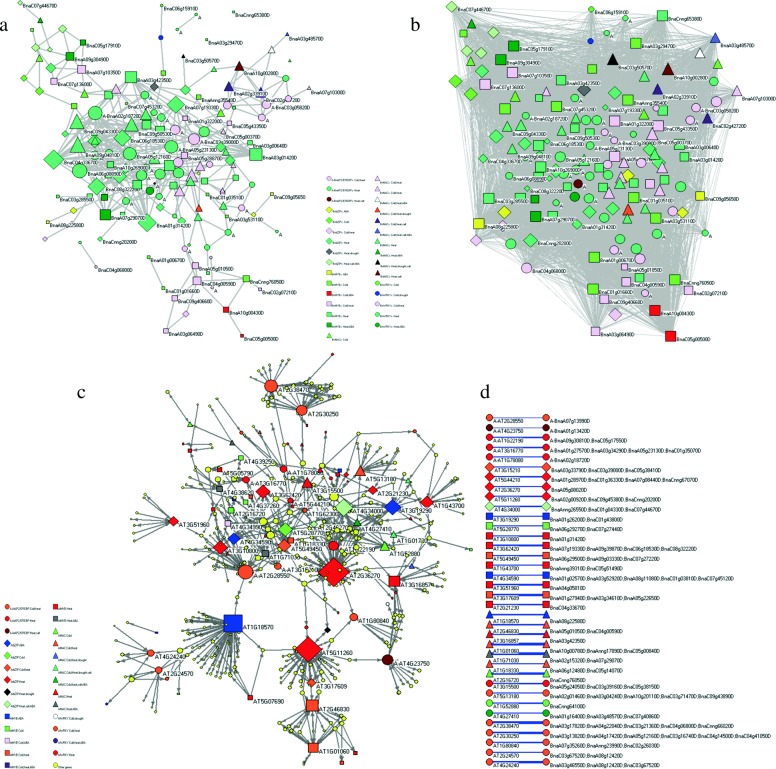
Results: Totally 2167 TFs belonging to five families were genome-widely identified in B. napus, including 518 BnAP2/EREBPs, 252 BnbZIPs, 721 BnMYBs, 398 BnNACs and 278 BnWRKYs, which contained some novel members in comparison with existing results. Sub-genome distributions of BnAP2/EREBPs and BnMYBs indicated that the two families might have suffered from duplication and divergence during evolution. Synteny analysis revealed strong co-linearity between B. napus and its two ancestors, although chromosomal rearrangements have occurred and 85 TFs were lost. About 7.6% and 9.4% TFs of the five families in B. napus were novel genes and conserved genes, which both showed preference on the C sub-genome. RNA-Seq revealed that more than 80% TFs were abiotic stress inducible and 315 crucial differentially expressed genes (DEGs) were screened out. Network analysis revealed that the 315 DEGs are highly co-expressed. The homologous gene network in A. thaliana revealed that a considerable amount of TFs could trigger the differential expression of targeted genes, resulting in a complex clustered network with clusters of genes responsible for targeted stress responsiveness.

Conclusions: We identified and characterized five TF families in B. napus. Some crucial members and regulatory networks involved in different abiotic stresses have been explored. The investigations deepen our understanding of TFs for stress tolerance in B. napus.

Keywords: Abiotic stress; Brassica napus; Gene regulatory network; RNA-Seq; Transcription factor.


Conflict of interest statement

Ethics approval and consent to participate

The plant material Zhongshuang 11 was provided by the Oil Crops Research Institute (OCRI), Chinese Academy of Agricultural Sciences (CAAS), which is a popularized planting varieties in large area and can be freely used for research purpose.

Consent for publication

Not applicable.

Competing interests

The authors declare that they have no competing interests.

Publisher’s Note

Springer Nature remains neutral with regard to jurisdictional claims in published maps and institutional affiliations.

Figures

Fig. 1
Fig. 1
Chromosome distributions and phylogenetic trees of TF families. a Circos plot of the five TF families in B. rapa (A01-A10) and B. oleracea (C1-C9) and B. napus (ChrA01-ChrA10, ChrC01-ChrC09). From outside to inside of the circos plot, we show the three genomes, AP2/EREBPs, bZIPs, MYBs, NACs and WRKYs respectively. b Hierarchical clustering analysis for numbers of TFs that are anchored to chromosomes of the three species. Correlation coefficient and the average linkage method are used to evaluate the closeness among samples and clusters. c The unrooted phylogenetic tree for BnAP2/EREBPs in B. napus in comparison to those in A. thaliana, B. rapa and B. oleracea. d The unrooted phylogenetic tree for WRKYs
Fig. 2
Fig. 2
Statistical analysis for cis-elements of TFs in B. napus. a Proportions of genes with various cis-elements for each family. b Chromosome distributions. c Subfamily distributions
Fig. 3
Fig. 3
Synteny maps show orthologous relationships between TFs in B. napus, B. rapa and B. oleracea. Genes in the three species are plotted against their predicted linked counterparts
Fig. 4
Fig. 4
Statistical analysis of DEGs in B. napus. a Proportions of DEGs under various probability thresholds for each family under each treatment. In each panel, the left half shows the case for up-regulated DEGs, while the right half is for down-regulated ones. b Venn diagrams for DEGs under the five treatments with cut-off probability 0.6. Numbers in brackets show the corresponding numbers of DEGs in Venn diagrams for up/down regulated DEGs
Fig. 5
Fig. 5
Identification of crucial DEGs and the corresponding Venn diagrams. Based on RNA-Seq data under five treatments and GO annotations, 315 crucial DEGs are screened out. The Venn diagrams show the numbers of responsive crucial DEGs under the five treatments
Fig. 6
Fig. 6
GO enrichment analysis and heat maps of relative expression profiles for the identified 315 DEGs. a GO involvement analysis for the identified 315 crucial TFs. BP: biological process; MF: molecular function; CC: cellular component. b Part of GO tree of biological processes for the 315 DEGs. Size of nodes is proportional to the numbers of genes. cg Cluster analysis and heat maps of relative expression profiles for the identified DEGs. Kendall’s τ correlation coefficient is used for arrays to evaluate the similarity among different treatments, Euclidean distance is used to evaluate the closeness between genes, and the average linkage method is used in cluster analysis. DEGs from the same subfamilies are marked with the same colors in each family
Fig. 7
Fig. 7
Network analysis on the 315 crucial DEGs in B. napus. a Gene co-expression network with 1003 directed edges. Two genes with gray correlation coefficient higher than 0.94 are treated with co-expressed. b Heat-maps for the process-gene network. Color bars represents the number of shared GO process terms between two DEGs. c Gene regulatory network constructed from BioGRID for homologous genes in A. thaliana. The network consists of 789 genes and 1253 directed edges. The 315 crucial B. napus genes have 133 homologous A. thaliana genes, which are shown in green diamond, while other genes are shown in yellow circles. d The regulation relationships among the 133 genes in A. thaliana, which contains 61 directed edges
Fig. 8
Fig. 8
Subnetworks for common DEGs in co-expression, process-gene and homologous networks. a Co-expression subnetwork of the 153 DEGs that have common edges in the co-expression and process-gene networks, which has 350 undirected edges. b Process-gene subnetwork of the 153 DEGs with 7606 undirected edges. c Homologous gene network in A. thaliana that consists of 466 nodes and 720 directed edges. 86 of the 466 genes are homologous with the 153 common DEGs in (a) and (b). d Homologous relationships among the top-36 highly connected genes in (c) between A. thaliana and B. napus. Different shapes of nodes denote genes from different families; Different colors corresponding to different kinds of stress responsiveness. To distinguish between WRKYs and AP2/EREBPs, nodes with prefix “A” correspond to AP2/EREBPs
Fig. 9
Fig. 9
qRT-PCR validations on a few of the 315 DEGs under the five treatments. Eight DEGs under each treatment are selected for further qRT-PCR validation. RNA-Seq: the relative expression level in the RNA-Seq data; qRT-PCR: the relative expression level in the qRT-PCR experiment. If the two data have the same trend, then it indicates the reproducibility of the results

References

    1. Wang X, Wang H, Wang J, et al. The genome of the mesopolyploid crop species Brassica rapa. Nat Genet. 2011;43:1035–9. doi: 10.1038/ng.919. - DOI - PubMed
    1. Liu S, Liu Y, Yong C, et al. The Brassica oleracea genome reveals the asymmetrical evolution of polyploid genomes. Nat Commun. 2014;5:3930. doi: 10.1038/ncomms4930. - DOI - PMC - PubMed
    1. Chalhoub B, Denoeud F, Liu S, et al. Early allopolyploid evolution in the post-neolithic Brassica napus oilseed genome. Science. 2014;345:950–3. doi: 10.1126/science.1253435. - DOI - PubMed
    1. Yang J, Liu D, Wang X, et al. The genome sequence of allopolyploid Brassica juncea and analysis of differential homoeolog gene expression influencing selection. Nat Genet. 2016;48:1225–32. doi: 10.1038/ng.3657. - DOI - PubMed
    1. Riechmann JL, Meyerowitz EM. The AP2/EREBP family of plant transcription factors. Biol Chem. 1998;379:633–46. - PubMed