Related factors of quality of life of type 2 diabetes patients: a systematic review and meta-analysis
- PMID: 30231882
- PMCID: PMC6147036
- DOI: 10.1186/s12955-018-1021-9
Related factors of quality of life of type 2 diabetes patients: a systematic review and meta-analysis
Abstract
Background: Diabetes is a chronic disease, and it could affect both health and quality of life (QOL). A lot of studies have reported some predictors of QOL of type 2 diabetes patients. While their results were not completely consistent. So the aim of our study was finding out the related factors (including characteristics related to the disease, life styles and mental health factors) of QOL of type 2 diabetes patients.
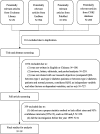
Methods: We searched Cochrane library, EmBase, PubMed and CNKI databases for published studies that evaluated the related factors of QOL of type 2 diabetes patients by using a proper statistic method and had effect sizes (OR or β) and 95% confidence intervals from January 1st 2000 to May 31st 2016. Any study types were acceptable, and we excluded the reviews, letters, editorials and pooled analyses. The data were analyzed using STATA software (Version 12.0; Stata Corporation). Effect sizes and 95% confidence intervals were calculated to evaluate the relationship between these factors and QOL.
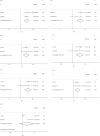
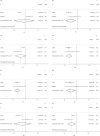
Results: Eighteen studies were included into our systematic review and meta-analysis, totaling 57,109 type 2 diabetes patients. Do more physical exercises (The pooled ORs ranged from 0.635 to 0.825 for different scales, less than 1.00), glucose check more frequently [pooled OR (95%CI): 0.175 (0.041, 0.756)] were associated with a better QOL. Presence of complications (The pooled ORs ranged from 1.462 to 3.038 for different scales, more than 1.00), presence of hypertension [pooled OR (95%CI): 1.389 (1.173, 1644)], longer duration of diabetes [pooled OR (95%CI): 1.865 (1.088, 3.197)], diet with more red meat [pooled OR (95%CI): 2.085 (1.063, 4.089)] and depression (The pooled ORs ranged from 3.003 to 11.473 for different scales, higher than 1.00) were associated with a worse QOL.
Conclusion: The results of this study show that physical exercise, glucose check frequently, complications, hypertension, duration of diabetes, diet with more red meat, and depression were associated with the QOL of type 2 diabetes patients.
Keywords: Meta-analysis; Quality of life; Related factors; Type 2 diabetes.
Conflict of interest statement
Ethics approval and consent to participate
Not applicable.
Consent for publication
Not applicable.
Competing interests
The authors declare that they have no competing interests.
Publisher’s Note
Springer Nature remains neutral with regard to jurisdictional claims in published maps and institutional affiliations.
Figures


Similar articles
-
E-Health interventions for anxiety and depression in children and adolescents with long-term physical conditions.Cochrane Database Syst Rev. 2018 Aug 15;8(8):CD012489. doi: 10.1002/14651858.CD012489.pub2. Cochrane Database Syst Rev. 2018. PMID: 30110718 Free PMC article.
-
Inhaled mannitol for cystic fibrosis.Cochrane Database Syst Rev. 2018 Feb 9;2(2):CD008649. doi: 10.1002/14651858.CD008649.pub3. Cochrane Database Syst Rev. 2018. Update in: Cochrane Database Syst Rev. 2020 May 1;5:CD008649. doi: 10.1002/14651858.CD008649.pub4. PMID: 29424930 Free PMC article. Updated.
-
Eliciting adverse effects data from participants in clinical trials.Cochrane Database Syst Rev. 2018 Jan 16;1(1):MR000039. doi: 10.1002/14651858.MR000039.pub2. Cochrane Database Syst Rev. 2018. PMID: 29372930 Free PMC article.
-
Reminiscence therapy for dementia.Cochrane Database Syst Rev. 2018 Mar 1;3(3):CD001120. doi: 10.1002/14651858.CD001120.pub3. Cochrane Database Syst Rev. 2018. PMID: 29493789 Free PMC article.
-
Lamotrigine versus carbamazepine monotherapy for epilepsy: an individual participant data review.Cochrane Database Syst Rev. 2018 Jun 28;6(6):CD001031. doi: 10.1002/14651858.CD001031.pub4. Cochrane Database Syst Rev. 2018. PMID: 29952431 Free PMC article.
Cited by
-
Self-Reported Satisfaction to Treatment, Quality of Life and General Health of Type 2 Diabetes Patients with Inadequate Glycemic Control from North-Eastern Romania.Int J Environ Res Public Health. 2021 Mar 21;18(6):3249. doi: 10.3390/ijerph18063249. Int J Environ Res Public Health. 2021. PMID: 33801100 Free PMC article.
-
Stigma perception and determinants among patients with type 2 diabetes mellitus in Iraq.J Egypt Public Health Assoc. 2023 Nov 29;98(1):20. doi: 10.1186/s42506-023-00145-5. J Egypt Public Health Assoc. 2023. PMID: 38017311 Free PMC article.
-
Estimation of the onset time of diabetic complications in type 2 diabetes patients in Thailand: a survival analysis.Osong Public Health Res Perspect. 2023 Dec;14(6):508-519. doi: 10.24171/j.phrp.2023.0084. Epub 2023 Nov 23. Osong Public Health Res Perspect. 2023. PMID: 38204429 Free PMC article.
-
Health-related quality of life and associated factors among patients with type II diabetes mellitus: A study in the family medicine center (FMC) of Agricultural General Hospital in Hanoi, Vietnam.Health Psychol Open. 2021 Feb 23;8(1):2055102921996172. doi: 10.1177/2055102921996172. eCollection 2021 Jan-Jun. Health Psychol Open. 2021. PMID: 33747536 Free PMC article.
-
The influence of hypoglycemia on the specific quality of life in type 2 diabetes mellitus: a comparative cross-sectional study of diabetics with and without hypoglycemia in Xi'an, China.Health Qual Life Outcomes. 2021 May 19;19(1):151. doi: 10.1186/s12955-021-01790-0. Health Qual Life Outcomes. 2021. PMID: 34011369 Free PMC article.
References
-
- World Health Organization. 10 facts on diabetes [EB/OL]. Available at: http://www.who.int/features/factfiles/diabetes/en/ April 2016.
-
- Wong CK, Lo YY, Wong WH, Fung CS. The associations of body mass index with physical and mental aspects of health-related quality of life in Chinese patients with type 2 diabetes mellitus: results from a cross-sectional survey. Health Qual Life Outcomes. 2013;11:142. doi: 10.1186/1477-7525-11-142. - DOI - PMC - PubMed
Publication types
MeSH terms
LinkOut - more resources
Full Text Sources
Other Literature Sources
Medical

