. 2018 Sep 18;49(3):504-514.e4.
doi: 10.1016/j.immuni.2018.08.018.

The Adaptor Protein CARD9 Protects against Colon Cancer by Restricting Mycobiota-Mediated Expansion of Myeloid-Derived Suppressor Cells

Affiliations

The Adaptor Protein CARD9 Protects against Colon Cancer by Restricting Mycobiota-Mediated Expansion of Myeloid-Derived Suppressor Cells

Tingting Wang et al. Immunity. .

Abstract

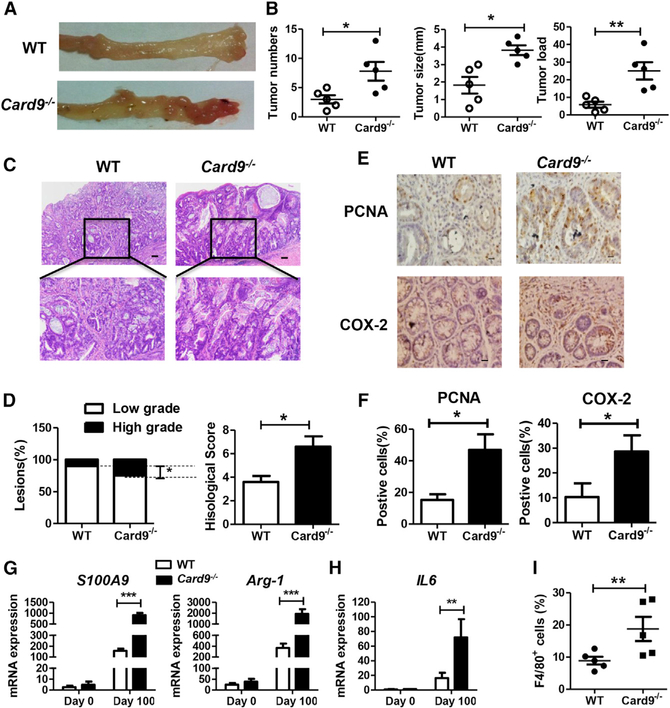
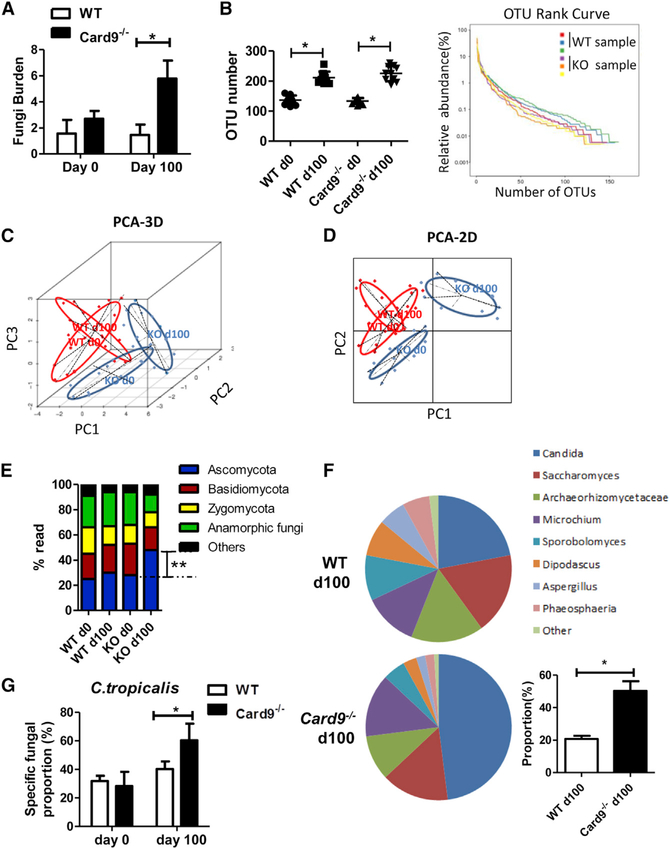
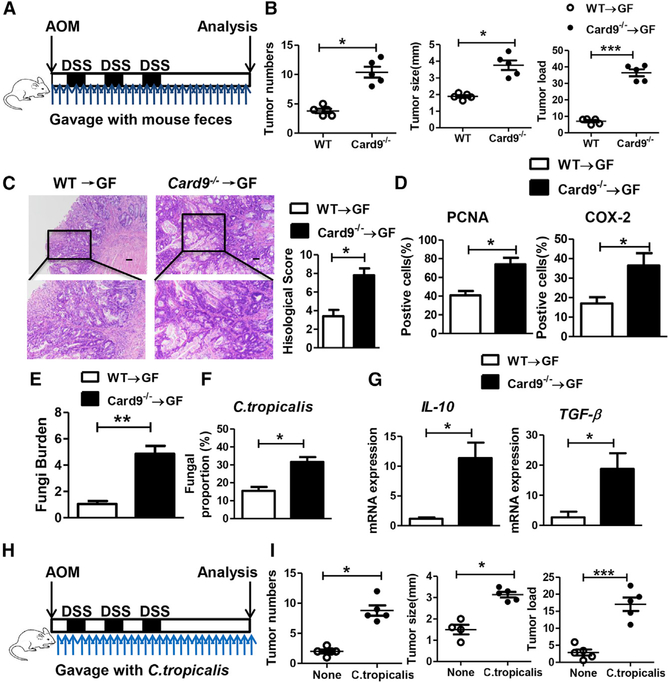
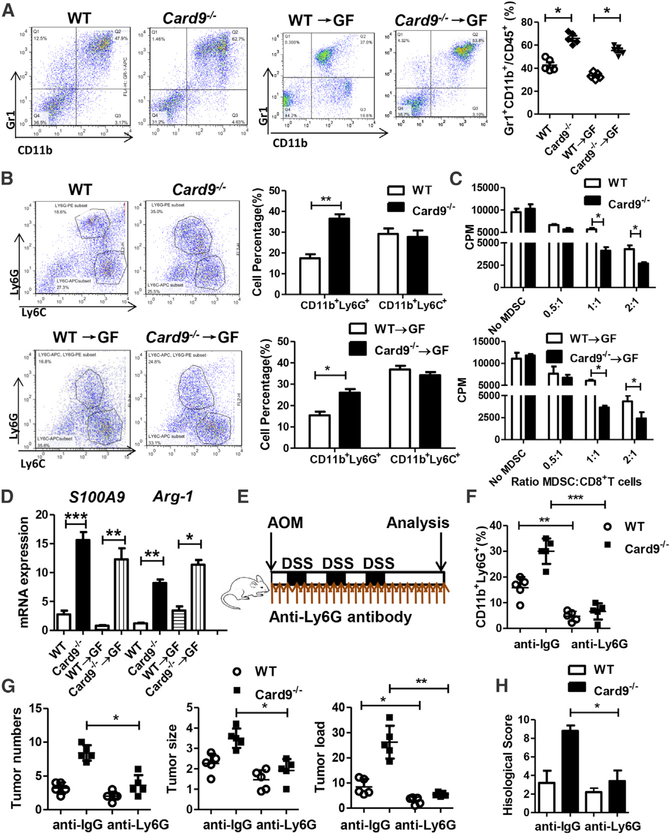
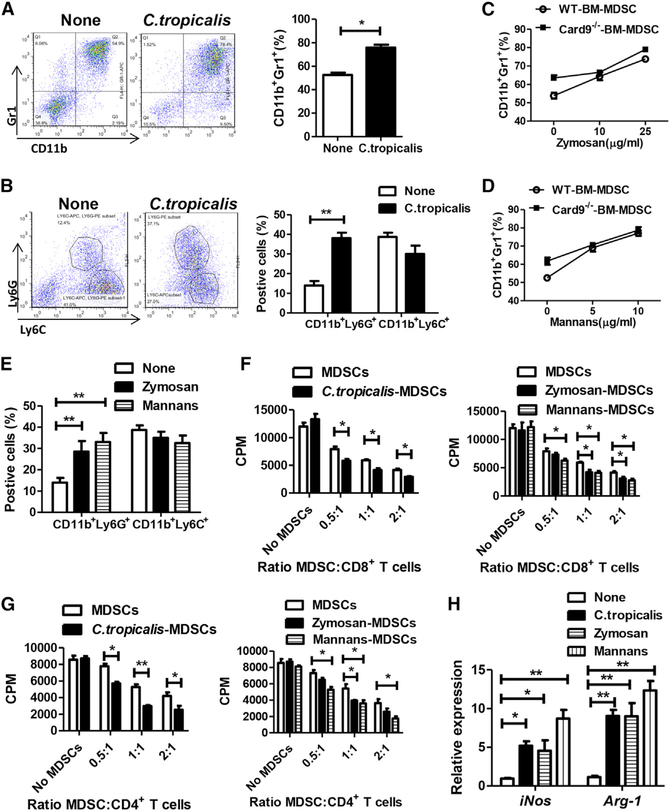
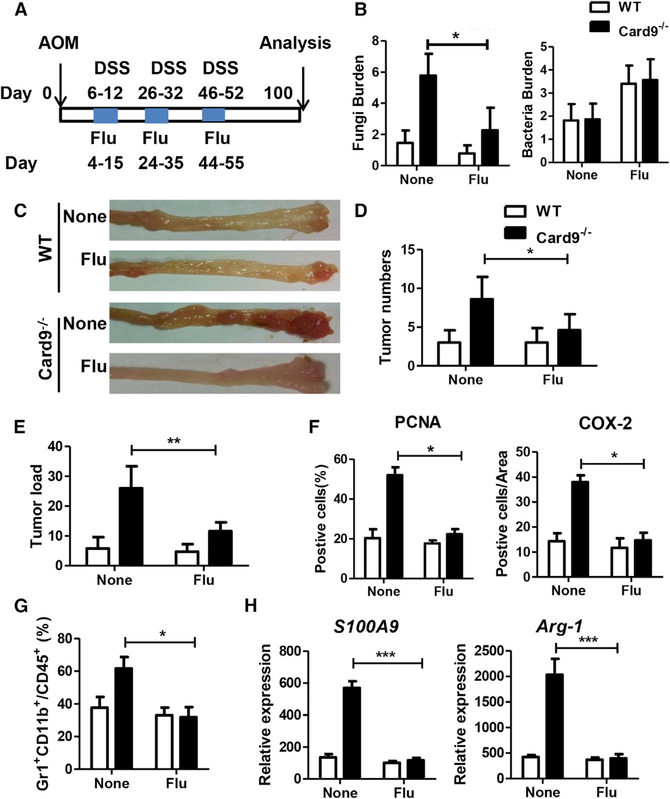
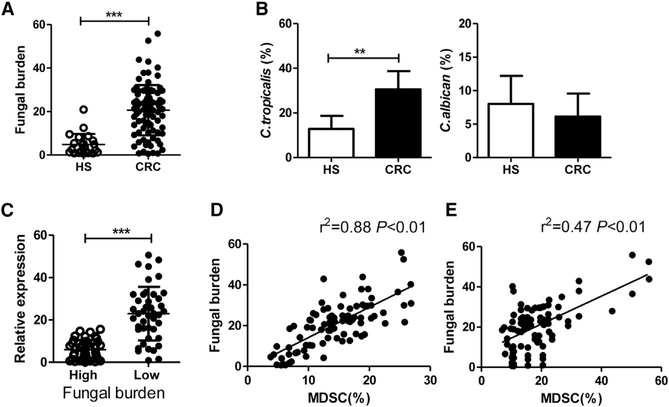
The adaptor protein CARD9 links detection of fungi by surface receptors to the activation of the NF-κB pathway. Mice deficient in CARD9 exhibit dysbiosis and are more susceptible to colitis. Here we examined the impact of Card9 deficiency in the development of colitis-associated colon cancer (CAC). Treatment of Card9-/- mice with AOM-DSS resulted in increased tumor loads as compared to WT mice and in the accumulation of myeloid-derived suppressor cells (MDSCs) in tumor tissue. The impaired fungicidal functions of Card9-/- macrophages led to increased fungal loads and variation in the overall composition of the intestinal mycobiota, with a notable increase in C. tropicalis. Bone marrow cells incubated with C. tropicalis exhibited MDSC features and suppressive functions. Fluconazole treatment suppressed CAC in Card9-/- mice and was associated with decreased MDSC accumulation. The frequency of MDSCs in tumor tissues of colon cancer patients correlated positively with fungal burden, pointing to the relevance of this regulatory axis in human disease.

Keywords: Card9; MDSCs; colon cancer; mycobiota.


Conflict of interest statement

DECLARATION OF INTERESTS

The authors declare no competing interests.

Figures

Figure 1.
Figure 1.. Card9−/− Mice Have Increased Tumor Burden upon AOM-DSS Treatment than WT Mice
WT mice and Card9−/− mice (n = 5 for each group) were separated at least 4 weeks before use and throughout the experiments. To develop CAC model, mice were injected intraperitoneally with one dose of AOM (10 mg/kg), followed by three cycles of feeding water with 2% DSS. After induction of tumorigenesis, mice were euthanized on day 100 and colons were removed from each mouse. (A) Representative images of colon tumors were shown. (B) Tumor number, tumor size, and tumor load in each mouse was measured. (C and D) Histological analysis of colon tumors was shown by hematoxylin and eosin (HE) staining. Tumors were microscopically analyzed and classified as low or high grade. Histological score was assessed by a pathologist. (E and F) Tumor tissues were stained for PCNA and COX-2. The percentages of PCNA-positive and COX-2-positive tumor cells were quantified. (G) mRNA expressions of S100A9 and Arg-1 in LP cells from AOM-DSS-treated or untreated mice were detected using qPCR. (H) mRNA expressions of IL-6 in LP cells from AOM-DSS-treated or untreated mice were detected using qPCR. (I) Proportion of F4/80+ cells in colonic LP cells from tumor-bearing WT and Card9−/−mice was determined by flow cytometry. Data with error bars are represented as mean ± SD. Each panel is a representative experiment of at least three independent biological replicates. Scale bars, 50 mm. *p < 0.05, **p < 0.01, ***p < 0.001 as determined by unpaired Student’s t test. See also Figures S1–S3.
Figure 2.
Figure 2.. The Intestinal Microbiota Is Altered in Tumor-Bearing Card9−/− Mice
Mice were treated as described in Figure 1 (n = 5 for each group). After induction of tumorigenesis (100 days), mice were euthanized and feces were collected from WT and Card9−/− mice. (A) Total fungal burden in the feces of AOM-DSS-treated or untreated mice was quantified using 18S rDNA qPCR. (B) Fungal ITS2 rDNA gene sequence was performed in each group. Fungal diversity in the feces of treated or untreated mice was determined by operational taxonomic unit (OTU) number and the rank curve. (C) Three-dimensional (3D) principal component analysis (PCA) based on fungal ITS2 rDNA gene sequence abundance in the feces. x axis, principal components 1 (PC1); y axis, principal components 2 (PC2); z axis, principal components 3 (PC3); d, days. (D) Two-dimensional (2D) principal component analysis (PCA) based on fungal ITS2 rDNA gene sequence abundance in the feces. x axis, principal components 1 (PC1); y axis, principal components 2 (PC2); d, days. (E) Fungal-taxon-based analysis at the phylum level in feces of AOM-DSS-treated or untreated mice. (F) Fungal-taxon-based analysis at the specie level in feces of tumor-bearing WT and Card9−/−mice. (G) Proportion of C. tropicalis in feces of AOM-DSS-treated or untreated mice were quantified using qPCR. Data with error bars are represented as mean ± SD. Each panel is a representative experiment of at least three biological replicates. *p < 0.05, **p < 0.01 as determined by unpaired Student’s t test. See also Figure S4.
Figure 3.
Figure 3.. Microbiota from the Tumor-Bearing Card9−/− Mouse Promotes CAC
(A) GF mice were oral transferred with feces (400 μL each time, twice a week) from tumor-bearing WT and Card9−/− mice during administrated with AOM-DSS (n = 5, each group). After induction of tumorigenesis (100 days), mice were euthanized and colons were removed. (B) Tumor number, tumor size, and tumor load in colons were measured. (C) Histological colon tumor images using H&E staining. Histological score was assessed by a pathologist. (D) Tumor tissues were stained for PCNA and COX-2. The percentages of PCNA-positive and COX-2-positive tumor cells were quantified. (E) Feces were collected from mice on day 100. Total fungal burden in feces were quantified using 18S rDNA qPCR. (F) Proportions of C. tropicalis in the feces were quantified using qPCR. (G) mRNA expressions of IL-10 and TGF-β in LP cells were detected using qPCR. (H) GF mice were orally gavaged with C. tropicalis (twice a week, 1 × 10⁷) during administration with AOM-DSS (n = 5, each group). After induction of tumorigenesis (100 days), mice were euthanized. (I) Tumor number, tumor size, and tumor load in colons were measured. Data with error bars are represented as mean ± SD. Each panel is a representative experiment of at least three independent biological replicates. Scale bars, 50 mm. *p < 0.05, **p < 0.01, ***p < 0.001 as determined by unpaired Student’s t test. See also Figures S5 and S6.
Figure 4.
Figure 4.. MDSCs Are Accumulated and Activated in Card9−/− Mice
(A) Mice were treated as described in Figures 1A and 3A. Colon tissues were acquired on day 100 and LP cells were isolated. The proportions of MDSCs (Gr1+CD11b+) were determined by flow cytometry. (B) The proportions of M-MDSCs (CD11b+Ly6C+) and G-MDSCs (CD11b+Ly6G+) were determined by flow cytometry. (C) Primary MDSCs were isolated from LP cells in tumor-bearing WT and Card9−/− mice or tumor-bearing GF mice. Primary MDSCs were co-cultured with CD8+ T cells. The suppressive function of MDSCs was determined by [3H] thymidine incorporation. (D) The mRNA expression of S100A9 and Arg-1 in LP cells of tumor-bearing WT and Card9−/− mice or tumor-bearing GF mice were detected by qPCR. (E) WT and Card9−/− mice were intraperitoneally treated with anti-Ly6G antibody (200 μg, once every 4 days) or anti-IgG antibody as control during AOM-DSS administration (n = 5 each group). Colon tissues were acquired on day 100 and LP cells were isolated. (F) The proportions of G-MDSCs (CD11b+Ly6G+) in LP cells were determined by flow cytometry. (G) Tumor number, tumor size, and tumor load in colons were measured in mice after anti-Ly6G or anti-IgG treatment. (H) Histological score was assessed by a pathologist. Data with error bars are represented as mean ± SD. Each panel is a representative experiment of at least three independent biological replicates. *p < 0.05, **p < 0.01, ***p < 0.001 as determined by unpaired Student’s t test. See also Figure S7.
Figure 5.
Figure 5.. C. tropicalis Induces MDSC Differentiation and Activates MDSC Function
(A and B) Bone marrow cells from WT mice were stimulated with C. tropicalis (5 × 10⁶) for 6 days. The proportions of MDSCs (Gr1+CD11b+), M-MDSCs (CD11b+Ly6C+), and G-MDSCs (CD11b+Ly6G+) were determined by flow cytometry. (C–E) Bone marrow cells from WT mice and Card9−/− mice were stimulated with zymosan and mannans for 6 days. The proportions of MDSCs (Gr1+CD11b+), M-MDSCs (CD11b+Ly6C+), and G-MDSCs (CD11b+Ly6G+) were determined by flow cytometry. (F and G) Bone marrow cells from WT mice were stimulated with C. tropicalis (5 × 10⁶), zymosan, or mannans for 6 days and were co-cultured with CD8+ T or CD4+ T cells. The suppressive function of MDSCs was determined by [3H] thymidine incorporation. (H) Bone marrow cells from WT mice were stimulated with C. tropicalis (5 × 10⁶), zymosan, or mannans for 6 days. mRNA expressions of iNOS and Arg-1 in cells were detected using qPCR. Data with error bars are represented as mean ± SD. Each panel is a representative experiment of at least three independent biological replicates. *p < 0.05, **p < 0.01 as determined by unpaired Student’s t test.
Figure 6.
Figure 6.. Anti-fungal Therapy Ameliorates CAC in Card9−/− Mice
(A) WT mice and Card9−/− mice (n = 5 for each group) were separated at least 4 weeks before use and throughout the experiments. WT and Card9−/− mice were given three cycles of fluconazole (0.5 mg/mL) during AOM-DSS treatment. After induction of tumorigenesis (100 days), mice were euthanized and feces were collected. (B) Total fungal burden and bacterial burden in feces of tumor-bearing WT and Card9−/− mice was quantified by using qPCR. (C) Representative images of colon tumors. (D and E) Tumor number and tumor load in each group were measured. (F) Tumor tissues were stained for PCNA and COX-2. The percentages of PCNA-positive and COX-2-positive tumor cells were quantified. (G) Proportion of MDSCs (Gr1+CD11b+) in colonic LP cells was calculated by flow cytometry. (H) mRNA expression of S100A9 and Arg-1 in colonic LP cells was detected using qPCR. Data with error bars are represented as mean ± SD. Each panel is a representative experiment of at least three independent biological replicates. *p < 0.05, **p < 0.01, ***p < 0.001 as determined by unpaired Student’s t test.
Figure 7.
Figure 7.. Fungal Burden Is Correlated with MDSC Proportion in Patients with Colon Cancer
(A) Feces were collected from CRC patients (n = 87) and healthy subjects (n = 22). Total fungal burden in feces of was quantified using 18S rDNA qPCR. (B) Proportion of C. tropicalis and C. albicans in human feces was determined by qPCR. (C) Patients were divided into two groups based on fungal burden level. The mRNA expressions of CARD9 in colon tumor tissues were detected by qPCR. (D) Correlation between fungal burden and proportion of MDSCs (CD11b+CD14CD33+ cells) in colon tissues of patients with colon cancers. (E) Correlation between fungal burden and proportion of MDSCs (CD11b+CD14CD33+ cells) in PBMCs of patients with colon cancers. Data with error bars are represented as mean ± SD. Each panel is a representative experiment of at least three independent repeats. **p < 0.01, ***p < 0.001 as determined by unpaired Student’s t test. Correlation significance was determined by using linear regression.

Comment in

References

    1. Arnold M, Sierra MS, Laversanne M, Soerjomataram I, Jemal A, and Bray F (2017). Global patterns and trends in colorectal cancer incidence and mortality. Gut 66, 683–691. - PubMed
    1. Arora M, Poe SL, Oriss TB, Krishnamoorthy N, Yarlagadda M, Wenzel SE, Billiar TR, Ray A, and Ray P (2010). TLR4/MyD88-induced CD11b+Gr-1 int F4/80+ non-migratory myeloid cells suppress Th2 effector function in the lung. Mucosal Immunol. 3, 578–593. - PMC - PubMed
    1. Arthur JC, Perez-Chanona E, Mühlbauer M, Tomkovich S, Uronis JM, Fan TJ, Campbell BJ, Abujamel T, Dogan B, Rogers AB, et al. (2012). Intestinal inflammation targets cancer-inducing activity of the microbiota. Science 338, 120–123. - PMC - PubMed
    1. Arthur JC, Gharaibeh RZ, Mühlbauer M, Perez-Chanona E, Uronis JM, McCafferty J, Fodor AA, and Jobin C (2014). Microbial genomic analysis reveals the essential role of inflammation in bacteria-induced colorectal cancer. Nat. Commun 5, 4724. - PMC - PubMed
    1. Bäumler AJ, and Sperandio V (2016). Interactions between the microbiota and pathogenic bacteria in the gut. Nature 535, 85–93. - PMC - PubMed

Publication types

MeSH terms