. 2018 Sep 18;49(3):515-530.e5.
doi: 10.1016/j.immuni.2018.08.024.

SYK-CARD9 Signaling Axis Promotes Gut Fungi-Mediated Inflammasome Activation to Restrict Colitis and Colon Cancer

Affiliations

SYK-CARD9 Signaling Axis Promotes Gut Fungi-Mediated Inflammasome Activation to Restrict Colitis and Colon Cancer

Ankit Malik et al. Immunity. .

Abstract

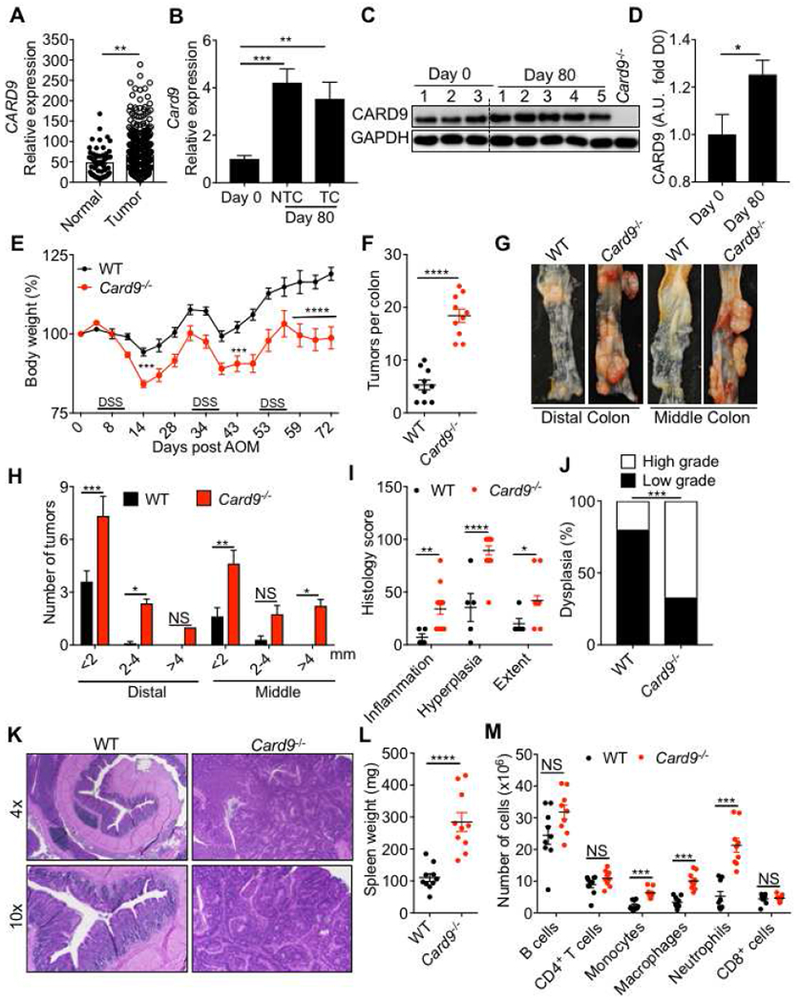
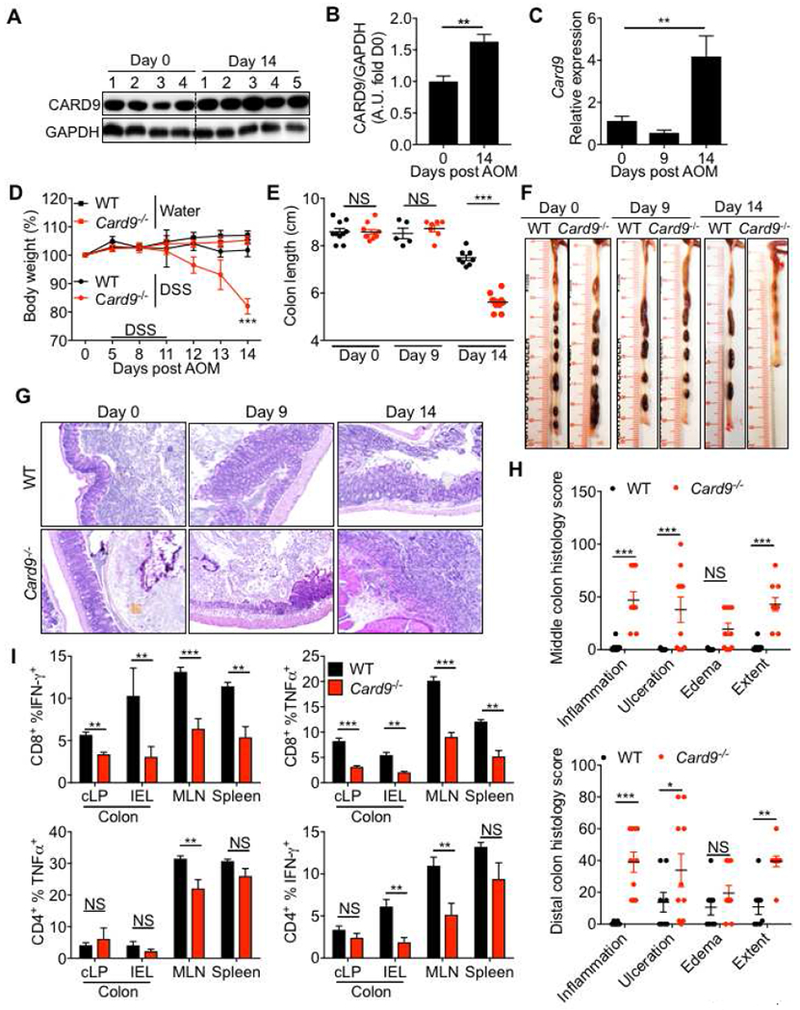
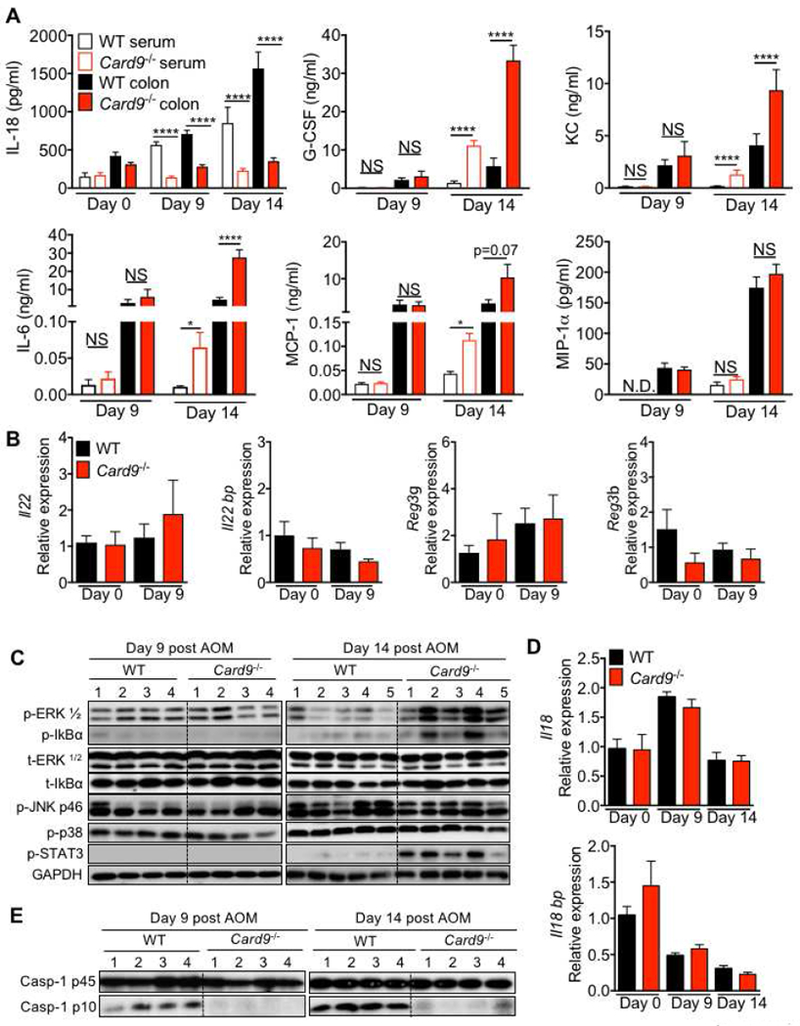
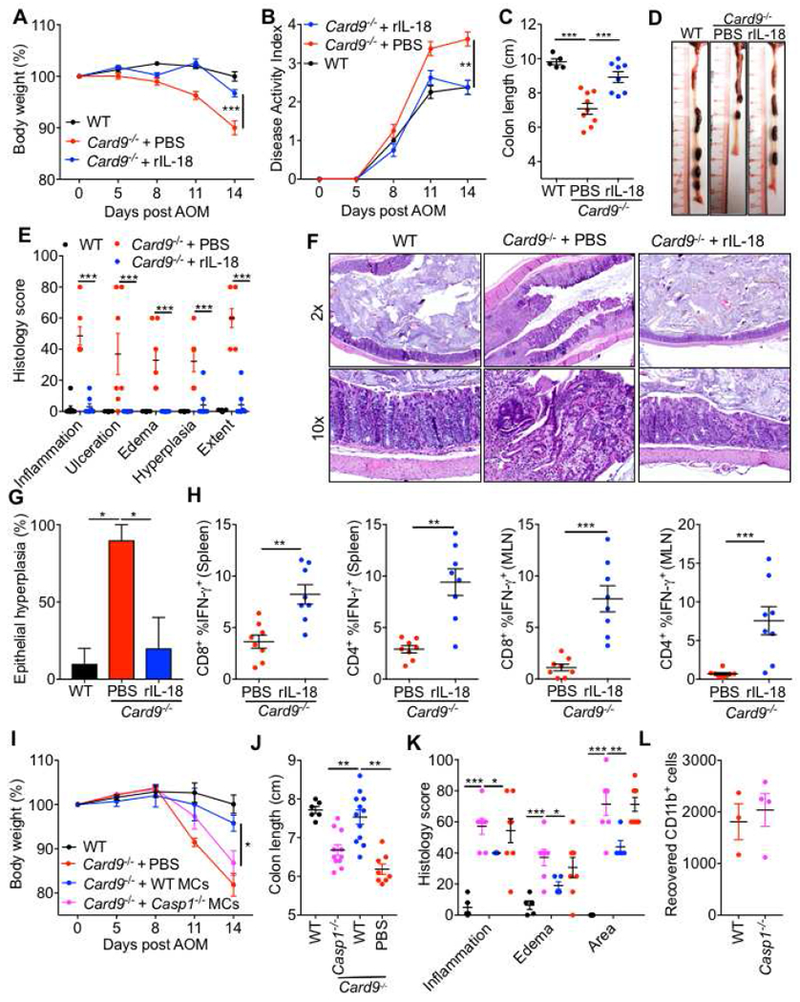
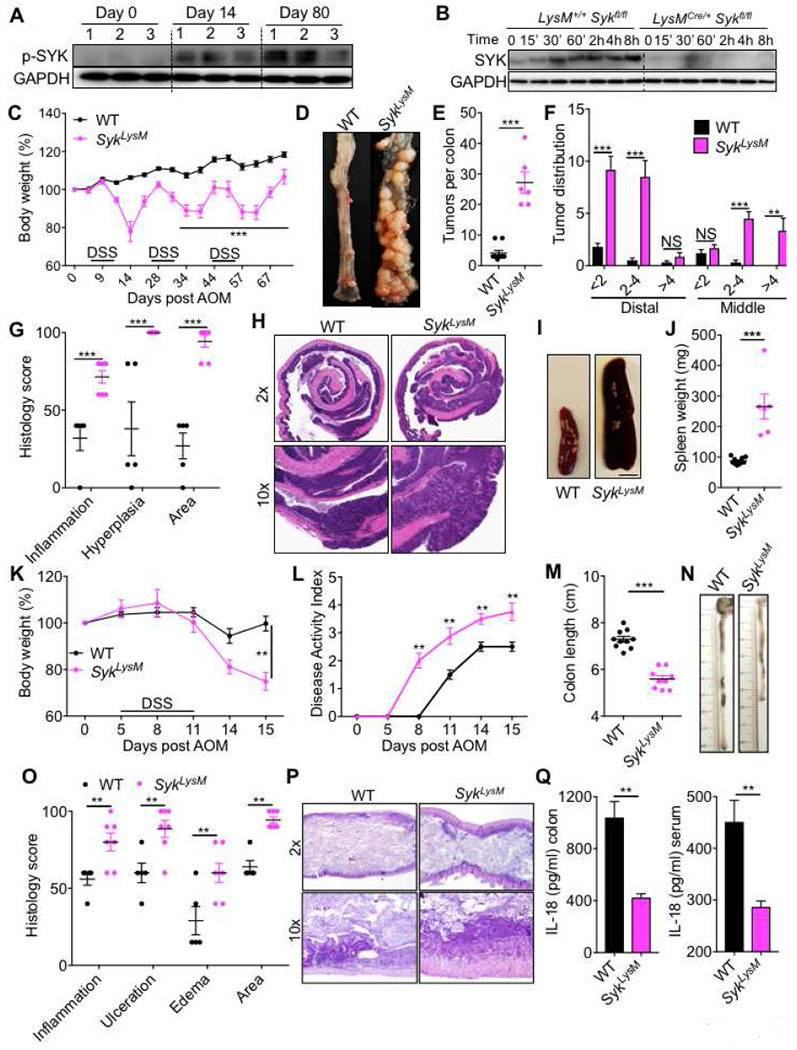
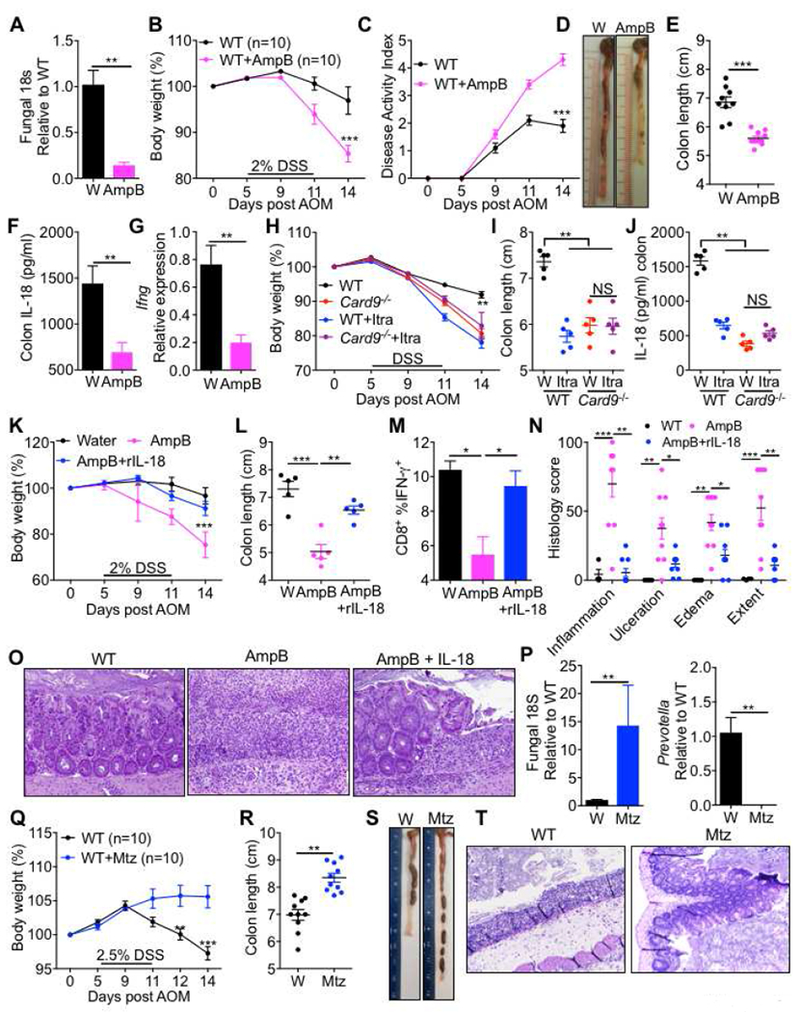
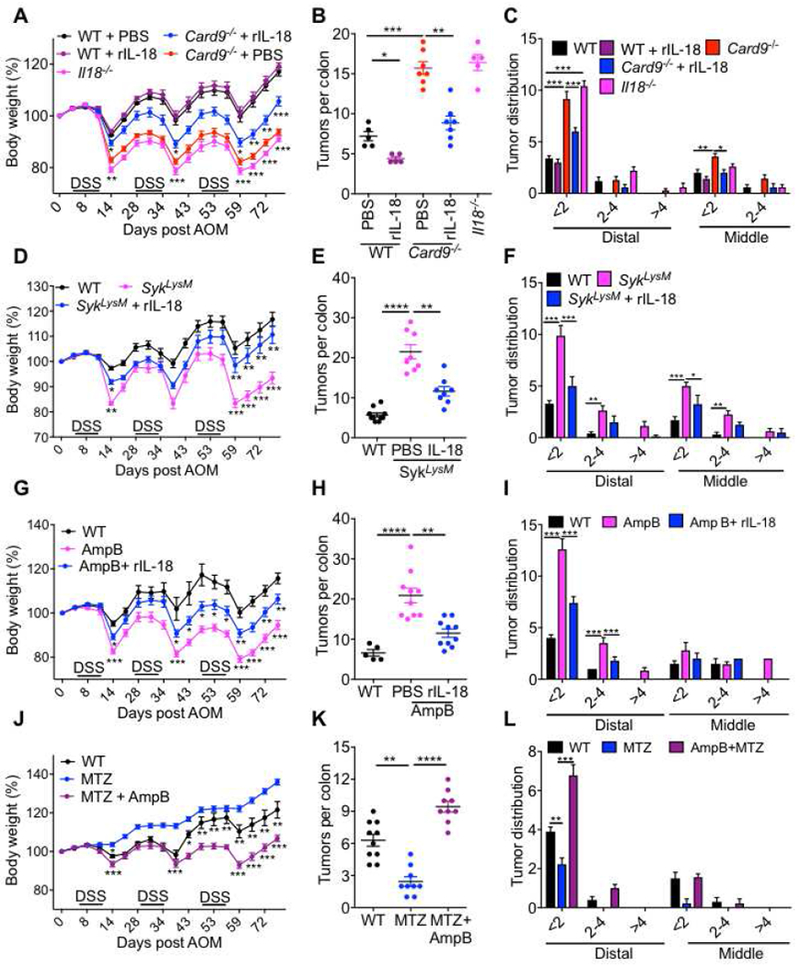
Fungi represent a significant proportion of the gut microbiota. Aberrant immune responses to fungi are frequently observed in inflammatory bowel diseases (IBD) and colorectal cancer (CRC), and mutations in the fungal-sensing pathways are associated with the pathogenesis of IBD. Fungal recognition receptors trigger downstream signaling via the common adaptor protein CARD9 and the kinase SYK. Here we found that commensal gut fungi promoted inflammasome activation during AOM-DSS-induced colitis. Myeloid cell-specific deletion of Card9 or Syk reduced inflammasome activation and interleukin (IL)-18 maturation and increased susceptibility to colitis and CRC. IL-18 promoted epithelial barrier restitution and interferon-γ production by intestinal CD8+ T cells. Supplementation of IL-18 or transfer of wild-type myeloid cells reduced tumor burden in AOM-DSS-treated Card9-/- and Sykfl/flLysMCre/+ mice, whereas treatment with anti-fungal agents exacerbated colitis and CRC. CARD9 deletion changes the gut microbial landscape, suggesting that SYK-CARD9 signaling maintains a microbial ecology that promotes inflammasome activation and thereby restrains colitis and colon tumorigenesis.

Keywords: CARD9; SYK; colorectal cancer; inflammatory bowel diseases; microbiota.


Conflict of interest statement

Conflict of Interest Statement: The authors have declared that no conflict of interest exists.

Declaration of Interests

The authors declare no competing interests.

Figures

Figure 1.
Figure 1.. CARD9 decreases susceptibility to colitis-associated cancer.
(A) CARD9 expression in normal human colon and tumor tissue from GENT database (B) Card9 expression in tumor and non-tumor colon tissue (NTC) relative to expression in the basal colon tissue (Day 0) of WT mice. (C) Immunoblot for CARD9 in colon tissue of WT mice at indicated times after AOM–DSS treatment and (D) the densitometric analysis for the CARD9 immunoblot. The last lane represents the lysate from the colon of a Card9−/− mouse on day 0. (E) Change in body weight in WT and Card9−/− mice injected with AOM on day 0 and administered with three rounds of 2% DSS in drinking water. (F) Number of tumors, (G) representative pictures of colons and (H) tumor distribution in the colons at day 80 post-AOM. (I) Colon histology scores and (J) proportion of mice with low- or high-grade dysplastic adenomas in the colons at day 80 post-AOM. (K) Representative H&E stained images at 4× and 10× magnifications of colon sections at day 80. (L) Spleen weight and (M) flow cytometric analysis of the indicated cellular populations in the spleens of WT and Card9−/− mice at day 80. Each symbol represents an individual mouse. NS, not significant; *P < 0.05; **P < 0.01, ***P < 0.001, ****P < 0.0001; Mann–Whitney U test (A, D, F and L), two-way ANOVA (E, H, I, M), one-way ANOVA followed by the Holm–Sidak post-hoc test (B) or Fisher’s exact test (J). Data are from one experiment representative of two independent experiments with n = 5-10 mice per group (A-M; mean and SEM [A, B, D, E, F, H, I, L and M]). See also Figure S1.
Figure 2.
Figure 2.. CARD9 decreases susceptibility to DSS-induced colitis.
(A) Immunoblot for CARD9 in the colon and (B) densitometric analysis of the CARD9 immunoloblot. (C) RT-PCR analysis for Card9 expression in whole colon. (D) Percent body weight (E) colon length and (F) representative photographs of colons from WT and Card9−/− mice at the indicated days post-AOM treatment. (G) Representative pictures of H&E stained colon sections and (H) histological analysis of colons at day 14. (I) Flow-cytometric analysis for TNF-α and IFN-γ production from CD8+ and CD4+ T cells from colonic epithelial, lamina propria fractions and mesenteric lymph nodes and spleens of WT and Card9−/− mice. Each symbol represents an individual mouse. NS, not significant; *P < 0.05; **P < 0.01, ***P < 0.001; Mann–Whitney U test (B and I), two-way ANOVA followed by the Holm–Sidak post-hoc test (D, E and H) or one-way ANOVA followed by the Holm–Sidak post-hoc test (C). Data are from one experiment representative of two independent experiments with n = 5-8 mice per group (A-H; mean and SEM [B, C, D, E, H and I]).
Figure 3.
Figure 3.. CARD9 promotes inflammasome activation in the colon.
(A) ELISA in colon explants and sera of WT or Card9−/− mice at indicated days post-infection. (B and D) qPCR analysis for expression of indicated genes in colon tissue from WT and Card9−/− mice at indicated days after AOM treatment. (C and E) immunoblotting for indicated proteins in homogenates from colon tissue. NS, not significant; ****P < 0.0001; Two-way ANOVA followed by Holm-Sidak post-test (A). Data are from one experiment representative of two independent experiments with n =4-8 mice per group for each time point (A-E; mean and SEM [A, B and D]). See also Figure S2.
Figure 4.
Figure 4.. Supplementation with IL-18 or myeloid cells protects Card9−/− mice from colitis and epithelial hyperplasia.
(A) Percent body weight (B) disease activity index (C) colon length and (D) representative colon photographs from WT and Card9−/− mice given PBS or IL-18 supplementation during AOM-DSS treatment. (E) Histological analysis of colons at day 14 and (F) representative pictures of H&E stained sections. (G) Percentage of mice with epithelial hyperplasia in colons at day 14. (H) Flow-cytometric analysis of TNF-α and IFN-γ production from CD8+ and CD4+ T cells from mesenteric lymph nodes and spleens of WT and Card9−/− mice at day 14. (I) Percent body weight, (J) colon length and (K) histological analysis of the colons from WT and Card9−/− mice at day 14 given WT or Casp1−/− myeloid cells (MCs). (L) Number of CD45.2+ CD11b+ cells recovered at day 14 from the colons of CD45.1 WT mice given WT or Casp1−/− MCs. Each symbol represents an individual mouse. NS, not significant; *P < 0.05; **P < 0.01, ***P < 0.001; Two-way ANOVA (A, B, E, I and K), one-way ANOVA followed by the Holm–Sidak post-hoc test (C, G and J) or Mann-Whitney U test (H). Data are from one experiment representative of two independent experiments with n = 5-10 mice per group (A-J) or n = 3-4 mice per group (L; mean and SEM [A, B, C, E, G, H, I, J, K and L]). See also Figures S3 and S4.
Figure 5.
Figure 5.. SYK activity in myeloid cells decreases susceptibility to colitis-associated cancer.
(A) Immunoblot for p-SYK (Tyr 519/520) in colon tissue of WT mice at indicated times after AOM–DSS treatment. (B) Immunoblot for SYK in bone marrow-derived myeloid cells from LysM+/+ Sykfl/fl (WT) and LysMCre+/− Sykfl/f (SykLysM) mice stimulated with 100 ng/ml of LPS for indicated times. (C) Change in body weight in WT and SykLysM mice injected with AOM on day 0 and administered 3 rounds of 2% DSS in drinking water. (D) Representative pictures of colons (E) number of tumors, (F) tumor distribution and (G) histological analysis in the colons of WT and SykLysM mice at day 80 post-AOM. (H) Representative H&E stained images from 2× and 10× magnification of colon sections at day 80 post-AOM injection. (I) Representative pictures of spleens of WT and SykLysM mice (scale bar = 4mm) and (J) spleen weights at day 80. (K) Body weight changes (L) disease activity index in WT and SykLysM mice during AOM-DSS treatment. (M) Colon length, (N) representative photographs of colons, (O) histological analysis of colons and (P) representative pictures of H&E stained sections from colons of WT and SykLysM mice at day 15. (Q) IL-18 ELISA from colon explants and serum of WT and SykLysM mice. Each symbol represents an individual mouse. NS, not significant; **P < 0.01, ***P < 0.001; two-way ANOVA followed by the Holm–Sidak post-hoc test (C, F, G, K, L and O) or Mann–Whitney U test (E, J, M and Q). Data are from one experiment representative of two independent experiments with n = 6-10 mice per group (A-Q; mean and SEM [C, E, F, G, J, K, L, M, O and Q]). See also Figure S4
Figure 6.
Figure 6.. Commensal gut fungi promote inflammasome activation
(A) qPCR analysis for fungi in fecal samples of mice treated with amphotericin B (AmpB) for 4 weeks. (B) Body weight change (C) disease activity index (D) representative colon photographs and (E) colon length at day 14. (F) Analysis of IL-18 in the explants and (G) Ifng expression in colon tissue at day 9 in WT mice treated with AmpB or drinking water for 4 weeks prior to AOM-DSS treatment. (H) Body weight change (I) colon length at day 14 and (J) Secretion of IL-18 in the colon explants at day 9 of WT and Card9−/− mice treated with Itraconazole for 4 weeks prior to AOM-DSS administration. (K) Body weight change in WT mice pretreated with AmpB, along with IL-18 or PBS supplementation during AOM-DSS treatment. (L) Colon length (M) IFN-γ production in CD8+ T cells of the MLN (N) histological analysis of colons and (O) representative pictures of H&E stained sections from colons at day 14. (P) qPCR analysis of indicated organisms in fecal samples of mice pre-treated with Metronidazole (Mtz) or control solution (1% sucrose in drinking water) for 5 days. (Q) Body weight change in WT mice treated with Mtz or control solution before AOM-DSS administration. (R) Colon length (S) representative colon photographs and (T) representative pictures of H&E stained sections from colons at day 14. Each symbol represents an individual mouse. *P < 0.05; **P < 0.01, ***P < 0.001; Mann–Whitney U test (A, E, F, G, P and R), two-way ANOVA (B, C, H, K, N and Q), one-way ANOVA followed by the Holm–Sidak post-hoc test (I, J, L and M). Data are from one experiment representative of two independent experiments with n = 5-10 mice per group (A-T; mean and SEM [A, B, C, E, F, G, H, I, J, K, L, M, N, P, Q, R and T]). See also Figures S5–S8.
Figure 7.
Figure 7.. IL-18 supplementation or metronidazole treatment protects Card9−/−, SykLysM and AmpB-treated mice from colon tumorigenesis.
(A) Change in body weight in WT, Card9−/− and Il18−/− mice injected with AOM on day 0 and administered 3 rounds of 2% DSS in drinking water. A group of WT and Card9−/− mice were also given IL-18 supplementation during AOM-DSS treatment. (B) number of tumors and (C) tumor distribution in the colons. (D) Change in body weight in WT and SykLysM mice injected with AOM on day 0 and administered 3 rounds of 2% DSS in drinking water. A group of SykLysM mice were also given IL-18 supplementation during AOM-DSS treatment. (E) number of tumors and (F) tumor distribution in the colons. (G) Change in body weight in WT mice treated with drinking water or AmpB for 4 weeks before being injected with AOM on day 0 and administered 3 rounds of 2% DSS in drinking water. A group of AmpB-treated WT mice were also given IL-18 supplementation during AOM-DSS treatment. (H) number of tumors and (I) tumor distribution in the colons. (J) Change in body weight in WT mice treated with d MTZ or both MTZ and AmpB for 4 weeks before being injected with AOM on day 0 and administered 3 rounds of 2% DSS in drinking water. (K) number of tumors and (L) tumor distribution in the colons. Each symbol represents an individual mouse. *P < 0.05; **P < 0.01, ***P < 0.001; Two-way ANOVA (A, C, D, F, G, I, J and L), one-way ANOVA followed by the Holm–Sidak post-hoc test (B, E, H and K). Data are from one experiment representative of two independent experiments with n = 8-10 mice per group (A-L; mean and SEM [A-L]).

Comment in

References

    1. Allen IC, TeKippe EM, Woodford RM, Uronis JM, Holl EK, Rogers AB, Herfarth HH, Jobin C, and Ting JP (2010). The NLRP3 inflammasome functions as a negative regulator of tumorigenesis during colitis-associated cancer. J Exp Med 207, 1045–1056. - PMC - PubMed
    1. Barrett JC, Hansoul S, Nicolae DL, Cho JH, Duerr RH, Rioux JD, Brant SR, Silverberg MS, Taylor KD, Barmada MM, et al. (2008). Genome-wide association defines more than 30 distinct susceptibility loci for Crohn’s disease. Nature genetics 40, 955–962. - PMC - PubMed
    1. Bergmann H, Roth S, Pechloff K, Kiss EA, Kuhn S, Heikenwalder M, Diefenbach A, Greten FR, and Ruland J (2017a). Card9-dependent IL-1beta regulates IL-22 production from group 3 innate lymphoid cells and promotes colitis-associated cancer. Eur J Immunol 47, 1342–1353. - PMC - PubMed
    1. Bergmann H, Roth S, Pechloff K, Kiss EA, Kuhn S, Heikenwälder M, Diefenbach A, Greten FR, and Ruland J (2017b). Card9-dependent IL-1β regulates IL-22 production from group 3 innate lymphoid cells and promotes colitis-associated cancer. European Journal of Immunology. - PMC - PubMed
    1. Caporaso JG, Kuczynski J, Stombaugh J, Bittinger K, Bushman FD, Costello EK, Fierer N, Peña AG, Goodrich JK, and Gordon JI (2010). QIIME allows analysis of high-throughput community sequencing data. Nature methods 7, 335–336. - PMC - PubMed

Publication types

MeSH terms