. 2018 Sep 18;24(12):3224-3236.
doi: 10.1016/j.celrep.2018.08.058.

ΔNp63α Suppresses TGFB2 Expression and RHOA Activity to Drive Cell Proliferation in Squamous Cell Carcinomas

Affiliations

ΔNp63α Suppresses TGFB2 Expression and RHOA Activity to Drive Cell Proliferation in Squamous Cell Carcinomas

Christopher G Abraham et al. Cell Rep. .

Abstract

The transcriptional repressor ΔNp63α is a potent oncogene widely overexpressed in squamous cell carcinomas (SCCs) of diverse tissue origins, where it promotes malignant cell proliferation and survival. We report here the results of a genome-wide CRISPR screen to identify pathways controlling ΔNp63α-dependent cell proliferation, which revealed that the small GTPase RHOA blocks cell division upon ΔNp63α knockdown. After ΔNp63α depletion, RHOA activity is increased, and cells undergo RHOA-dependent proliferation arrest along with transcriptome changes indicative of increased TGF-β signaling. Mechanistically, ΔNp63α represses transcription of TGFB2, which induces a cell cycle arrest that is partially dependent on RHOA. Ectopic TGFB2 activates RHOA and impairs SCC proliferation, and TGFB2 neutralization restores cell proliferation during ΔNp63α depletion. Genomic data from tumors demonstrate inactivation of RHOA and the TGFBR2 receptor and ΔNp63α overexpression in more than 80% of lung SCCs. These results reveal a signaling pathway controlling SCC proliferation that is potentially amenable to pharmacological intervention.

Keywords: CRISPR screen; head and neck carcinoma; lung cancer; p53; p63.


Figures

Figure 1.
Figure 1.. A CRISPR Screen Identifies RHOA Signaling as a Negative Regulator of ΔNp63α-Driven Cell Proliferation
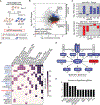
(A) Outline of the CRISPR screening strategy in H226 cells using the Human GeCKOv2 libraries. (B) MA plotfor individual sgRNAs detected at the conclusion ofthe screen. The 1,000 non-targeting control sgRNAs are highlighted in black, whereas significant sgRNAs (adjusted p < 0.05, fold change ≥ 2) for genes where at least two sgRNAs met these thresholds are highlighted in blue and red forenriched and depleted sgRNAs, respectively. (C) Fold change values for all six sgRNAs; for example, p63-APG (RHOA) and p63-SLG (ARHGAP35) candidates. (D) Plot showing membership of individual p63-APG and p63-SLG candidates across the top canonical pathways (p < 0.005) enriched among the 141 high-confidence screen hits, as revealed by Ingenuity Pathway Analysis. Genes within each pathway are color-coded by — log10-transformed pathway enrichment p values. (E) Schematic showing known relationshipsamong p63-APG (blue) and p63-SLG (red) candidates related to RHOAsignaling (see main textfor references). Listed below each candidate is the log2-transformed median fold change for significant sgRNAs targeting that gene. (F) Number of significant sgRNAs (adjusted p < 0.05, fold change ≥ 2) for p63-APG and p63-SLG candidates included in (E). See also Figure S1 and Table S1.
Figure 2.
Figure 2.. RHOA Signaling Blocks Cell Proliferation upon Depletion of ΔNp63α
(A) Relative EdU signal forH226 cells treated with the indicated siRNA combinations.Values were normalized to the DAPI signal and are expressed relative to cells treated with control siRNAonly. Data are represented as mean ± SEM from three independent replicates. Asterisks indicate significant differences in comparison to p63 siRNA alone (unpaired t test, *p < 0.05). (B) Relative mRNA expression for ΔNp63α and RHOA in H226 cells expressing control or p63-targeting shRNAs. Values were normalized to 18S ribosomal RNA and are expressed relative to the mean of control shRNA-expressing cells. Data are represented as mean ± SEM from three independent replicates. Asterisk indicates significant difference (unpaired t test, *p < 0.05). (C) Western blot showing levels of RHOA, p63, and GAPDH in cell lysates (input) and in a pull-down of active Rho proteinsfrom H226 cells expressing control or p63-targeting shRNAs. The blot labeled RHOA (HC) has been adjusted for higher contrast in the pull-down lanes. (D) Quantification of active RHOA levels from the active RHOA pull-down assay. Values were normalized to total RHOA levels in input lysates. Data are represented as mean ± SEM from four independent replicates. The asterisk indicates significant difference (unpaired t test, *p < 0.05). (E) Representative images of H226 control and shp63 cells stained with DAPI and phalloidin. Scale bar, 25 μm. (F) Relative cell numbersfor H226 cells 72 hraftertransfection with expression constructsforwild-type (WT), constitutivelyactive(G14V), and dominant-negative (T19N) RHOA. Values are expressed relative to cells transfected with vector alone. Data are represented as mean ± SEM from three independent replicates. Asterisk indicates significant difference (unpaired t test, *p < 0.05). See also Figure S2.
Figure 3.
Figure 3.. Components of the RHOA Signaling Network Are Commonly Repressed in Lung SCCTumors
(A) Oncoprint of TP63 and 13 genes associated with the TGF-β and RHOA signaling pathways identified in the CRISPR screen. (B) Heat map of expression levels (tumor versus normal tissue) for the 141 genesthat scored as significant in the CRISPR screen. Genes are ranked in descending order based upon Z scores calculated from RSEM (RNA-seq by expectation maximization) values relative to healthy tissue. Genes in the TGF-β and RHOA signaling pathways are indicated with arrows. (C) Heatmap of pairwise Pearson correlations to TP63 expression (RSEM V2) for each of the 141 screen hits. (D) Donut plotswith combined copy numbervariation and expression data showing the proportion of lung SCC and lung adenocarcinoma (AD) samples with gain or loss of TP63 and RHOA.
Figure 4.
Figure 4.. ΔNp63α Represses Transcription of TGFB2, an Upstream Activator of RHOA
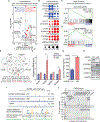
(A) Volcano plot of activation Zscores against p values for Ingenuity Canonical Pathways Analysis of genes differentially expressed between shControl and shp63 H226 cells after 6 days of doxycycline treatment to induce shRNA expression. The circled areas are proportional to the number of genes with significant expression changes (adjusted p < 0.1). (B) Bubble plots showing relative expression of selected genes from enriched pathways in shControl and shp63 H226 cells. Circle areas are proportional to RPKM (reads per kilobase per million mapped reads) levels), normalized per gene. (C and D) Gene set enrichment analysis (GSEA) plots for the G2M (C) and TGF-β pathway (D) hallmark gene sets, with black bars indicating where gene set members fall among all genes when ranked by log2-transformed ratio (shp63/shControl). (E) Venn diagram of genes differentially expressed upon p63 depletion in H226, FaDu, JHU029, and HaCaT cells. (F) Relative mRNA expression for TGFB1, TGFB2, TGFBR1, and TGFBR2 in shControl and shp63 H226 cells as defined by qRT-PCR. Values were normalized to 18S ribosomal RNA and are expressed relative to the mean of shControl cells. Data are represented as mean ± SEM from three independent replicates. Asterisks indicate significant differences (unpaired t test, *p < 0.05). (G) Levels of TGFB2 in culture supernatants of shControl and shp63 H226 cells, as measured by ELISA. Data are represented as mean ± SEM from three independent replicates. Asterisk indicates significant difference (unpaired t test, *p < 0.05). (H) Western blot showing levels of p63, phospho-TGFBR2, phospho-SMAD2, phospho-SMAD3, and GAPDH in shControl and shp63 H226 cells. (I) p63 ChIP-seq tracks from primary keratinocytes (Kouwenhoven, 2010) and human normal foreskin (HNFK) cells (McDade et al., 2014). Shown at the bottom are the Jaspar database p63 position-weight matrix (Mathelier et al., 2016), p63 consensus site (Perez et al., 2007), and genomic sequence of the indicated loci. (J) ChIP analysis of p63 and serine-2-phosphorylated Pol II (Pol II S2P) at the TGFB2 locus in shControl and shp63 H226 cells. To represent profiles across the locus, values are plotted as the percentage of maximum signal for each epitope. Data are represented as mean ± SEM from three independent replicates. The gray area indicates the transcribed region. Black tick marks indicate the position of each amplicon. See also Figure S3 and Table S2.
Figure 5.
Figure 5.. Elevated TGFB2 Contributes to Cell Cycle Arrest upon Depletion of ΔNp63α
(A) Western blot showing levels of RHOA and GAPDH in WT and RHOA−/− H226 cells. (B) Relative number of WT and RHOA−/− H226 in response to increasing doses of recombinant TGFB2. (C) Quantification of active RHOA levels in pull-down from lysates from H226 cells with or without recombinant TGFB2. Values were normalized to total RHOA levels in input lysates. Data are represented as mean ± SEM from three independent replicates. The asterisk indicates significant difference (unpaired t test, *p < 0.05). (D) Cell counts for CAL27 cells after treatment with increasing doses of recombinant TGFB2 for 72 hr. (E) Cell counts for HaCaT cells after treatment with increasing doses of recombinant TGFB2 for 72 hr. (F) Cell countsfor control and shp63 H226 cellsafter96 hrtreatment with theTGF-β-neutralizing antibody 1D11. Dataare represented as mean ± SEM from three independent replicates. The asterisk indicates significant difference (unpaired t test, *p < 0.05). (G) Model summarizing the results reported here, whereby the TGFB2 to RHOA signaling pathway is required to enforce proliferation arrest upon ΔNp63α depletion. For data in (B)-(F), data are represented as mean ± SEM from three independent replicas. Asterisk indicates significant difference (unpaired t test, *p < 0.05).

References

    1. Brunner HG, Hamel BC, and Bokhoven Hv Hv. (2002). P63 gene mutations and human developmental syndromes. Am. J. Med. Genet. 112, 284–290. - PubMed
    1. Burridge K, and Wennerberg K (2004). Rho and Rac take center stage. Cell 116, 167–179. - PubMed
    1. Cancer Genome Atlas Research Network (2012). Comprehensive genomic characterization of squamous cell lung cancers. Nature 489, 519–525. - PMC - PubMed
    1. Cancer Genome Atlas Research Network (2014). Comprehensive molecular profiling of lung adenocarcinoma. Nature 511, 543–550. - PMC - PubMed
    1. Deakin NO, Ballestrem C, and Turner CE (2012). Paxillin and Hic-5 interaction with vinculin is differentially regulated by Rac1 and RhoA. PLoS ONE 7, e37990. - PMC - PubMed

Publication types

MeSH terms