

Opposing Roles of FANCJ and HLTF Protect Forks and Restrain Replication during Stress
- PMID: 30232006
- PMCID: PMC6218949
- DOI: 10.1016/j.celrep.2018.08.065
Opposing Roles of FANCJ and HLTF Protect Forks and Restrain Replication during Stress
Abstract
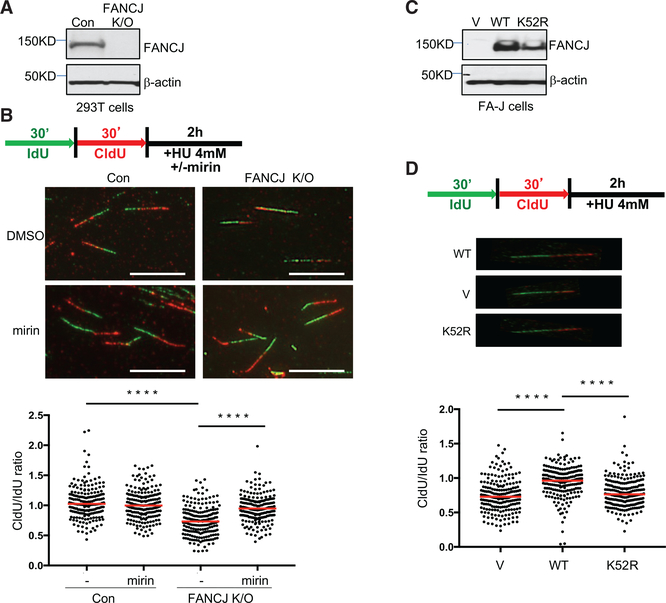
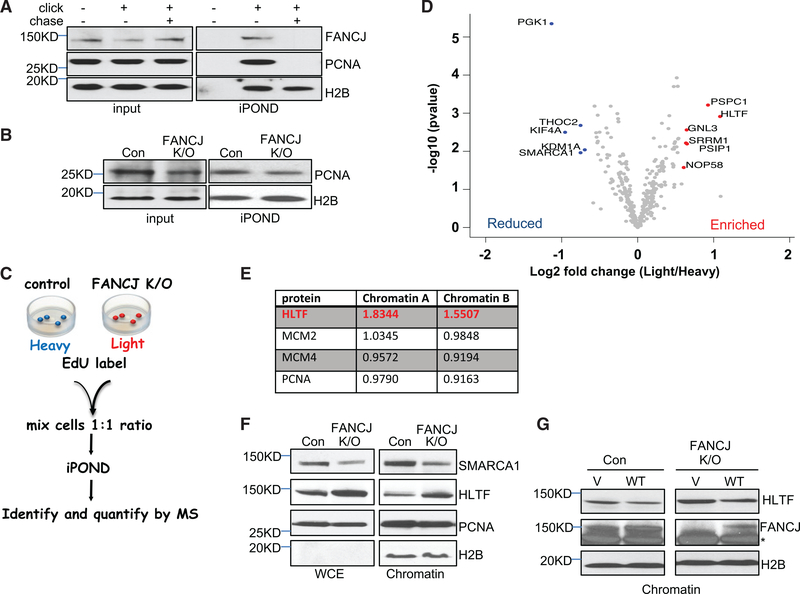
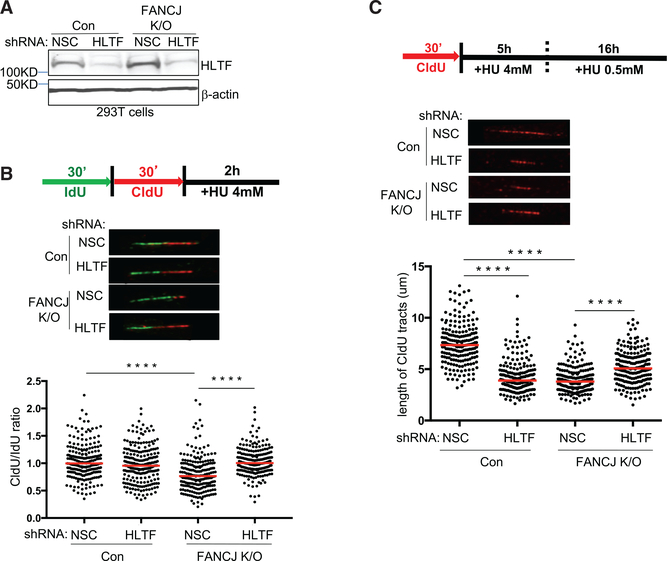
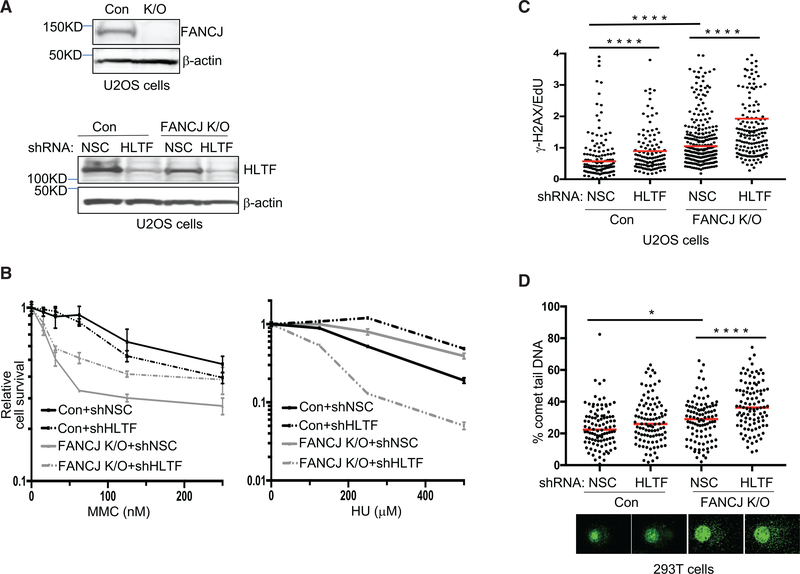
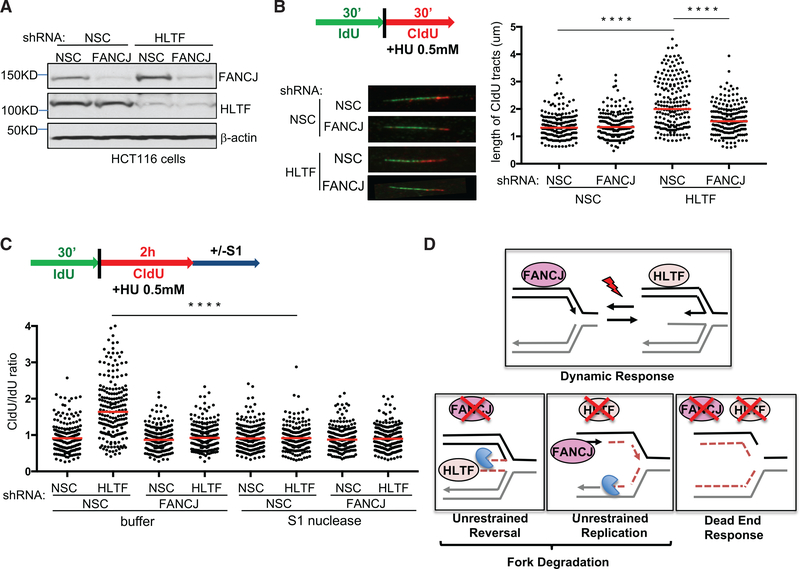
The DNA helicase FANCJ is mutated in hereditary breast and ovarian cancer and Fanconi anemia (FA). Nevertheless, how loss of FANCJ translates to disease pathogenesis remains unclear. We addressed this question by analyzing proteins associated with replication forks in cells with or without FANCJ. We demonstrate that FANCJ-knockout (FANCJ-KO) cells have alterations in the replisome that are consistent with enhanced replication stress, including an aberrant accumulation of the fork remodeling factor helicase-like transcription factor (HLTF). Correspondingly, HLTF contributes to fork degradation in FANCJ-KO cells. Unexpectedly, the unrestrained DNA synthesis that characterizes HLTF-deficient cells is FANCJ dependent and correlates with S1 nuclease sensitivity and fork degradation. These results suggest that FANCJ and HLTF promote replication fork integrity, in part by counteracting each other to keep fork remodeling and elongation in check. Indicating one protein compensates for loss of the other, loss of both HLTF and FANCJ causes a more severe replication stress response.
Keywords: DNA replication; FANCJ/BACH1/BRIP1; Fanconi anemia; fork degradation; fork protection; helicase; hereditary breast cancer; iPOND; replication stress response; replisome.
Copyright © 2018 The Author(s). Published by Elsevier Inc. All rights reserved.
Conflict of interest statement
DECLARATION OF INTERESTS
The authors declare no competing interests.
Figures
Similar articles
-
A minimal threshold of FANCJ helicase activity is required for its response to replication stress or double-strand break repair.Nucleic Acids Res. 2018 Jul 6;46(12):6238-6256. doi: 10.1093/nar/gky403. Nucleic Acids Res. 2018. PMID: 29788478 Free PMC article.
-
FANCJ/BRIP1 recruitment and regulation of FANCD2 in DNA damage responses.Chromosoma. 2010 Dec;119(6):637-49. doi: 10.1007/s00412-010-0285-6. Epub 2010 Jul 31. Chromosoma. 2010. PMID: 20676667 Free PMC article.
-
HLTF Promotes Fork Reversal, Limiting Replication Stress Resistance and Preventing Multiple Mechanisms of Unrestrained DNA Synthesis.Mol Cell. 2020 Jun 18;78(6):1237-1251.e7. doi: 10.1016/j.molcel.2020.04.031. Epub 2020 May 21. Mol Cell. 2020. PMID: 32442397 Free PMC article.
-
Assessing the link between BACH1/FANCJ and MLH1 in DNA crosslink repair.Environ Mol Mutagen. 2010 Jul;51(6):500-7. doi: 10.1002/em.20568. Environ Mol Mutagen. 2010. PMID: 20658644 Review.
-
Mutational analysis of FANCJ helicase.Methods. 2016 Oct 1;108:118-29. doi: 10.1016/j.ymeth.2016.04.023. Epub 2016 Apr 21. Methods. 2016. PMID: 27107905 Review.
Cited by
-
Replication Fork Reversal and Protection.Front Cell Dev Biol. 2021 May 10;9:670392. doi: 10.3389/fcell.2021.670392. eCollection 2021. Front Cell Dev Biol. 2021. PMID: 34041245 Free PMC article. Review.
-
The emerging determinants of replication fork stability.Nucleic Acids Res. 2021 Jul 21;49(13):7224-7238. doi: 10.1093/nar/gkab344. Nucleic Acids Res. 2021. PMID: 33978751 Free PMC article. Review.
-
An Arabidopsis FANCJ helicase homologue is required for DNA crosslink repair and rDNA repeat stability.PLoS Genet. 2019 May 23;15(5):e1008174. doi: 10.1371/journal.pgen.1008174. eCollection 2019 May. PLoS Genet. 2019. PMID: 31120885 Free PMC article.
-
Holding All the Cards-How Fanconi Anemia Proteins Deal with Replication Stress and Preserve Genomic Stability.Genes (Basel). 2019 Feb 22;10(2):170. doi: 10.3390/genes10020170. Genes (Basel). 2019. PMID: 30813363 Free PMC article. Review.
-
A perspective on tumor radiation resistance following high-LET radiation treatment.J Cancer Res Clin Oncol. 2024 May 2;150(5):226. doi: 10.1007/s00432-024-05757-8. J Cancer Res Clin Oncol. 2024. PMID: 38696003 Free PMC article. Review.
References
-
- Alabert C, Bukowski-Wills JC, Lee SB, Kustatscher G, Nakamura K, de Lima Alves F, Menard P, Mejlvang J, Rappsilber J, and Groth A (2014). Nascent chromatin capture proteomics determines chromatin dynamics during DNA replication and identifies unknown fork components. Nat. Cell Biol 16, 281–293. - PMC - PubMed
-
- Beutler E (2007). PGK deficiency. Br. J. Haematol 136, 3–11. - PubMed
Publication types
MeSH terms
Substances
Grants and funding
LinkOut - more resources
Full Text Sources
Other Literature Sources
Research Materials
Miscellaneous
