. 2018 Dec;17(12):2496-2507.
doi: 10.1074/mcp.RA118.000880. Epub 2018 Sep 19.

A New Tool to Reveal Bacterial Signaling Mechanisms in Antibiotic Treatment and Resistance

Affiliations

A New Tool to Reveal Bacterial Signaling Mechanisms in Antibiotic Treatment and Resistance

Miao-Hsia Lin et al. Mol Cell Proteomics. 2018 Dec.

Abstract

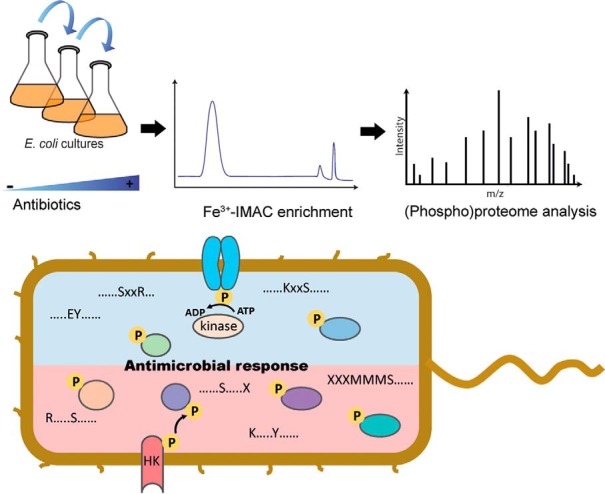
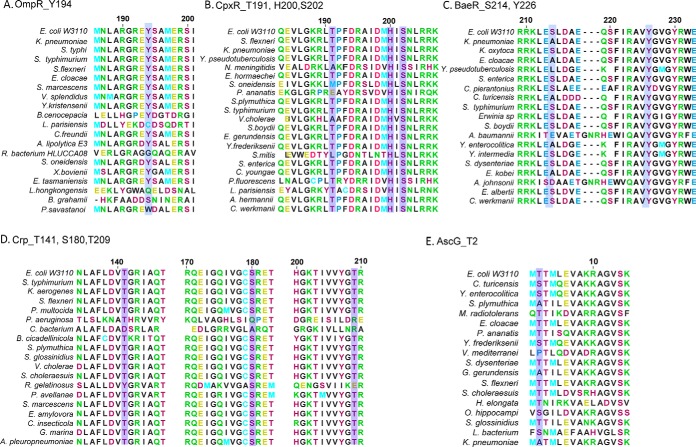
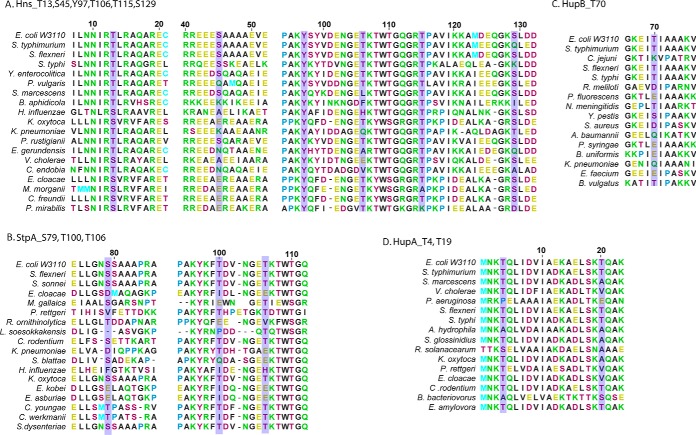
The rapid emergence of antimicrobial resistance is a major threat to human health. Antibiotics modulate a wide range of biological processes in bacteria and as such, the study of bacterial cellular signaling could aid the development of urgently needed new antibiotic agents. Due to the advances in bacterial phosphoproteomics, such a systemwide analysis of bacterial signaling in response to antibiotics has recently become feasible. Here we present a dynamic view of differential protein phosphorylation upon antibiotic treatment and antibiotic resistance. Most strikingly, differential phosphorylation was observed on highly conserved residues of resistance regulating transcription factors, implying a previously unanticipated role of phosphorylation mediated regulation. Using the comprehensive phosphoproteomics data presented here as a resource, future research can now focus on deciphering the precise signaling mechanisms contributing to resistance, eventually leading to alternative strategies to combat antimicrobial resistance.

Keywords: Bacteria; Microbiology; Pathogens; Phosphorylation; Quantification; antimicrobial resistance.


Conflict of interest statement

The authors declare no competing financial interest.

Figures

None
Graphical abstract
Fig. 1.
Fig. 1.
Quantitative proteomic analysis of E. coli continuously exposed to colistin or ciprofloxacin. (A) Wild-type E. coli cells were continuously exposed to the antibiotics colistin or ciprofloxacin with the concentration being one quarter of the MIC. No MIC increase was noticed after 4 days of exposure to colistin, while the clinically isolated mcr-1 strain exhibited a MIC of 8 μg/ml. However, after three and 7 days of exposure to ciprofloxacin, the MIC increased eightfold (128 ng/ml) and 64-fold (1,024 ng/ml), respectively. (B, C) Principle component analysis shows that the three replicates cluster together, indicating good reproducibility. (B) Pink circles represent the control wild-type E. coli W3110 strain without colistin treatment. The purple circles represent the 4 days colistin treated E. coli cells, blue circles represent the mcr-1 E. coli strain. This analysis of protein expression patterns clearly showed that colistin treated E. coli cells were closer to the mcr-1 strain. (C) Purple and violet circles are representing E. coli cells harvested after 3 days or 7 days of ciprofloxacin treatment, respectively and brown circles represent the nontreated control. For ciprofloxacin, E. coli cells with an induced higher MIC (day 3, day 7) showed different patterns compared with nontreated E. coli cells. (D, E) Unsupervised clustering analysis of the changes in the proteome following induction of resistance to (D) colistin and (E) ciprofloxacin. The color code shows the relative abundance based on the Z-score. On the right, for each box that is highlighted in the cluster analysis, the enriched pathways are displayed. Proteins that belong to a specific cluster and participate in a certain pathway are indicated by their gene names. The pathway enrichment was performed using PANTHER (p values <0.05).
Fig. 2.
Fig. 2.
Comprehensive profiling of the E. coli phosphoproteome. (A) Dynamic range of the quantifiable phosphopeptides with the corresponding overrepresented biological process GO terms. GO term enrichment was performed using PANTHER (http://www.pantherdb.org/) with p value < 0.05. (B) Correlation between the number of phosphosites per protein and protein abundance shows there is a weak correlation (Pearson correlation is 0.65). The color code indicates the protein abundance at log10 scale. (C) Characterization of the phosphoproteins based on the number of phosphosites indicated that most of the proteins, around 45%, only have one phosphosite. (D) Phosphosite distribution across S/T/Y/H/D residues. (E) The overlap between phosphosites identified in this study and public databases, dbPSP and Uniprot, showing the up to 89.6% of phosphosites identified in this study are novel phosphosites.
Fig. 3.
Fig. 3.
Phosphoproteomes of E. coli changes extensively upon colistin and ciprofloxacin treatment. As observed for the proteome analysis, triplicate phosphoproteomics samples clustered well together. (A) The pink circles represent the control E. coli W3110 strain without colistin treatment, whereas purple circles represent data from the serially passaged wile-type E. coli cells treated with colistin. Blue circles represent data from the mcr-1 E. coli strain. Colistin-treated wild-type E. coli cells are in this analysis closer to the mcr-1 strain, suggesting that common resistance mechanisms are partially shared. (B) For ciprofloxacin treatment, brown circles represent the control wild-type E. coli W3110 strain without ciprofloxacin treatment and purple and violet circles are representing the E. coli cells harvested after 3 days or 7 days treatment with ciprofloxacin, respectively. (C, D) Heatmap clustering of phosphorylation profiles after (C) colistin and (D) ciprofloxacin treatment. Each box represents a distinct unsupervised cluster profile across the different antibiotic susceptibilities. The color scale from blue to red indicates the Z-score, indicating decreased and increased phosphorylation. Regulated phosphosites in known resistance-related pathways are shown in the middle. Enriched phosphorylation motifs within particular clusters are displayed on the right, implicating that some specific kinases are involved in regulation. X was used to represent the N- or C-terminal position but not any particular amino acid. N-terminal phosphorylation was overrepresented in both treatments, while the C-terminal phosphorylation is only regulated in ciprofloxacin treatment. Three tyrosine phosphorylation motifs were enriched as well as four basophilic motifs.
Fig. 4.
Fig. 4.
KEGG pathway enrichment analysis based on regulated phosphosites containing proteins from both colistin and ciprofloxacin treatments. (A) In total, 555 phosphoproteins were subjected to KEGG pathway enrichment using Cytoscape with the ClueGO app. The pathways shown here are significantly enriched with p value < 0.05. Black circles represent the phosphoproteins containing regulated phosphosites, while the colored ellipses represent each overrepresented pathways. Proteins inside overlapping pathways indicate that these proteins are involved in multiple pathways. (B) The regulated phosphosites identified in ABC transporter and two component system upon colistin (blue circle) and ciprofloxacin (brown circle) treatments (green: down-regulated, pink: up-regulated).
Fig. 5.
Fig. 5.
Observed phosphosites are highly conserved on the helix-turn-helix regions of several transcription factors as revealed by sequence alignment across different bacteria. (A–C) Alignment of regulated phosphosites in the OmpR/PhoB subfamily transcription factors, including the Y194 on OmpR, H200 and S202 on CpxR, and S214 and Y226 on BaeR. (D, E) Alignment of phosphorylated residues on the non-OmpR/PhoB subfamily transcription factors, which are T141, S180, and T209 on Crp and T2 on AscG. These phosphosites have high conservation across different bacteria indicating a possible conserved role in regulations. Sequence alignment was performed with Clustal X with default parameters. The purple boxes represent the phosphosites identified in this study.
Fig. 6.
Fig. 6.
Observed phosphosites are highly conserved in a variety of DNA-binding proteins across different bacteria. The phosphosites identified on DNA binding proteins (in purple boxes) include (A) T13, S45, Y97, T106, T115, and S129 on Hns, (B) S79, T100, and T106 on StpA, (C) T70 on HupB, and (D) T4 and T19 on HupA. Although S45 on Hns and T70 on HupB display slightly lower conservation, the high prevalence of acidic amino acids instead of Ser or Thr may reflect the fact that the negative charge is essential for protein functions.

Similar articles

Cited by

References

    1. O'Neill J. (2016) Tackling drug-resistant infections globally: Final report and recommendations https://amr-review.org/sites/default/files/160525_Final%20paper_with%20c...
    1. Clardy J., Fischbach M. A., and Currie C. R. (2009) The natural history of antibiotics. Curr. Biol. 19, R437–R441 - PMC - PubMed
    1. Goh E. B., Yim G., Tsui W., McClure J., Surette M. G., and Davies J. (2002) Transcriptional modulation of bacterial gene expression by subinhibitory concentrations of antibiotics. Proc. Natl. Acad. Sci. U.S.A. 99, 17025–17030 - PMC - PubMed
    1. Hoffman L. R., D'Argenio D. A., MacCoss M. J., Zhang Z., Jones R. A., and Miller S. I. (2005) Aminoglycoside antibiotics induce bacterial biofilm formation. Nature 436, 1171–1175 - PubMed
    1. Yim G., Wang H. H., and Davies J. (2007) Antibiotics as signalling molecules. Phil. Trans. Royal Society London Series B 362, 1195–1200 - PMC - PubMed

Publication types

MeSH terms