

Calcitriol and Calcipotriol Modulate Transport Activity of ABC Transporters and Exhibit Selective Cytotoxicity in MRP1-overexpressing Cells
- PMID: 30232176
- PMCID: PMC7333660
- DOI: 10.1124/dmd.118.081612
Calcitriol and Calcipotriol Modulate Transport Activity of ABC Transporters and Exhibit Selective Cytotoxicity in MRP1-overexpressing Cells
Abstract
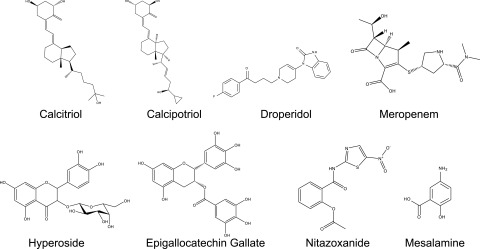
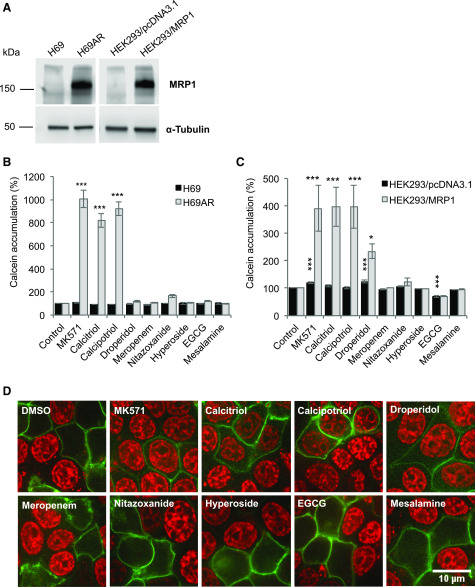
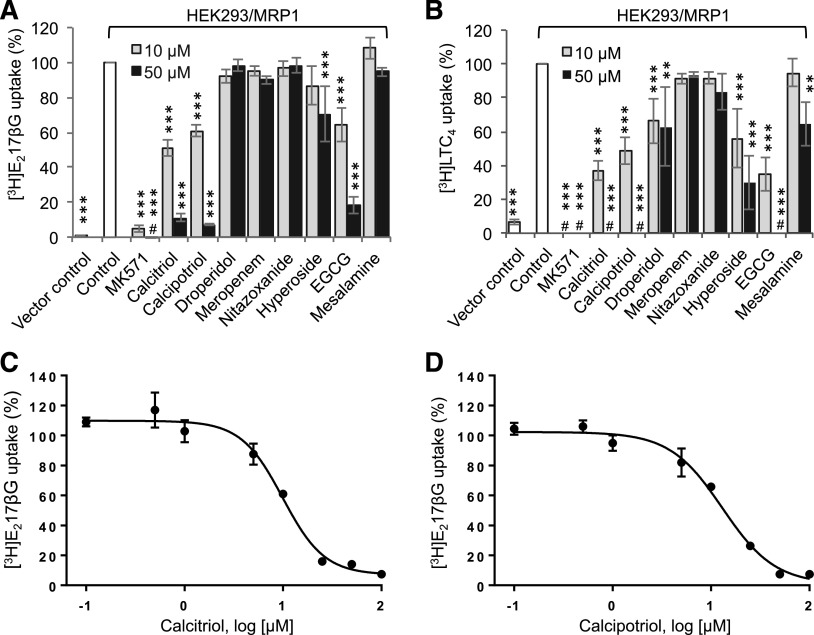
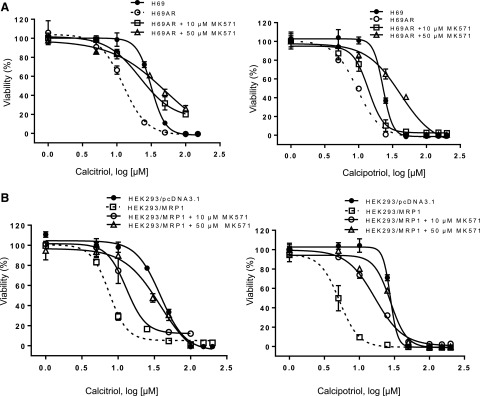
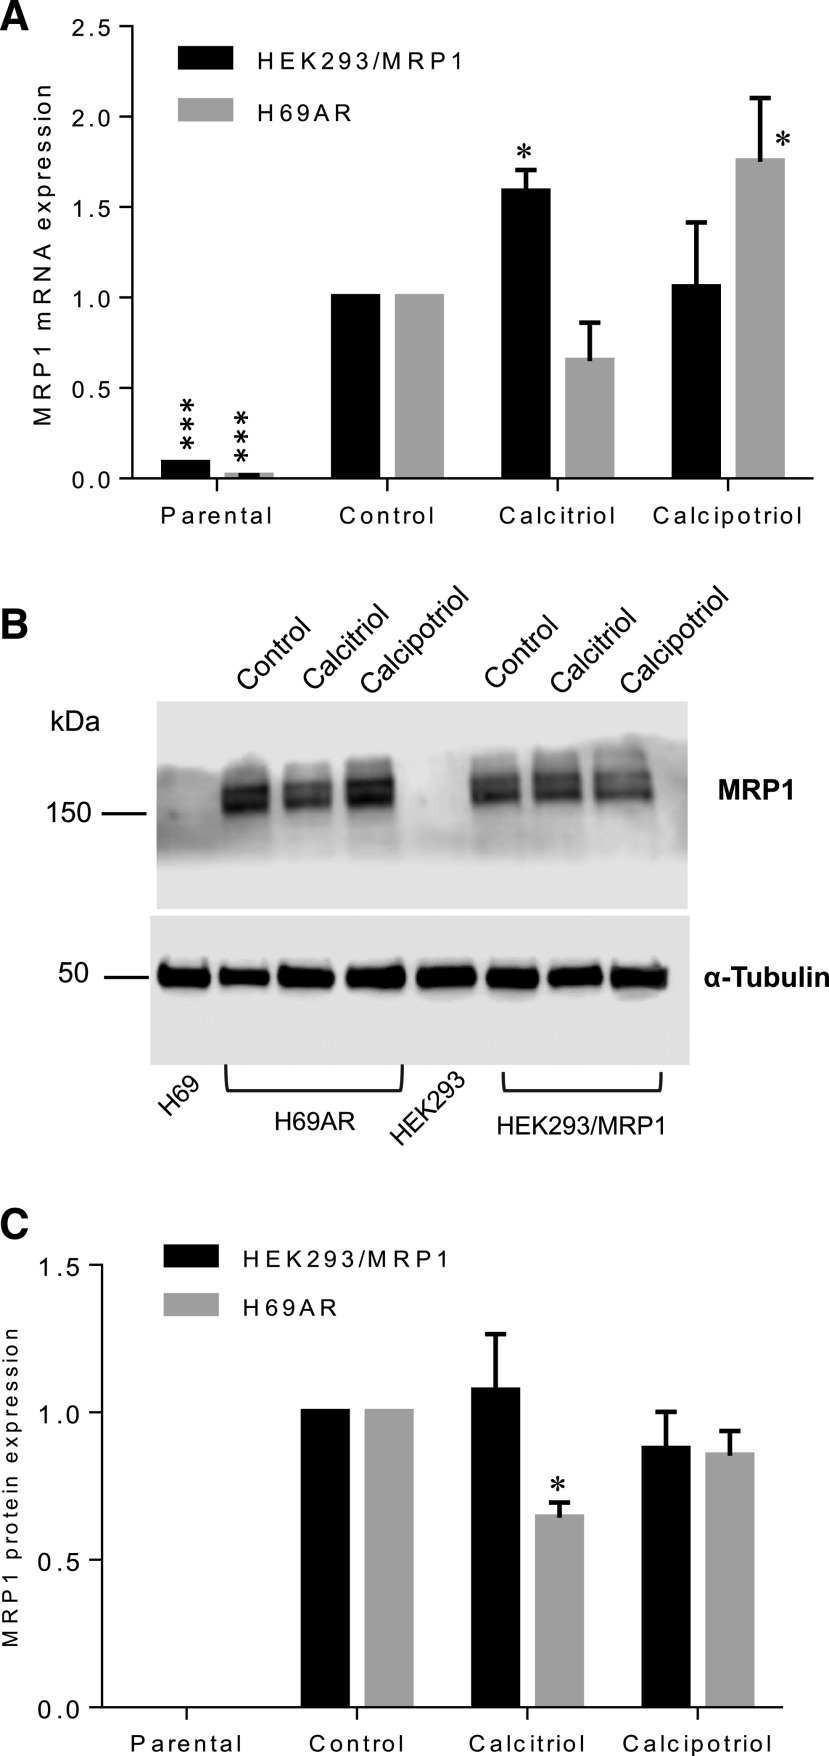
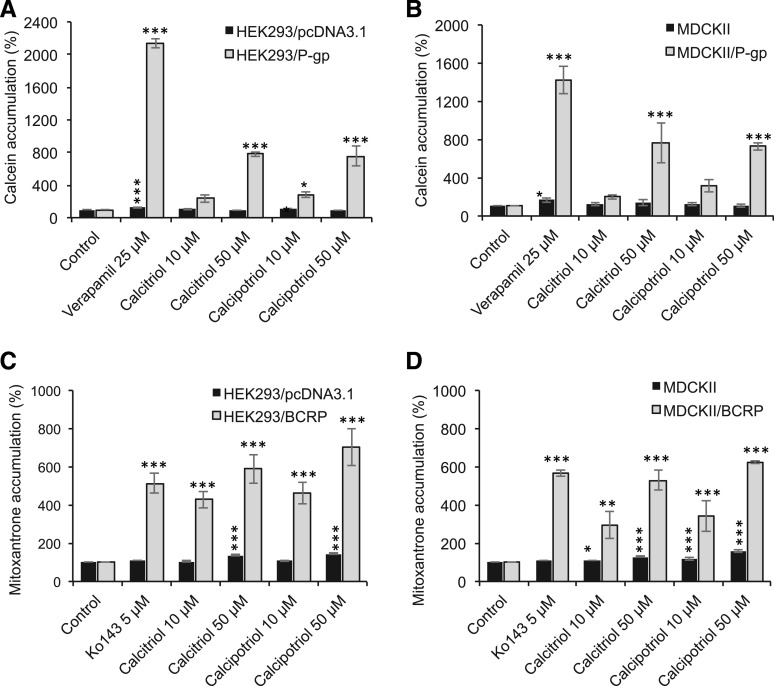
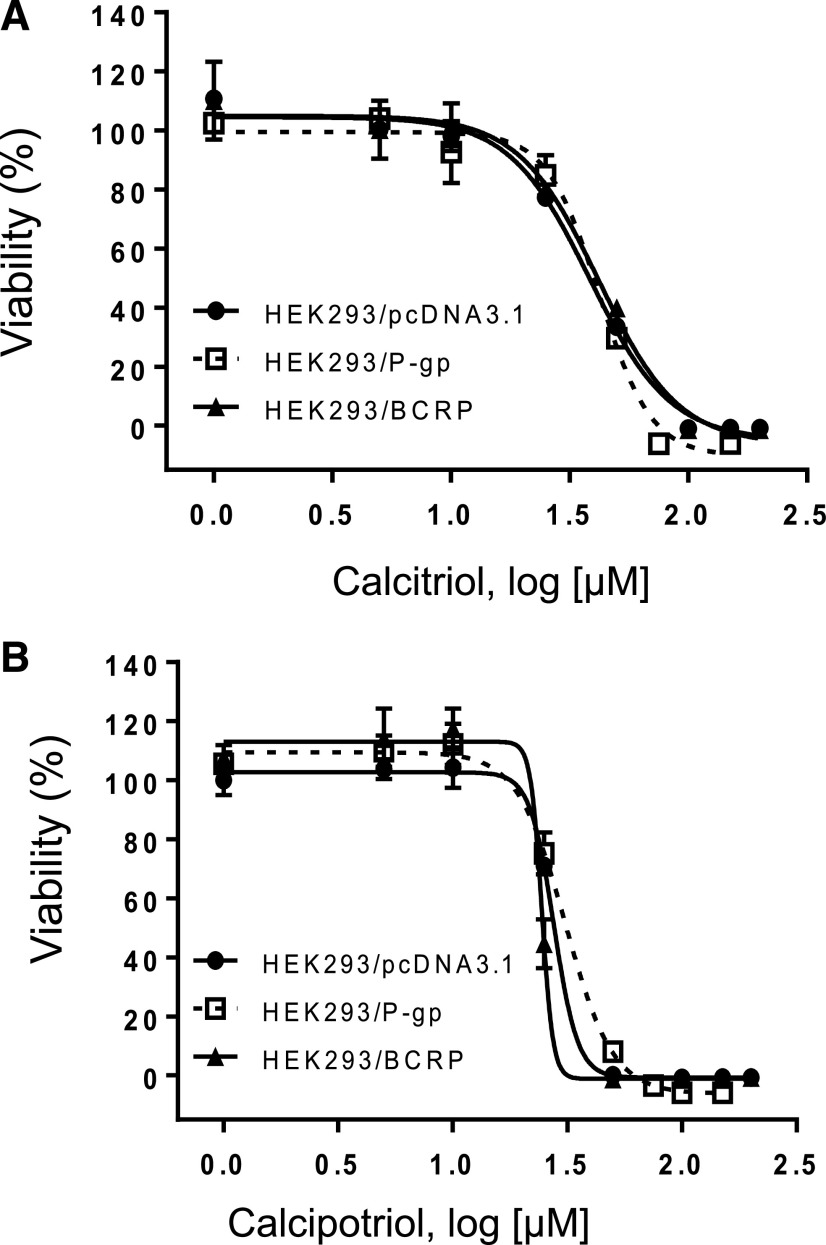
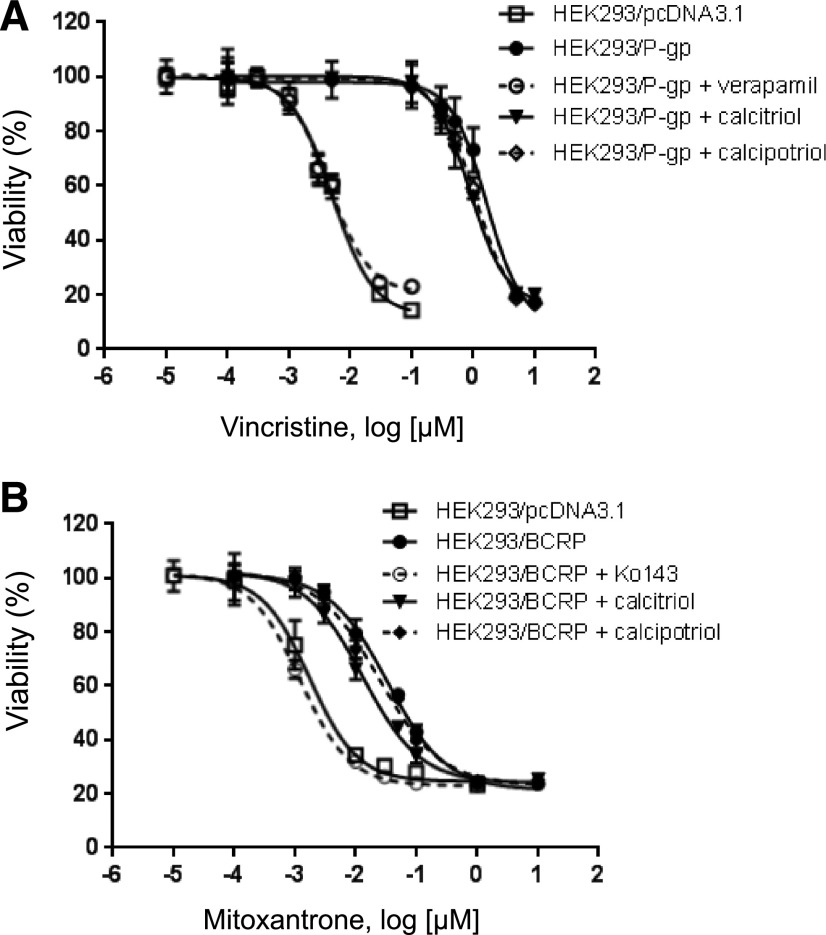
Efflux transporters P-glycoprotein (P-gp/ABCB1), multidrug resistance protein 1 (MRP1/ABCC1), and breast cancer resistance protein (BCRP/ABCG2) can affect the efficacy and toxicity of a wide variety of drugs and are implicated in multidrug resistance (MDR). Eight test compounds, recently identified from an intramolecular FRET-based high throughput screening, were characterized for their interaction with MRP1. We report that the active metabolite of vitamin D3, calcitriol, and its analog calcipotriol are selectively cytotoxic to MRP1-overexpressing cells, besides inhibiting transport function of P-gp, MRP1, and BCRP. Calcitriol and calcipotriol consistently displayed a potent inhibitory activity on MRP1-mediated doxorubicin and calcein efflux in MRP1-overexpressing H69AR and HEK293/MRP1 cells. Vesicular transport studies confirmed a strong inhibitory effect of calcitriol and calcipotriol on MRP1-mediated uptake of tritium-labeled estradiol glucuronide and leukotriene C4 In cytotoxicity assays, MRP1-overexpressing cells exhibited hypersensitivity toward calcitriol and calcipotriol. Such collateral sensitivity, however, was not observed in HEK293/P-gp and HEK293/BCRP cells, although the vitamin D3 analogs inhibited calcein efflux in P-gp-overexpressing cells, and mitoxantrone efflux in BCRP-overexpressing cells. The selective cytotoxicity of calcitriol and calpotriol toward MRP1 over-expressing cells can be eliminated with MRP1 inhibitor MK571. Our data indicate a potential role of calcitriol and its analogs in targeting malignancies in which MRP1 expression is prominent and contributes to MDR.
Copyright © 2018 by The Author(s).
Figures
Similar articles
-
Modulation of function of three ABC drug transporters, P-glycoprotein (ABCB1), mitoxantrone resistance protein (ABCG2) and multidrug resistance protein 1 (ABCC1) by tetrahydrocurcumin, a major metabolite of curcumin.Mol Cell Biochem. 2007 Feb;296(1-2):85-95. doi: 10.1007/s11010-006-9302-8. Epub 2006 Sep 8. Mol Cell Biochem. 2007. PMID: 16960658
-
Pyrrolopyrimidine derivatives and purine analogs as novel activators of Multidrug Resistance-associated Protein 1 (MRP1, ABCC1).Biochim Biophys Acta Biomembr. 2017 Jan;1859(1):69-79. doi: 10.1016/j.bbamem.2016.10.017. Epub 2016 Oct 31. Biochim Biophys Acta Biomembr. 2017. PMID: 27810353
-
5-Oxo-hexahydroquinoline derivatives as modulators of P-gp, MRP1 and BCRP transporters to overcome multidrug resistance in cancer cells.Toxicol Appl Pharmacol. 2019 Jan 1;362:136-149. doi: 10.1016/j.taap.2018.10.025. Epub 2018 Nov 2. Toxicol Appl Pharmacol. 2019. PMID: 30391378
-
ABC transporters in multidrug resistance and pharmacokinetics, and strategies for drug development.Curr Pharm Des. 2014;20(5):793-807. doi: 10.2174/138161282005140214165212. Curr Pharm Des. 2014. PMID: 23688078 Free PMC article. Review.
-
The A-B-C of small-molecule ABC transport protein modulators: From inhibition to activation-a case study of multidrug resistance-associated protein 1 (ABCC1).Med Res Rev. 2019 Nov;39(6):2031-2081. doi: 10.1002/med.21573. Epub 2019 Apr 3. Med Res Rev. 2019. PMID: 30941807 Review.
Cited by
-
MRP1-Collateral Sensitizers as a Novel Therapeutic Approach in Resistant Cancer Therapy: An In Vitro and In Vivo Study in Lung Resistant Tumor.Int J Mol Sci. 2020 May 8;21(9):3333. doi: 10.3390/ijms21093333. Int J Mol Sci. 2020. PMID: 32397184 Free PMC article.
-
Vitamin D Fortification: A Promising Approach to Overcome Drug Resistance and Tolerance in Therapeutic Interventions.Scientifica (Cairo). 2024 Nov 22;2024:9978076. doi: 10.1155/2024/9978076. eCollection 2024. Scientifica (Cairo). 2024. PMID: 39618688 Free PMC article. Review.
-
Rack1 mediates Src binding to drug transporter P-glycoprotein and modulates its activity through regulating Caveolin-1 phosphorylation in breast cancer cells.Cell Death Dis. 2019 May 21;10(6):394. doi: 10.1038/s41419-019-1633-y. Cell Death Dis. 2019. PMID: 31113938 Free PMC article.
-
Vitamin D-Induced Molecular Mechanisms to Potentiate Cancer Therapy and to Reverse Drug-Resistance in Cancer Cells.Nutrients. 2020 Jun 17;12(6):1798. doi: 10.3390/nu12061798. Nutrients. 2020. PMID: 32560347 Free PMC article. Review.
-
Advances in the structure, mechanism and targeting of chemoresistance-linked ABC transporters.Nat Rev Cancer. 2023 Nov;23(11):762-779. doi: 10.1038/s41568-023-00612-3. Epub 2023 Sep 15. Nat Rev Cancer. 2023. PMID: 37714963 Review.
References
-
- Beer TM, Ryan CW, Venner PM, Petrylak DP, Chatta GS, Ruether JD, Redfern CH, Fehrenbacher L, Saleh MN, Waterhouse DM, et al. ASCENT Investigators (2007) Double-blinded randomized study of high-dose calcitriol plus docetaxel compared with placebo plus docetaxel in androgen-independent prostate cancer: a report from the ASCENT investigators. J Clin Oncol 25:669–674. - PubMed
-
- Boonstra A, Barrat FJ, Crain C, Heath VL, Savelkoul HF, O’Garra A. (2001) 1alpha,25-Dihydroxyvitamin d3 has a direct effect on naive CD4(+) T cells to enhance the development of Th2 cells. J Immunol 167:4974–4980. - PubMed
-
- Burger H, Nooter K, Zaman GJ, Sonneveld P, van Wingerden KE, Oostrum RG, Stoter G. (1994) Expression of the multidrug resistance-associated protein (MRP) in acute and chronic leukemias. Leukemia 8:990–997. - PubMed
-
- Cole SP. (2014) Targeting multidrug resistance protein 1 (MRP1, ABCC1): past, present, and future. Annu Rev Pharmacol Toxicol 54:95–117. - PubMed
Publication types
MeSH terms
Substances
LinkOut - more resources
Full Text Sources
Other Literature Sources
Research Materials
Miscellaneous
