. 2018 Nov 12;92(23):e00881-18.
doi: 10.1128/JVI.00881-18. Print 2018 Dec 1.

Attenuation of Influenza A Virus Disease Severity by Viral Coinfection in a Mouse Model

Affiliations

Attenuation of Influenza A Virus Disease Severity by Viral Coinfection in a Mouse Model

Andres J Gonzalez et al. J Virol. .

Abstract

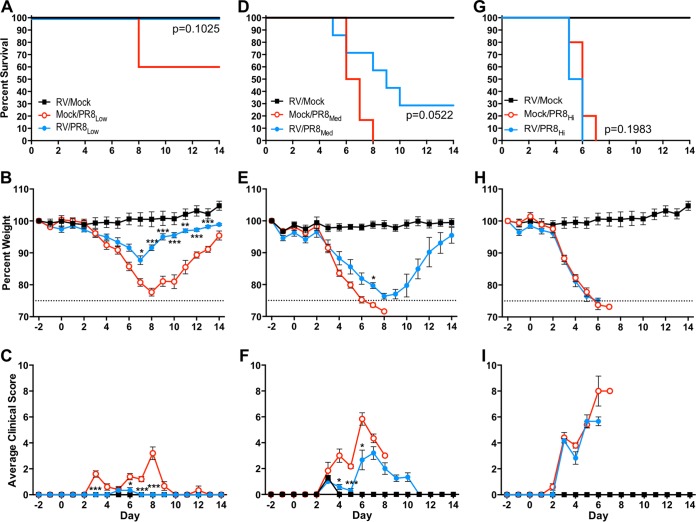
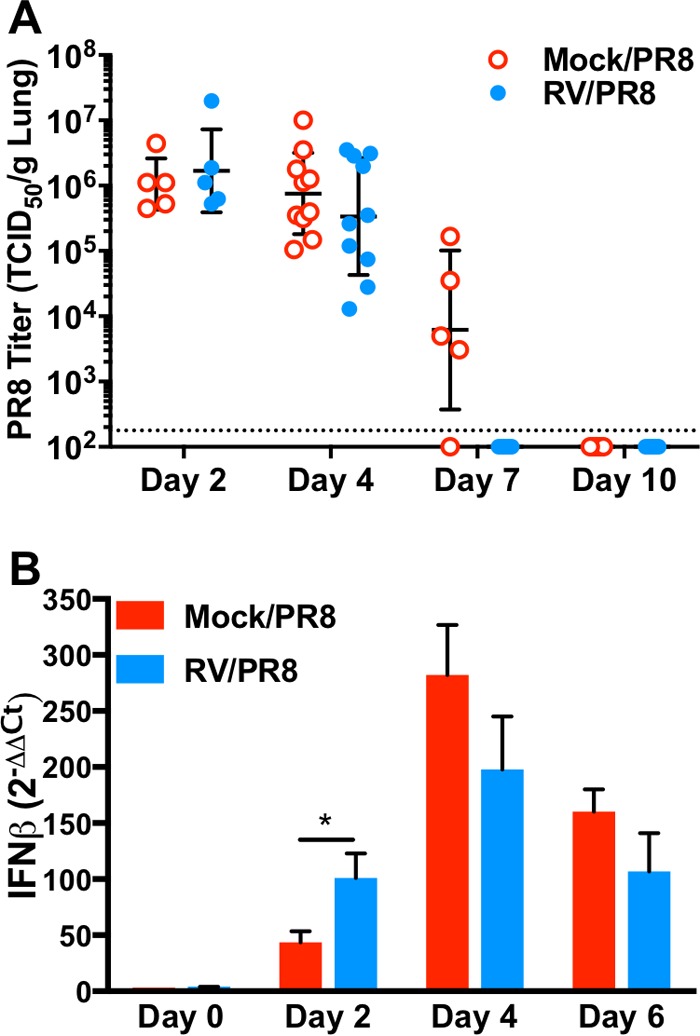
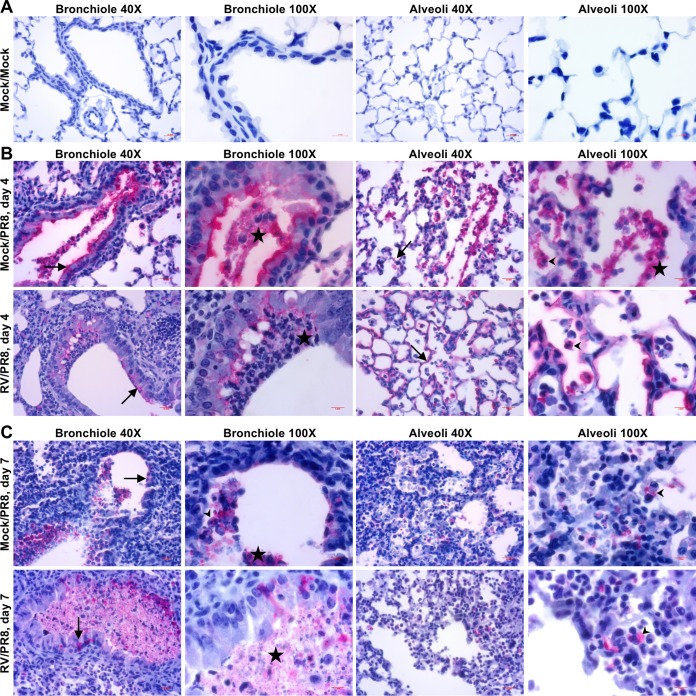
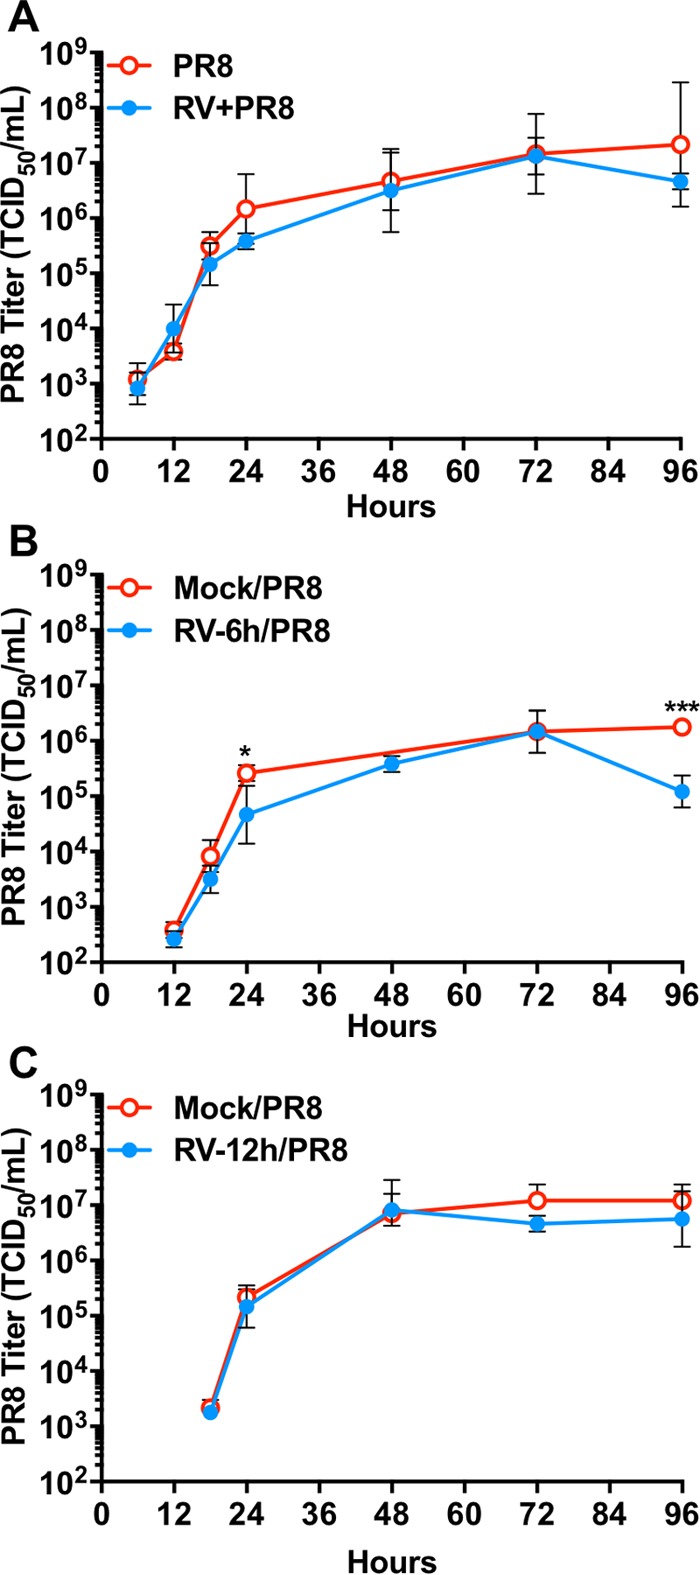
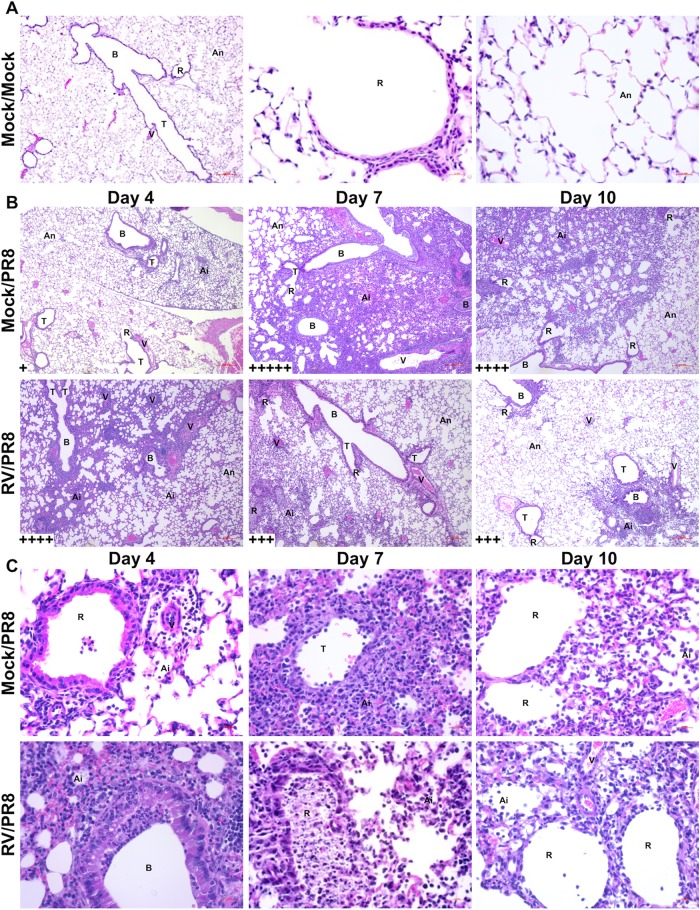
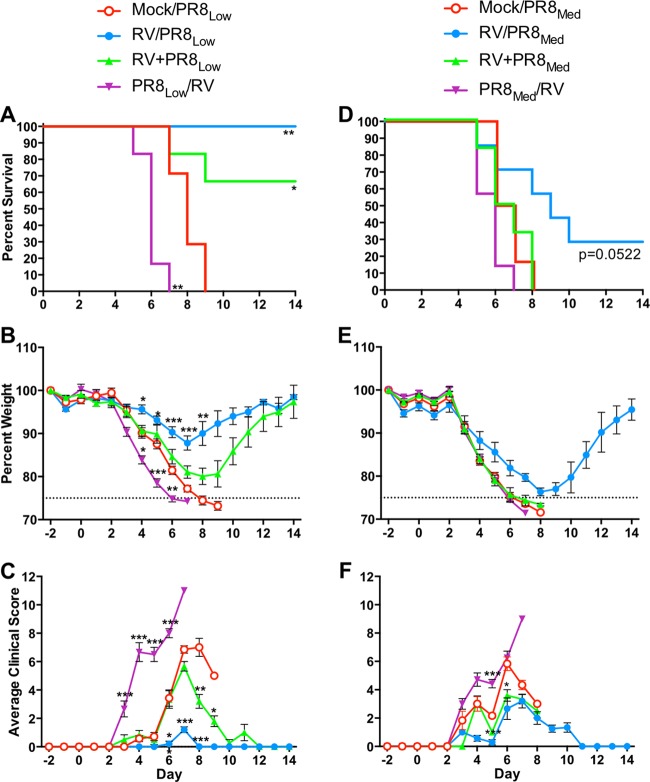
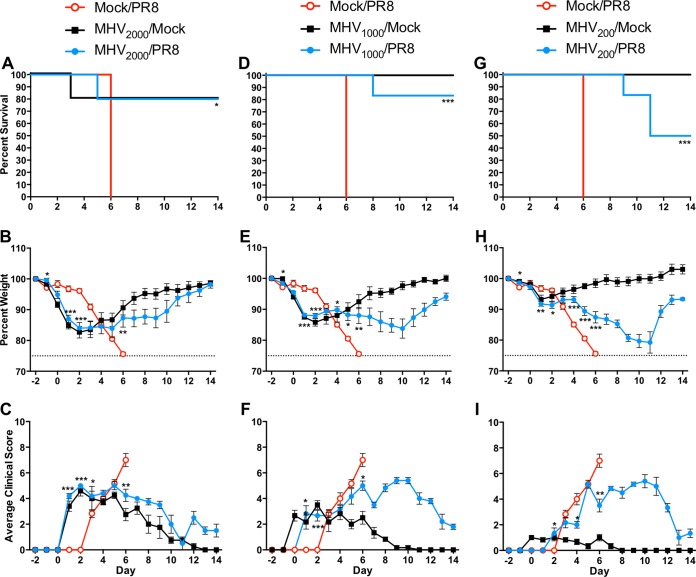
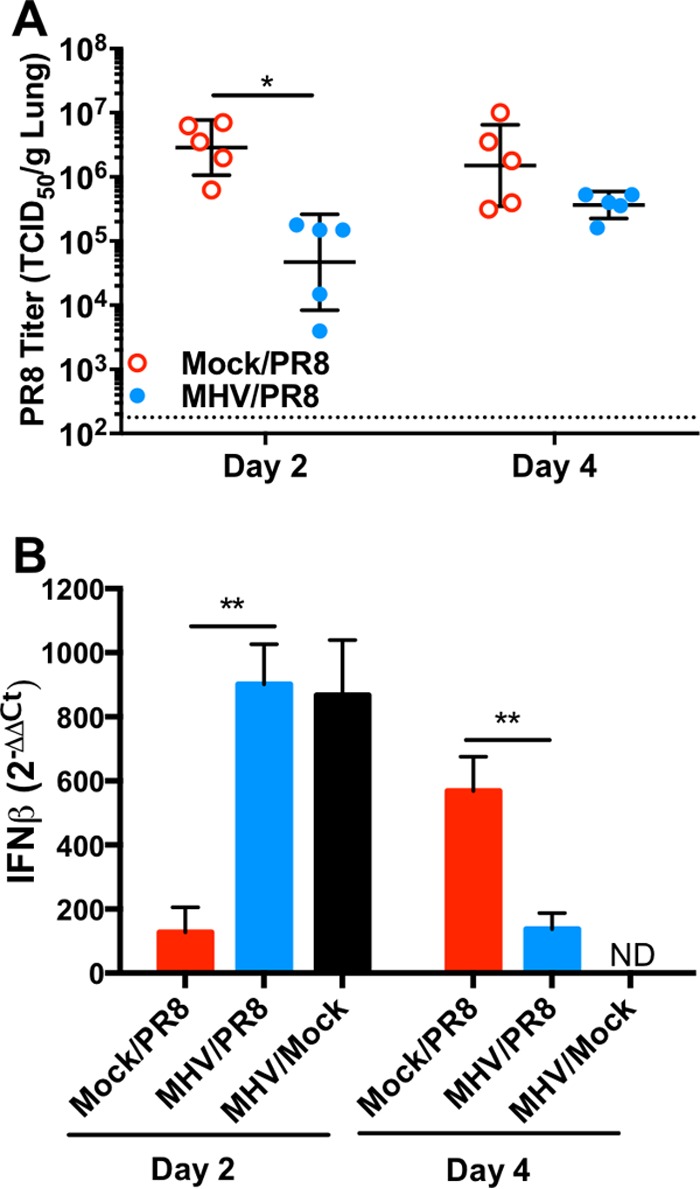
Influenza viruses and rhinoviruses are responsible for a large number of acute respiratory viral infections in human populations and are detected as copathogens within hosts. Clinical and epidemiological studies suggest that coinfection by rhinovirus and influenza virus may reduce disease severity and that they may also interfere with each other's spread within a host population. To determine how coinfection by these two unrelated respiratory viruses affects pathogenesis, we established a mouse model using a minor serogroup rhinovirus (rhinovirus strain 1B [RV1B]) and mouse-adapted influenza A virus (A/Puerto Rico/8/1934 [PR8]). Infection of mice with RV1B 2 days before PR8 reduced the severity of infection by a low or medium, but not high, dose of PR8. Disease attenuation was associated with an early inflammatory response in the lungs and enhanced clearance of PR8. However, coinfection by RV1B did not reduce PR8 viral loads early in infection or inhibit replication of PR8 within respiratory epithelia or in vitro Inflammation in coinfected mice remained focal compared to diffuse inflammation and damage in the lungs of mice infected by PR8. The timing of RV1B coinfection was a critical determinant of protection, suggesting that sufficient time is needed to induce this response. Finally, disease attenuation was not unique to RV1B: dose-dependent coinfection by a murine coronavirus (mouse hepatitis virus strain 1 [MHV-1]) also reduced the severity of PR8 infection. Unlike RV1B, coinfection with MHV-1 reduced early PR8 replication, which was associated with upregulation of beta interferon (IFN-β) expression. This model is critical for understanding the mechanisms responsible for influenza disease attenuation during coinfection by unrelated respiratory viruses.IMPORTANCE Viral infections in the respiratory tract can cause severe disease and are responsible for a majority of pediatric hospitalizations. Molecular diagnostics have revealed that approximately 20% of these patients are infected by more than one unrelated viral pathogen. To understand how viral coinfection affects disease severity, we inoculated mice with a mild viral pathogen (rhinovirus or murine coronavirus), followed 2 days later by a virulent viral pathogen (influenza A virus). This model demonstrated that rhinovirus can reduce the severity of influenza A virus, which corresponded with an early but controlled inflammatory response in the lungs and early clearance of influenza A virus. We further determined the dose and timing parameters that were important for effective disease attenuation and showed that influenza disease is also reduced by coinfection with a murine coronavirus. These findings demonstrate that coinfecting viruses can alter immune responses and pathogenesis in the respiratory tract.

Keywords: coinfection; coronavirus; immunopathogenesis; influenza; mouse model; rhinovirus.


Figures

FIG 1
FIG 1
Disease kinetics in mice infected by influenza A virus PR8 or coinfected with rhinovirus (RV) 2 days before PR8. Mice were either mock inoculated or inoculated with 7.6 × 10⁶ TCID50 units of RV on day −2. On day 0, mice were either mock inoculated or inoculated with PR8 at ∼100 (PR8Low) (A to C), ∼200 (PR8Med) (D to F), or ∼7.5 × 10³ (PR8Hi) (G to I) TCID50 units. Mice were monitored for mortality (A, D, and G), weight loss (B, E, and H), and clinical signs of disease (C, F, and I), including lethargy, ruffled fur, hunched back, and labored breathing. Clinical scores were assigned on a scale of 0 to 3 in each category, and total daily scores were averaged. Values are means ± standard errors (error bars) for five to seven mice and are representative of two independent experiments. Survival curves were compared using log rank Mantel-Cox curve comparison, and P values for Mock/PR8 versus RV/PR8 are indicated. Weight loss and clinical score data were compared using multiple Student’s t tests with Holm-Sidak multiple-comparison correction. Values for the RV/PR8 group that are significantly different from the values for the Mock/PR8 group are indicated by asterisks as follows: *, P < 0.05; **, P < 0.01; ***, P < 0.001.
FIG 2
FIG 2
Influenza A virus PR8 titers and IFN-β expression in the lungs of mice infected by PR8 or coinfected by RV 2 days before PR8. Mice were either mock inoculated or inoculated with 7.6 × 106 TCID50 units of RV on day −2. On day 0, mice were inoculated with ∼100 TCID50 units of PR8. (A) PR8 was titrated by TCID50 assay of homogenized lungs. Data for individual mice are shown with the geometric mean standard deviation indicated for each group. The dotted line indicates the limit of detection of the assay. Titers were compared between groups using a Student’s t test, which determined that they were not significantly different. (B) IFN-β expression was quantified by RT-qPCR. Threshold cycle (Ct) values were normalized to the values for GAPDH, and the fold change versus mock-inoculated mice was calculated. Mean values plus standard errors from five biological replicates are shown. Relative IFN-β levels were compared between groups using an unpaired t test, and values that are significantly different (P < 0.05) are indicated by a bar and asterisk.
FIG 3
FIG 3
Immunohistochemistry of PR8 antigen in the lungs of mice infected by influenza A virus PR8 or coinfected with RV 2 days before PR8. Images taken of the indicated regions of the lungs and at the indicated magnifications show mice given mock inoculations on days −2 and 0 (A) and mice given Mock/PR8 or RV/PR8 on day −2/day 0 (B and C). Tissue sections were immunostained for the PR8 hemagglutinin protein, which was visualized by ImmPACT Vector red, and counterstained with hematoxylin. Lung tissues were collected on day 4 (B) and day 7 (C) after PR8 inoculation. Images were representative of two sections from two animals per group and time point. Examples of antigen in epithelial cells (black arrows), antigen in leukocytes (predominantly macrophages and neutrophils) (black arrowheads), and mucopurulent material (black stars) are indicated.
FIG 4
FIG 4
Growth curves of influenza A virus PR8 from cells infected by PR8 or RV and PR8. LA-4 cells were inoculated with RV (MOI of 1) simultaneously (A) or 6 h (B) or 12 h (C) before inoculation with PR8 (MOI of 1). Media were collected at the indicated times after PR8 inoculation and titrated for PR8 by TCID50 assay. Data shown are geometric means ± standard deviations from three samples per group and time point and are representative of two replicate experiments. Values that are significantly different from the values for the Mock/PR8 group were determined by Student’s t test and are indicated by asterisks as follows: *, P < 0.05; ***, P < 0.001.
FIG 5
FIG 5
Histopathology of mouse lungs infected by influenza A virus PR8 or coinfected with RV 2 days before PR8. Mice were either mock inoculated or inoculated with 7.6 × 106 TCID50 units of RV on day −2. On day 0, mice were either mock inoculated or inoculated with ∼100 TCID50 units of PR8. Lungs were embedded in paraffin, and sections were stained with hematoxylin and eosin. Images were representative of two tissue sections from two mice per group and time point. (A) Images from lung sections of Mock/Mock-inoculated mice taken with 10× and 40× objectives. (B) Images from the indicated groups and days taken with a 10× objective. (C) Images from the indicated groups and days taken with a 40× objective. Inflammation was scored in a blind manner by estimating the percentage of inflamed area using serial imaging and ImageJ software. Sections were assigned scores based on the average percentage of inflamed area across replicates as indicated in the lower left corners of images in panel B: <20% (+), 20% to 39% (++), 40% to 59% (+++), 60% to 79% (++++), and >80% (+++++). Labeled structures include bronchioles (B), terminal bronchioles (T), respiratory bronchioles (R), normal alveoli (An), inflamed alveoli (Ai), and blood vessels (V).
FIG 6
FIG 6
Disease kinetics in mice coinfected by RV 2 days before, simultaneously with, or 2 days after PR8 infection. Groups of six or seven mice were either mock inoculated or inoculated with 7.6 × 106 TCID50 units of RV 2 days before (RV/PR8), simultaneously with (RV+PR8), or 2 days after (PR8/RV) inoculation with ∼100 (PR8Low) or ∼200 (PR8Med) TCID50 units of PR8. Mice were monitored for mortality, weight loss, and clinical signs of disease (lethargy, ruffled fur, hunched posture, and labored breathing) for 14 days after PR8 inoculation. (A to C) RV and low-dose PR8 coinfection mortality (A), weight loss (B), and clinical scores (C). (D to F) RV and medium-dose PR8 coinfection mortality (D), weight loss (E), and clinical scores (F). Survival curves were compared using log rank Mantel-Cox curve comparison. Weight loss and clinical score data were compared using multiple Student’s t tests with Holm-Sidak multiple-comparison correction. Values that are significantly different from the values for the Mock/PR8 group are indicated by asterisks as follows: *, P < 0.05; **, P < 0.01; ***, P < 0.001.
FIG 7
FIG 7
Disease kinetics in mice coinfected by MHV 2 days before influenza A virus PR8. Groups of five or six mice were either mock inoculated or inoculated with 2.0 × 103 (MHV2000), 1.0 × 103 (MHV1000), or 2.0 × 102 (MHV200) PFU of MHV 2 days before inoculation with ∼100 TCID50 units of PR8. Mice were monitored for mortality, weight loss, and clinical signs of disease (lethargy, ruffled fur, hunched posture, and labored breathing) for 14 days after PR8 inoculation. (A to C) MHV2000 and PR8 coinfection mortality (A), weight loss (B), and clinical scores (C). (D to F) MHV1000 and PR8 coinfection mortality (D), weight loss (E), and clinical scores (F). (G to I) MHV200 and PR8 coinfection mortality (G), weight loss (H), and clinical scores (I). Survival curves were compared by using log rank Mantel-Cox curve comparison. Weight loss and clinical score data were compared by multiple Student’s t tests with Holm-Sidak multiple-comparison correction. Values that are significantly different compared to the values for the Mock/PR8 group are indicated by asterisks as follows: *, P < 0.05; **, P < 0.01; *** P < 0.001.
FIG 8
FIG 8
PR8 titers and IFN-β expression in the lungs of mice infected by influenza A virus PR8 or coinfected by MHV 2 days before PR8. Mice were either mock inoculated or inoculated with 2.0 × 103 PFU of MHV on day −2. On day 0, mice were inoculated with ∼100 TCID50 units of PR8 or were mock inoculated. (A) PR8 was titrated by the TCID50 assay of homogenized lungs. Data for individual mice are shown with the geometric mean and standard deviation indicated for each group. The dotted line indicates the limit of detection of the assay. (B) IFN-β expression was quantified by RT-qPCR. Threshold cycle (Ct) values were normalized to GAPDH values, and the fold change values compared to the values for mock-inoculated mice were calculated. Mean values and standard errors from four biological replicates are shown. Values that are statistically significantly different for the Mock/PR8 and MHV/PR8 groups by an unpaired t test are indicated by asterisks as follows: *, P  < 0.05; **, P < 0.01. ND, not determined.

Similar articles

Cited by

References

    1. Brunstein JD, Cline CL, McKinney S, Thomas E. 2008. Evidence from multiplex molecular assays for complex multipathogen interactions in acute respiratory infections. J Clin Microbiol 46:97–102. doi:10.1128/JCM.01117-07. - DOI - PMC - PubMed
    1. Fairchok MP, Martin ET, Chambers S, Kuypers J, Behrens M, Braun LE, Englund JA. 2010. Epidemiology of viral respiratory tract infections in a prospective cohort of infants and toddlers attending daycare. J Clin Virol 49:16–20. doi:10.1016/j.jcv.2010.06.013. - DOI - PMC - PubMed
    1. Calvo C, García-García ML, Blanco C, Vázquez MC, Frías ME, Pérez-Breña P, Casas I. 2008. Multiple simultaneous viral infections in infants with acute respiratory tract infections in Spain. J Clin Virol 42:268–272. doi:10.1016/j.jcv.2008.03.012. - DOI - PMC - PubMed
    1. Nolan VG, Arnold SR, Bramley AM, Ampofo K, Williams DJ, Grijalva CG, Self WH, Anderson EJ, Wunderink RG, Edwards KM, Pavia AT, Jain S, McCullers JA. 2018. Etiology and impact of coinfections in children hospitalized with community-acquired pneumonia. J Infect Dis 218:179–188. doi:10.1093/infdis/jix641. - DOI - PMC - PubMed
    1. DaPalma T, Doonan BP, Trager NM, Kasman LM. 2010. A systematic approach to virus-virus interactions. Virus Res 149:1–9. doi:10.1016/j.virusres.2010.01.002. - DOI - PMC - PubMed

Publication types

MeSH terms

LinkOut - more resources