. 2018 Nov 12;92(23):e01117-18.
doi: 10.1128/JVI.01117-18. Print 2018 Dec 1.

T5 Exonuclease Hydrolysis of Hepatitis B Virus Replicative Intermediates Allows Reliable Quantification and Fast Drug Efficacy Testing of Covalently Closed Circular DNA by PCR

Affiliations

T5 Exonuclease Hydrolysis of Hepatitis B Virus Replicative Intermediates Allows Reliable Quantification and Fast Drug Efficacy Testing of Covalently Closed Circular DNA by PCR

Bingqian Qu et al. J Virol. .

Abstract

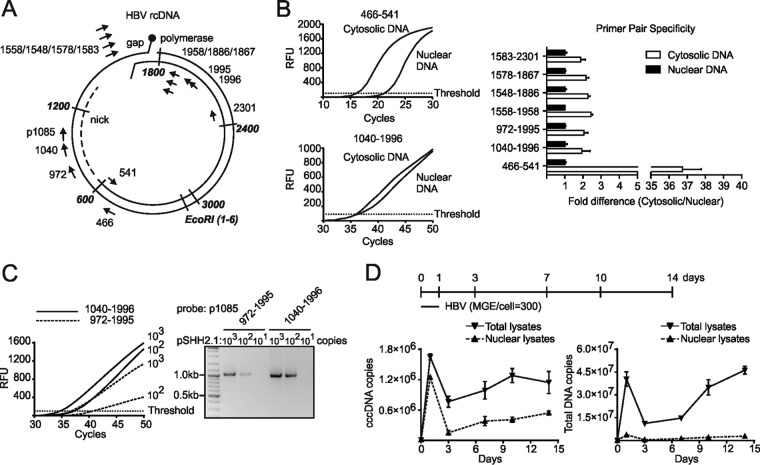
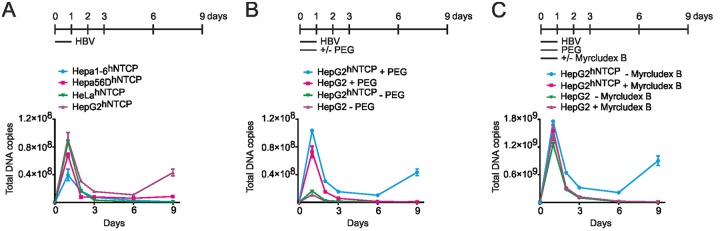
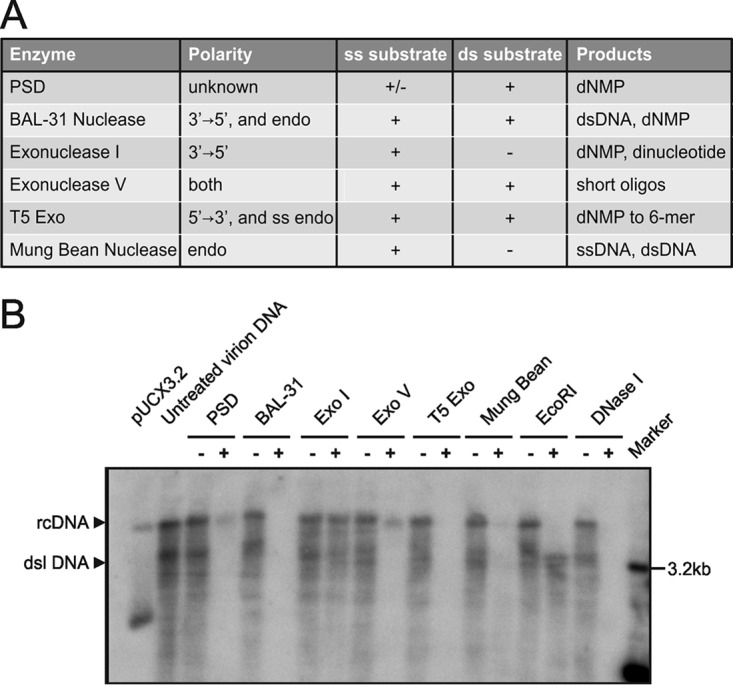
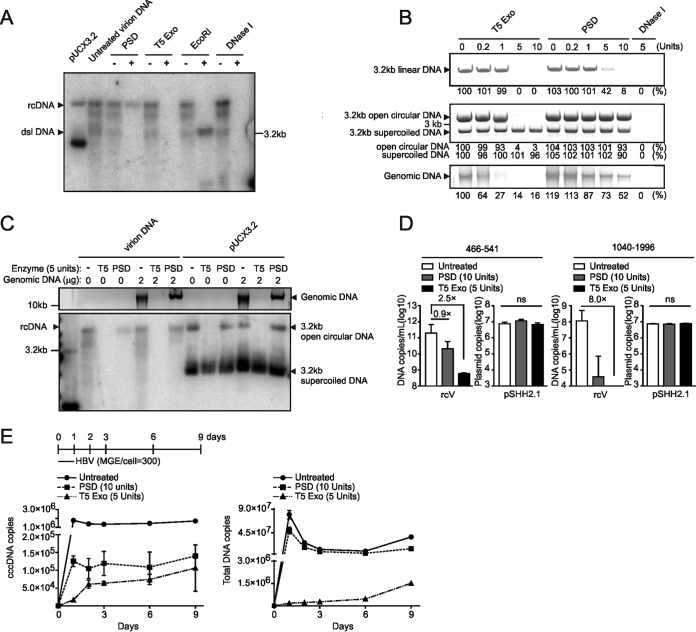
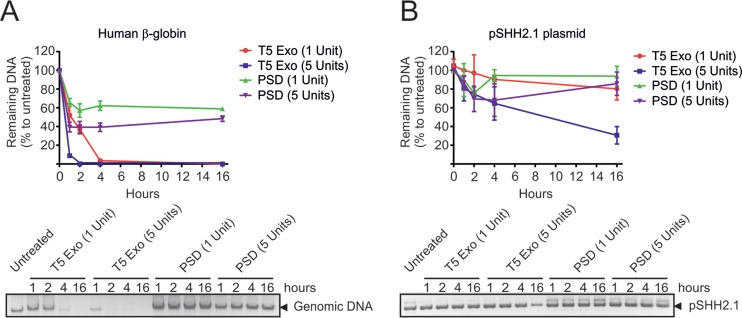
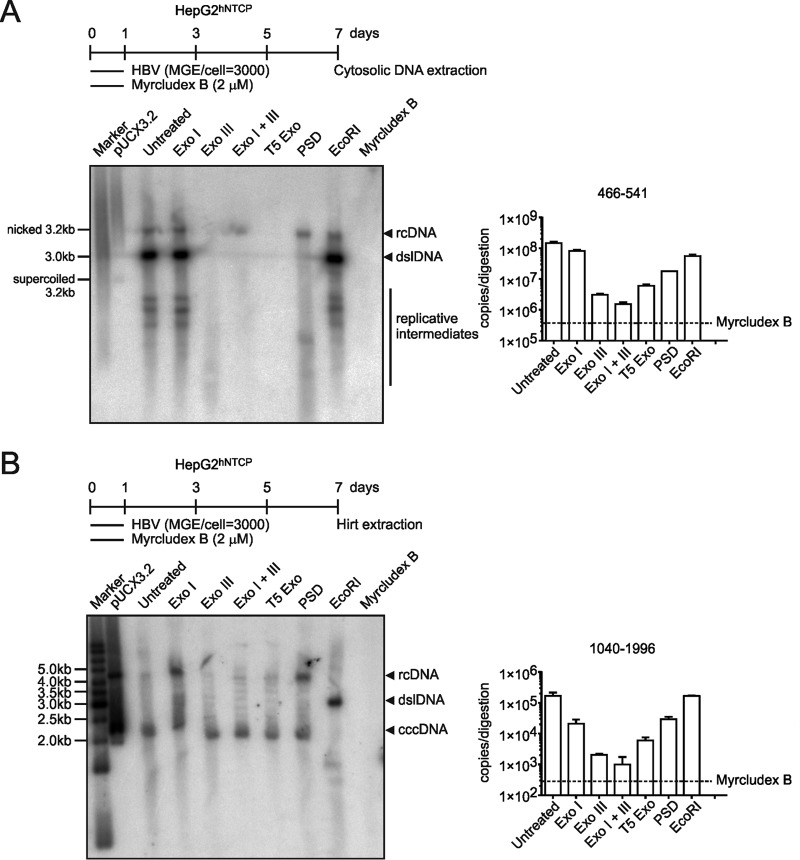
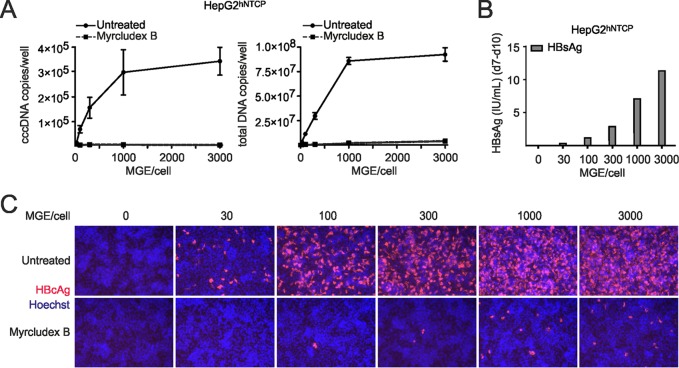
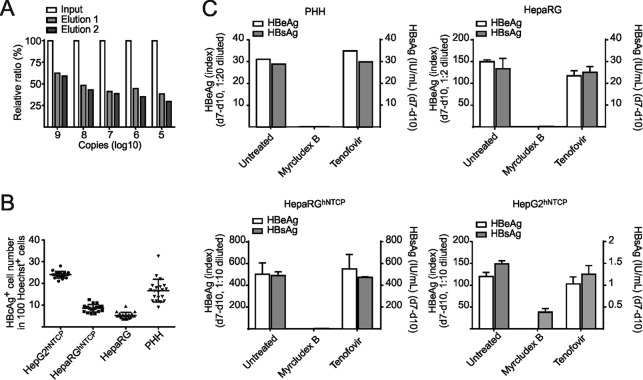
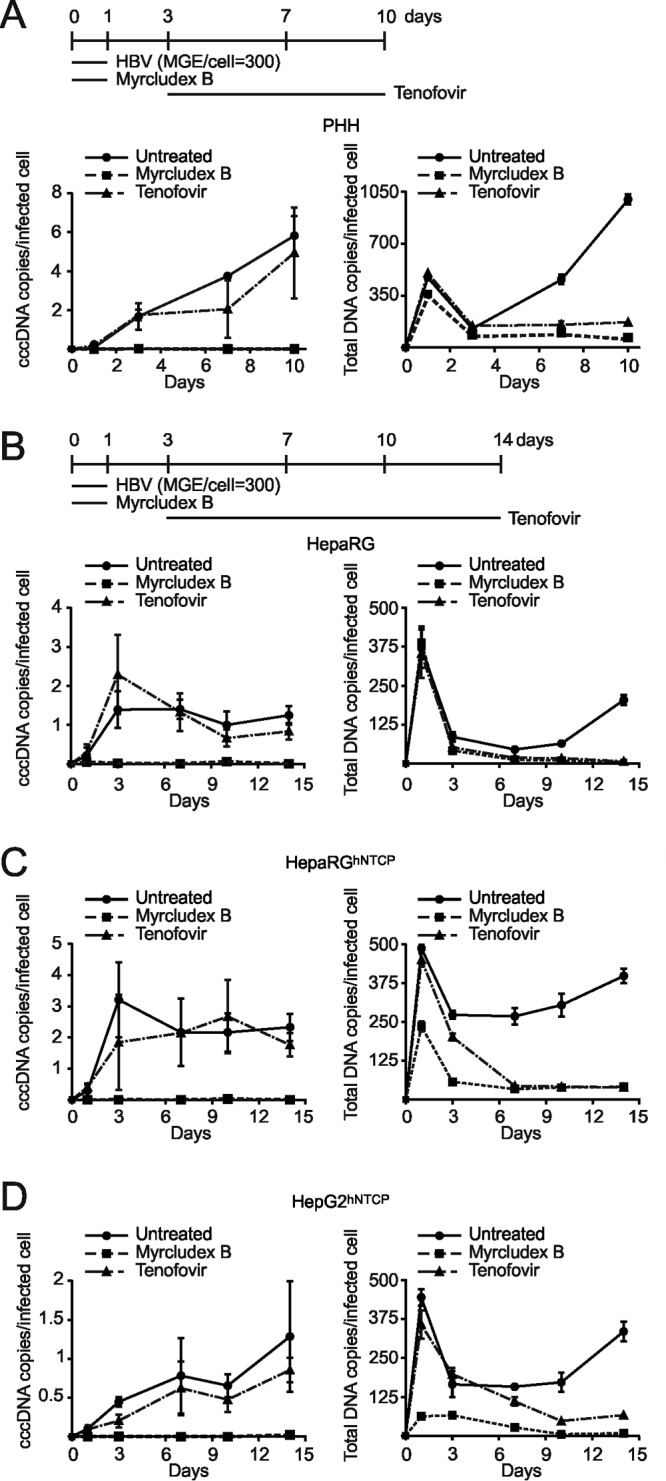
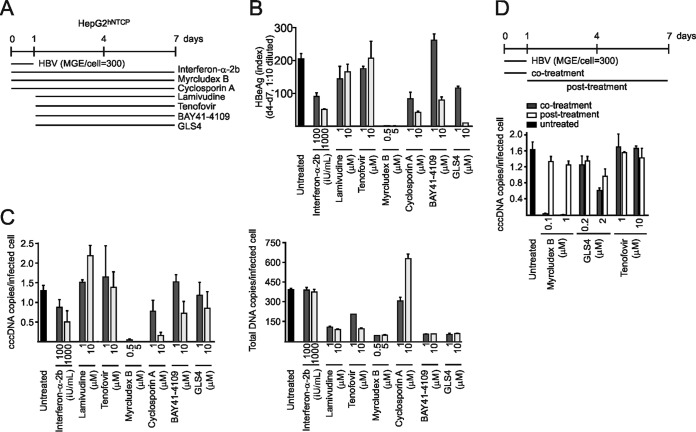
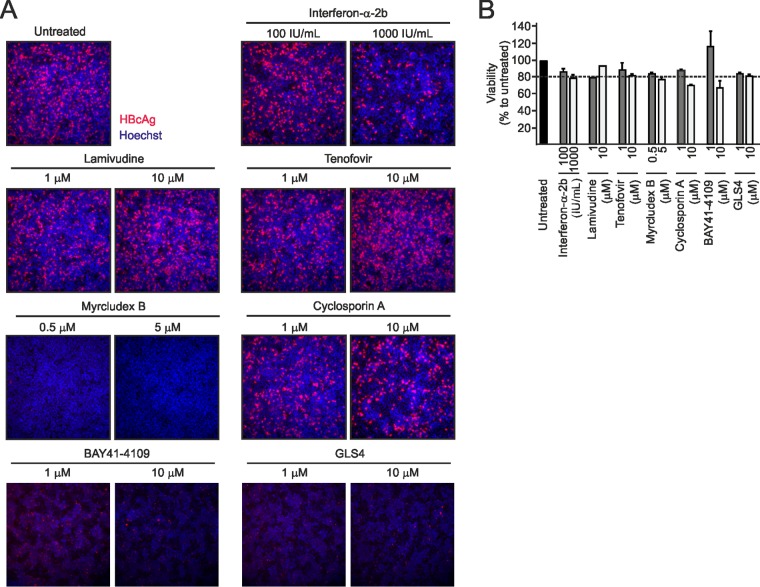
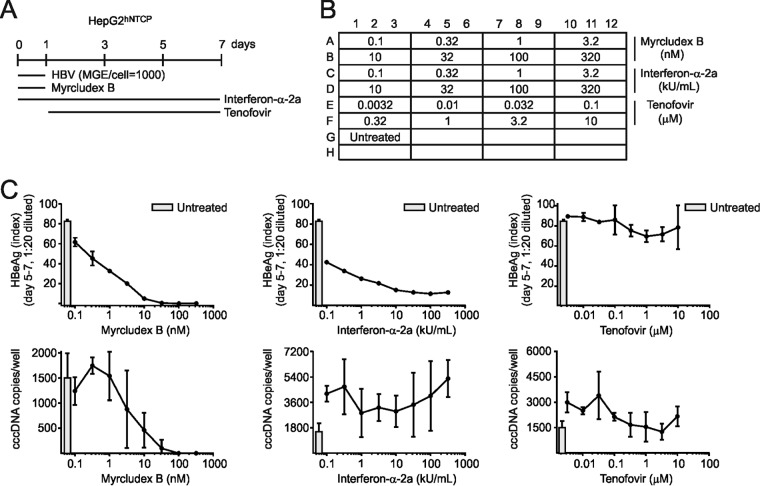
Chronic infection with the human hepatitis B virus (HBV) is a major health problem. Virus persistence requires the establishment and maintenance of covalently closed circular DNA (cccDNA), the episomal virus template in the nucleus of infected hepatocytes. Compared to replicative DNA intermediates (relaxed circular DNA [rcDNA]), copy numbers of cccDNA in infected hepatocytes are low. Accordingly, accurate analyses of cccDNA require enrichment of nuclear fractions and Southern blotting or selective quantitative PCR (qPCR) methods allowing discrimination of cccDNA and rcDNA. In this report, we analyzed cccDNA-specific primer pairs for their ability to amplify cccDNA selectively. Using mixtures of defined forms of HBV and genomic DNA, we determined the potential of different nucleases for targeted digestion of the open/relaxed circular DNA forms in the absence and presence of genomic DNA without affecting cccDNA. We found that the combination of T5 exonuclease with a primer set amplifying an approximately 1-kb fragment permits reliable quantification of cccDNA without the requirement of prior nucleus enrichment or Hirt extraction. We tested this method in four different in vitro infection systems and quantified cccDNA copy numbers at increasing multiplicities of inoculated genome equivalents. We further analyzed the kinetics of cccDNA formation and the effect of drugs (interferon, entry inhibitors, and capsid inhibitors) on cccDNA. Our method allows reliable cccDNA quantification at early stages of infection in the presence of a high excess of input virus and replicative intermediates and is thereby suitable for drug screening and investigation of cccDNA formation and maintenance.IMPORTANCE cccDNA elimination is a major goal in future curative regimens for chronic HBV patients. However, PCR-based assays for cccDNA quantification show a principally constrained specificity when high levels of input virus or replicative intermediates are present. Here, we characterized T5 exonuclease as a suitable enzyme for medium-throughput in vitro assays that preserves cccDNA but efficiently removes rcDNA prior to PCR-based quantification. We compared T5 exonuclease with the previously described exonuclease III and showed that both nucleases are suitable for reliable quantification of cccDNA by PCR. We substantiated the applicability of our method through examination of early cccDNA formation and stable accumulation in several in vitro infection models and analyzed cccDNA stability after administration of anti-HBV drugs. Our results support the use of T5 exonuclease for fast and convenient rcDNA removal, especially for early cccDNA quantification and rapid drug testing in in vitro studies.

Keywords: Myrcludex B; T5 exonuclease; cccDNA; covalently closed circular DNA; hepatitis B virus.


Figures

FIG 1
FIG 1
Excessive rcDNA provides false-positive signals when using cccDNA-specific primers for PCR amplification. (A) cccDNA pp’s (pp1040-1996 with TaqMan probe p1085) were designed to span the nick and gap region of the HBV genome. pp972-1995 was used as a control (18). Other cccDNA-specific primers (pp1558-1958, pp1548-1886, pp1578-1867, and pp1583-2301) selected from previous studies were also implemented (Table 1). Nonselective DNA primers (pp466-541) amplified all HBV DNA species. (B) Cytosolic and nuclear DNA samples from the same infected HepG2hNTCP cells were analyzed using pp’s under the respective programs in the original literature as follows: pp1040-1996, 95°C for 15 min followed by 50 cycles of 95°C for 10 s and then 63°C for 70 s; pp972-1995, 95°C for 10 min followed by 45 cycles of 95°C for 15 s, 60°C for 5 s, and 72°C for 45 s; pp1558-1958, 95°C for 10 min followed by 45 cycles of 95°C for 10 s, 58°C for 5 s, 63°C for 10 s, and 72°C for 20 s; pp1548-1886, 95°C for 10 min followed by 45 cycles of 95°C for 10 s, 62°C for 10 s, and 72°C for 20 s; pp1578-1867, 95°C for 10 min followed by 45 cycles of 95°C for 15 s, 60°C for 1 min, and 72°C for 10 s; pp1583-2301, 95°C for 5 min followed by 45 cycles of 95°C for 30 s, 62°C for 25 s, and 72°C for 45 s; pp466-541, 95°C for 10 min followed by 40 cycles of 95°C for 10 s and 60°C for 30 s. RFU, relative fluorescence units. (C) Copies (103, 102, and 101) of the pSHH2.1 plasmid template were subjected to a TaqMan reaction using pp1040-1996 or pp972-1995 with the p1085 probe. Amplification curves (left) and products (right) are shown. (D) DNA samples were collected from infected HepG2hNTCP cells at indicated times (days 1, 3, 7, 10, and 14 p.i. and day 0 without inoculum). Using pp1040-1996 and pp466-541, cccDNA (left) and total DNA copies (right) were quantified in total lysates or nuclear fractions, without any enzyme predigestion.
FIG 2
FIG 2
Early rcDNA signals are mostly caused by PEG addition in inoculum but not Myrcludex B treatment or hNTCP expression. (A) Total DNA kinetics from inoculum-incubated mouse Hepa1-6hNTCP, mouse Hepa56DhNTCP, human HeLahNTCP, and infected HepG2hNTCP cells (days 1, 2, 3, 6, and 9 p.i. and day 0 without inoculum) were determined by pp466-541. (B and C) Samples from HepG2hNTCP and HepG2 cells infected with HBV inoculum in the presence or absence of PEG (4%) (B) or Myrcludex B (1 μM) (C) during the infection were analyzed by pp466-541.
FIG 3
FIG 3
Identification of exonucleases selectively digesting rcDNA. (A) Properties of exonucleases tested in this study. +, strong activity; -, no significant activity; +/-, reduced activity; ss, single stranded; ds, double stranded; endo, endonuclease activity; dNMP, deoxyribonucleoside monophosphate; oligos, oligonucleotides. (B) Copies (3 × 108) of cell culture-derived viral DNA containing rcDNA and dslDNA were incubated for 1 h at 37°C with PSD (5 U), BAL-31 (5 U), Exo I (5 U), Exo V (5 U), and T5 Exo (5 U). Mung bean nuclease (5 U), EcoRI (5 U), and DNase I (5 U) were included as controls. After heat inactivation, the products were subjected to Southern blotting. The plasmid pUCX3.2 served as a marker for indicating the expected sizes of rcDNA and cccDNA.
FIG 4
FIG 4
T5 Exo efficiently removes rcDNA and genomic DNA from DNA preparation. (A) Copies (3 × 108) of virion DNA from purified HBV virions were incubated with PSD (5 U), T5 Exo (5 U), EcoRI (5 U), or DNase I (5 U) at 37°C for 1 h and further subjected to Southern blotting. pUCX3.2 plasmid (3.2 kb) was loaded as well to indicate the positions of rcDNA and cccDNA. (B) (Top) Two micrograms of purified 3.2-kb linear HBV monomer released from the pSHH2.1 plasmid by EcoRI digestion was incubated with indicated units of T5 Exo or PSD at 37°C for 1 h. (Middle) A mixture of 3.2-kb open circular DNA (2 μg) that was artificially nicked by Nb.BtsI endonuclease and 3.2-kb supercoiled pUCX3.2 plasmid (2 μg) was subjected to T5 Exo or PSD digestion at 37°C for 1 h. (Bottom) Two micrograms of genomic DNA from uninfected HepG2hNTCP cells was similarly treated with T5 Exo or PSD. All digestion products are shown on agarose gels, and for relative quantification, band density of untreated samples is set as 100%. (C) Copies (108) of virion DNA or pUCX3.2 plasmid were digested with T5 Exo (5 U) or PSD (5 U) in the absence (0 μg) or presence (2 μg) of genomic DNA (as shown above; 1% agarose gel) at 37°C for 1 h, and the products were loaded for Southern blotting (bottom). (D) Virion DNA (rcV) or pSHH2.1 plasmid was incubated with T5 Exo (5 U) or PSD (10 U) at 37°C for 1 h, and products were further analyzed by pp466-541 (left) or pp1040-1996 (right), respectively. ns, no significance. (E) Total DNA samples from HBV-infected HepG2hNTCP cells (days 1, 2, 3, 6, and 9 p.i. and day 0 without inocula) were incubated with T5 Exo (5 U) or PSD (10 U) as described above, and cccDNA (left) and total DNA (right) copies were quantified by respective primers.
FIG 5
FIG 5
Titration analysis of T5 Exo and PSD. (A) Two micrograms of genomic DNA samples from HBV-free HepG2hNTCP cells was incubated with T5 Exo or PSD in time-dependent (1, 2, 4, and 16 h) and dose-dependent (1 and 5 U) manners. After digestion, products were visualized on an agarose gel, and the expression level of the human β-globin gene was measured as a representative readout to show digestion degree of genomic DNA. (B) Two micrograms of pSHH2.1 plasmid was incubated with T5 Exo or PSD similarly, and the remaining plasmid in products was determined by pp466-541 or directly visualized on an agarose gel.
FIG 6
FIG 6
T5 Exo and Exo III remove HBV replicative intermediates without affecting cccDNA. HepG2hNTCP cells were seeded in a 6-well plate and infected at an mge/cell of 3,000. To block entry, Myrcludex B (2 μM) was used as a control. (A) On day 7 p.i., cytosolic DNA samples were extracted as described in Materials and Methods and hydrolyzed by Exo I (5 U, 60 min), Exo III (25 U, 60 min), Exo I and III (5 U plus 25 U, 60 min), T5 Exo (5 U, 60 min), PSD (10 U, 60 min), and EcoRI (10 U, 60 min) at 37°C for 1 h, and later on, all enzymes were heat denatured at 70°C. Samples were analyzed by Southern blotting (left) and PCR with pp466-541 (right). (B) HepG2hNTCP cells were infected in a 6-well plate format for 7 days, and the DNA samples were Hirt extracted and hydrolyzed by the respective enzymes prior to Southern blotting (left) and cccDNA-specific PCR using pp1040-1996 (right).
FIG 7
FIG 7
cccDNA profiles in infections with increasing mge. (A) HepG2hNTCP cells were infected with different amounts of virus inoculum (mge/cell of 30, 100, 300, 1,000, and 3,000) in parallel, and total DNA samples were prepared on day 10 p.i. Samples were hydrolyzed by T5 Exo (5 U, 60 min) at 37°C for 1 h, and cccDNA was determined using pp1040-1996. Total DNA copy numbers were also determined in undigested samples using pp466-541. (B) Within the same infections, secreted HBsAg values from day 7 to 10 p.i. were detected. (C) On day 10 p.i., intracellular HBcAg expression levels (red) were visualized. As a control to verify NTCP-mediated entry of the virus, Myrcludex B (1 μM) was administered during the infection.
FIG 8
FIG 8
Elution efficacy in DNA extraction and infectivity in in vitro-infected hepatocytes. (A) Elution efficiency reflecting the in-column loss during DNA extraction was calculated by coloading a series of the diluted pSHH2.1 plasmid with HBV-free genomic carrier DNA onto columns. Eluted DNA (percentage of input) was quantified by pp466-541. (B) Infectivity ratios (day 7 p.i., mge/cell of 300) in indicated cultures were determined by counting HBcAg-positive and Hoechst stain-positive cell numbers from 20 independent views under microscopy. (C) Correlated with Fig. 9, productive infection in all in vitro infections was validated by detecting secreted HBeAg and HBsAg values during days 7 to 10 p.i.
FIG 9
FIG 9
Comparability of cccDNA formation and accumulation in different in vitro infection systems. In vitro infections with a moderate mge (mge/cell of 300) were performed in PHH (A), differentiated HepaRG cells (B), differentiated HepaRGhNTCP cells (C), and HepG2hNTCP cells (D). Myrcludex B (1 μM) and tenofovir (15 μM) were implemented as controls as shown in the timelines. For PHH, total DNA was extracted on days 1, 3, 7, and 10 p.i.; for the other cell lines, samples were collected until day 14 p.i. To measure the respective infection rates, cell counting of HBcAg-positive cells was performed (Fig. 8B). Undigested DNA samples were directly used for total HBV DNA as well as human β-globin quantification. T5 Exo treatment (37°C, 5 U, 60 min) was performed prior to cccDNA quantification. cccDNA copy number was normalized by a factor that was derived from β-globin level to eliminate variation from inputs and further calculated as number of cccDNA copies/cell. Finally, the value of cccDNA copies per infected cell was determined by using number of cccDNA copies/cell to divide elution ratio and infectivity ratio (Fig. 8).
FIG 10
FIG 10
Effect of antiviral drugs on cccDNA establishment and maintenance. (A) IFN-α-2b, the entry inhibitor Myrcludex B, and cyclosporine (which shows entry inhibition activity through NTCP binding) were coadministered with HBV inocula to initiate infection in HepG2hNTCP cells. The drugs were maintained in cell culture medium for 1 week. Lamivudine, tenofovir, BAY41-4109, and GLS4 were added from days 1 to 7 p.i. (B and C) Secreted HBeAg values (B) and calculated cccDNA (left) and total DNA copies (right) (C) per infected HepG2hNTCP cell are shown. (D) Myrcludex B, GLS4, and tenofovir were coadministered during infection (cotreatment) or from days 1 to 7 p.i. (posttreatment). cccDNA expression levels were measured on day 7.
FIG 11
FIG 11
Effect of antiviral drugs on HBcAg expression. (A) Correlated with Fig. 10, infected HepG2hNTCP cells were treated with IFN-α-2b (100 or 1,000 IU/ml), lamivudine (1 or 10 μM), tenofovir (1 or 10 μM), Myrcludex B (0.5 or 5 μM), and cyclosporine (1 or 10 μM) for 1 week. Cells were fixed, and HBcAg staining was performed by an IF assay. Hoechst dye indicates nuclei. (B) Cell viability in Fig. 10 is shown here. Viability, survival ratio (percent) compared to the untreated cells (100%). Dashed line, 80%.
FIG 12
FIG 12
Detection of cccDNA and validation of Myrcludex B in 96-well plate format. (A) HepG2hNTCP cells seeded in a 96-well plate were infected at an mge/cell of 1,000. Myrcludex B was coadministered, tenofovir was added postinoculation, and IFN-α-2a was applied during and after infection. (B) Cells were treated with each antiviral at eight doses (1:3.2 serial dilutions) in triplicates. (C) On day 7 p.i., DNA samples were extracted together using a vacuum-based system. Crude DNA in 100 μl of elute was ethanol precipitated and resuspended with 10 μl of water. T5 Exo digestion was performed prior to cccDNA quantification by PCR. HBeAg levels during days 5 to 7 p.i. in the supernatant in all wells were measured.

Similar articles

Cited by

References

    1. Trepo C, Chan HL, Lok A. 2014. Hepatitis B virus infection. Lancet 384:2053–2063. doi:10.1016/S0140-6736(14)60220-8. - DOI - PubMed
    1. Wong GL, Wong VW. 2016. Eliminating hepatitis B virus as a global health threat. Lancet Infect Dis 16:1313–1314. doi:10.1016/S1473-3099(16)30214-6. - DOI - PubMed
    1. Nelson NP, Easterbrook PJ, McMahon BJ. 2016. Epidemiology of hepatitis B virus infection and impact of vaccination on disease. Clin Liver Dis 20:607–628. doi:10.1016/j.cld.2016.06.006. - DOI - PMC - PubMed
    1. Lai CL, Yuen MF. 2013. Prevention of hepatitis B virus-related hepatocellular carcinoma with antiviral therapy. Hepatology 57:399–408. doi:10.1002/hep.25937. - DOI - PubMed
    1. Schinazi RF, Asselah T. 2017. From HCV to HBV cure. Liver Int 37:73–80. doi:10.1111/liv.13324. - DOI - PMC - PubMed

Publication types

MeSH terms

LinkOut - more resources