. 2018 Nov 12;92(23):e01179-18.
doi: 10.1128/JVI.01179-18. Print 2018 Dec 1.

Host Enzymes Heparanase and Cathepsin L Promote Herpes Simplex Virus 2 Release from Cells

Affiliations

Host Enzymes Heparanase and Cathepsin L Promote Herpes Simplex Virus 2 Release from Cells

James Hopkins et al. J Virol. .

Abstract

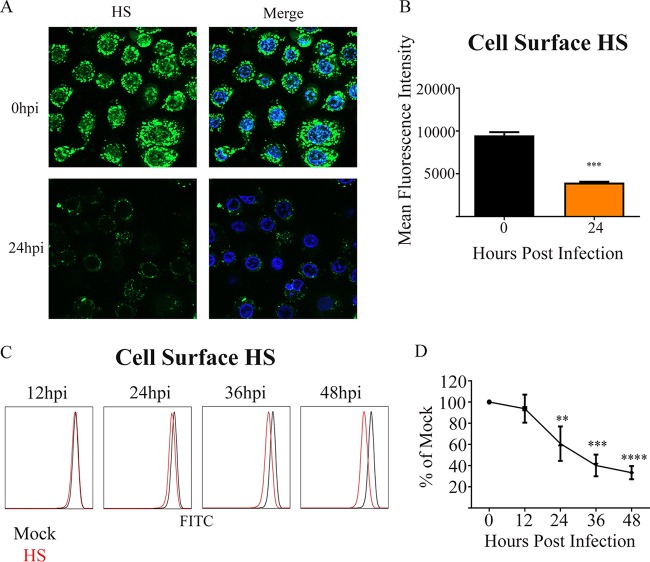
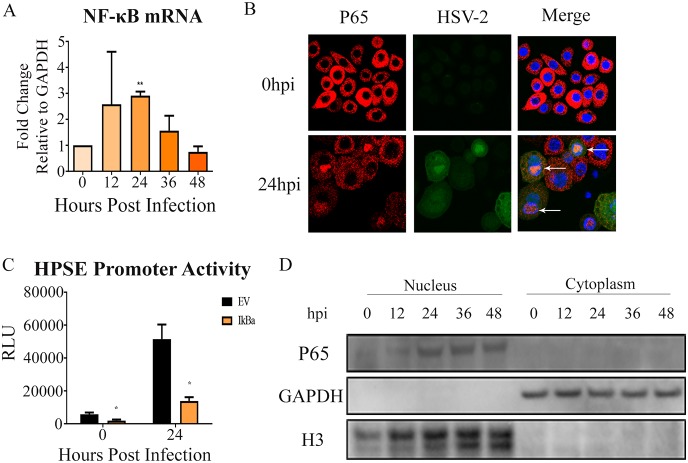
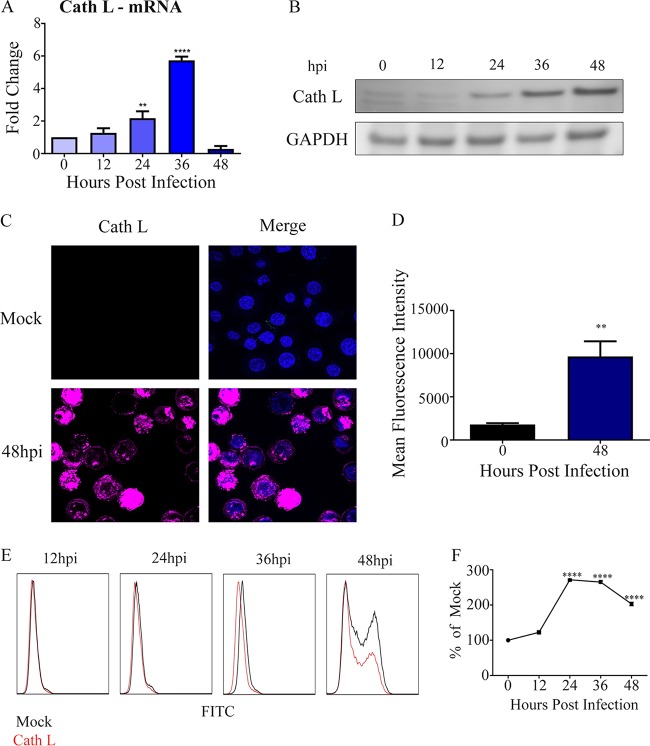
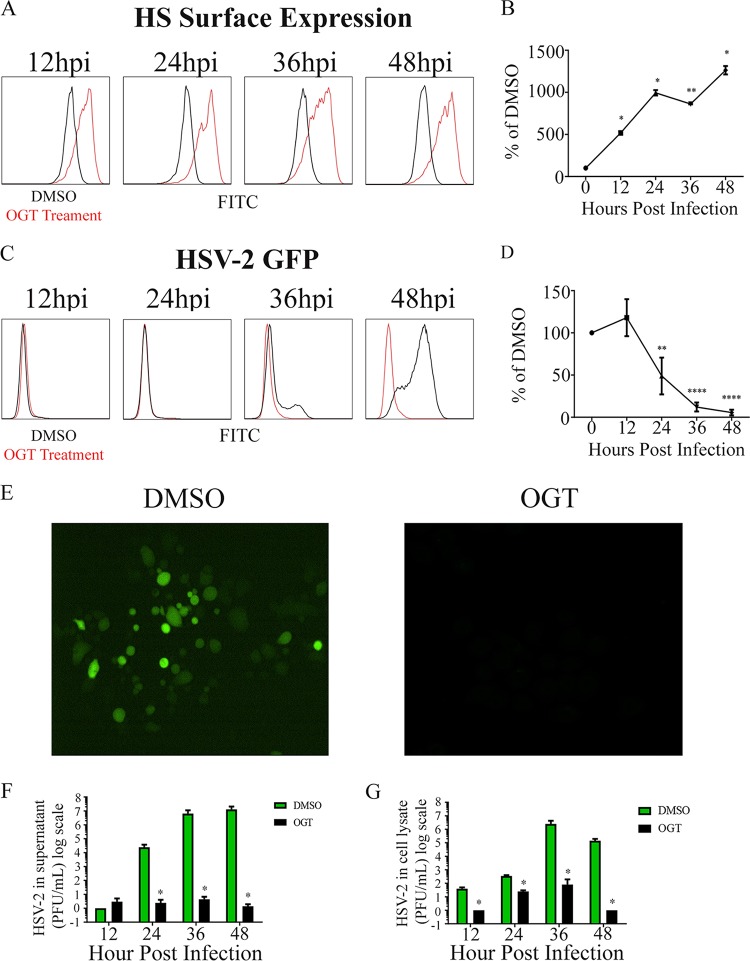
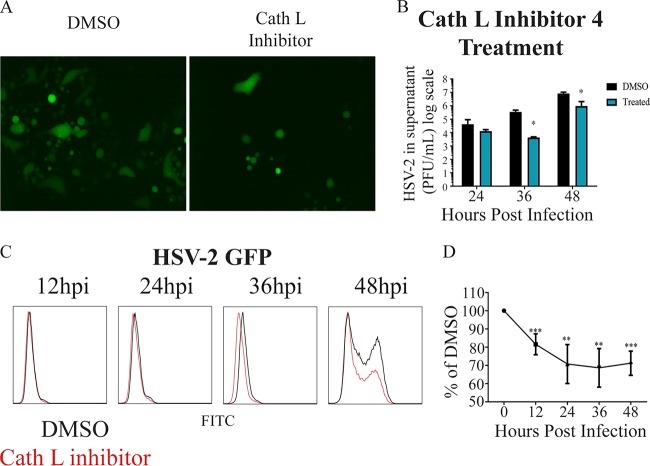
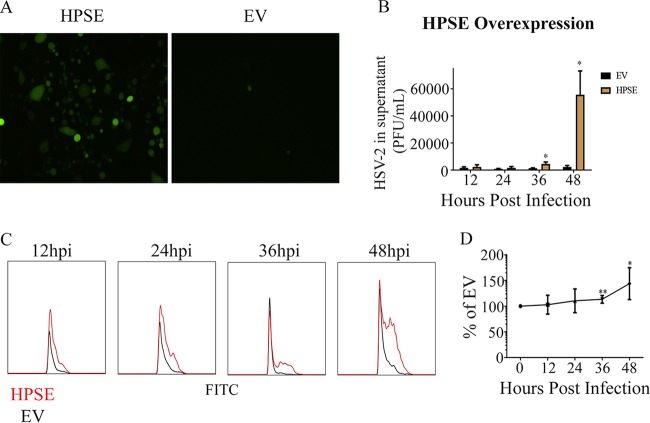
Herpes simplex virus 2 (HSV-2) can productively infect many different cell types of human and nonhuman origin. Here we demonstrate interconnected roles for two host enzymes, heparanase (HPSE) and cathepsin L, in HSV-2 release from cells. In vaginal epithelial cells, HSV-2 causes heparan sulfate shedding and upregulation in HPSE levels during the productive phase of infection. We also noted increased levels of cathepsin L and show that regulation of HPSE by cathepsin L via cleavage of HPSE proenzyme is important for infection. Furthermore, inhibition of HPSE by a specific inhibitor, OGT 2115, dramatically reduces HSV-2 release from vaginal epithelial cells. Likewise, we show evidence that the inhibition of cathepsin L is detrimental to the infection. The HPSE increase after infection is mediated by an increased NF-κB nuclear localization and a resultant activation of HPSE transcription. Together these mechanisms contribute to the removal of heparan sulfate from the cell surface and thus facilitate virus release from cells.IMPORTANCE Genital infections by HSV-2 represent one of the most common sexually transmitted viral infections. The virus causes painful lesions and sores around the genitals or rectum. Intermittent release of the virus from infected tissues during sexual activities is the most common cause of transmission. At the molecular level, cell surface heparan sulfate (HS) is known to provide attachment sites for HSV-2. While the removal of HS during HSV-1 release has been shown, not much is known about the host factors and their regulators that contribute to HSV-2 release from natural target cell types. Here we suggest a role for the host enzyme heparanase in HSV-2 release. Our work reveals that in addition to the regulation of transcription by NF-κB, HPSE is also regulated posttranslationally by cathepsin L and that inhibition of heparanase activity directly affects HSV-2 release. We provide unique insights into the host mechanisms controlling HSV-2 egress and spread.

Keywords: HSV-2; heparanase; viral egress.


Figures

FIG 1
FIG 1
Loss of cell surface HS during infection. (A) Representative immunofluorescent images of HS stain. HSV-2 333 was used to infect cells at an MOI of 1 for 24 h. The upper left shows HS stain only in an uninfected sample, the upper right shows Hoechst and HS stains merged for an uninfected sample, the lower left shows HS stain only for an infected sample at 24 hpi, and the lower right shows Hoechst and HS stains merged for an infected sample at 24 hpi. (B) Quantification of HS cell surface expression. (C) Representative flow cytometry histogram showing change in cell surface HS expression, with red representing infected samples and black representing the uninfected control. (D) Quantification of cell surface HS flow cytometry experiments.
FIG 2
FIG 2
HPSE is upregulated after HSV-2 infection. (A) Increase in promoter activity of HPSE gene upon infection in HCE cells. HSV-2 333 was used to infect cells at an MOI of 1 for 12, 24, 36, and 48 h. Shown is the average fold increase over the uninfected control. Experimental values are normalized to those obtained with pGL3 as a control for transfection efficiency. (B) Increase in HPSE mRNA levels. Shown is the average fold increase over that at 0 h postinfection. GAPDH, glyceraldehyde-3-phosphate dehydrogenase. (C) Representative immunofluorescence microscopy images of cell surface HPSE stain. HSV-2 333 was used to infect cells at an MOI of 1 for 24 h. The upper left shows HPSE stain only in an uninfected sample, the upper right shows Hoechst and HPSE stains merged for an uninfected sample, the lower left shows HPSE stain only for an infected sample at 24 hpi, and the lower right shows Hoechst and HPSE stains merged for an infected sample at 24 hpi. (D) Quantification of HPSE cell surface expression from multiple immunofluorescent images. (E) Representative flow cytometry histogram showing change in cell surface HPSE expression, with red representing infected samples and black representing the uninfected control. (F) Quantification of cell surface HPSE flow cytometry experiments compared to that at 0 h postinfection.
FIG 3
FIG 3
NF-κB as a mechanism for HPSE upregulation. (A) Increase in NF-κB (p65) mRNA levels. Shown is the average fold increase over the uninfected control. (B) Representative immunofluorescence microscopy images of nuclear translocation of p65 upon infection with HSV-2 333 GFP, with NF-κB P65 labeled red, HSV-2 green, and the nucleus blue. (C) Inhibition of NF-κB activation results in decreased HPSE promoter activity. VK2 cells were transfected with mutant IkBa incapable of degradation (S32A/S36A), thereby specifically inhibiting NF-κB activation and nuclear translocation. Twenty-four hours after transfection, cells were infected with HSV-2 333 for 24 h at an MOI of 1. Cell lysates were isolated, and a luciferase assay was performed. Results are normalized to those with empty pGL3 vector (EV) as a control for transfection efficiency. (D) Representative Western blot of nuclear translocation of p65 upon HSV-2 infection with HSV-2 333.
FIG 4
FIG 4
Cathepsin L (Cath L) as a mechanism of HPSE activation (A) Increase in cathepsin L mRNA levels. Shown is the average fold increase over that at 0 h. (B) Representative Western blot showing increase of cathepsin L over time after infection with HSV-2 333 at an MOI of 1. (C) Representative immunofluorescence microscopy images of cathepsin L stain. HSV-2 333 was used to infect cells at an MOI of 1 for 24 h. The upper left shows cathepsin L stain only in an uninfected sample, the upper right shows Hoechst and cathepsin L stains merged for an uninfected sample, the lower left shows cathepsin L stain only for an infected sample at 24 hpi, and the lower right shows Hoechst and cathepsin L stains merged for an infected sample at 48 hpi. (D) Quantification of total cathepsin L expression from multiple immunofluorescent images. (E) Representative flow cytometry histogram showing change in cathepsin L expression, with red representing infected samples and black representing an uninfected control. (F) Quantification of cathepsin L flow cytometry experiments.
FIG 5
FIG 5
Effect of inhibition of HPSE on HSV-2 infection. (A) Representative flow cytometry histogram showing change in cell surface HS expression, with red representing OGT 2115 treatment and black representing DMSO treatment. Both samples were infected with HSV-2 333 at an MOI of 1. (B) Quantification of results of cell surface HS OGT flow cytometry experiments. (C) Representative flow cytometry histogram showing change in infection following OGT treatment, with red representing OGT 2115 treatment and black representing DMSO treatment. Both samples were infected with HSV-2 333 GFP. (D) Quantification of infection after treatment with OGT flow cytometry experiments. (E) Representative immunofluorescence microscopy images taken 24 h after infection with HSV-2 333 GFP after treatment with OGT or DMSO, with green representing infected cells. (F) Average change in virus released from cells with and without OGT treatment every 12 h up to 48 h. (G) Average change in virus from cell lysate with and without OGT treatment every 12 h up to 48 h.
FIG 6
FIG 6
Effect of inhibition of cathepsin L on HSV-2 infection. (A) Representative immunofluorescence microscopy images taken 24 h after infection with HSV-2 333 GFP after treatment with cathepsin L inhibitor IV or DMSO, with green representing infected cells. (B) Average change in virus released from cells with and without cathepsin L inhibitor IV treatment every 12 h up to 48 h. (C) Representative flow cytometry histogram showing change in infection after cathepsin L inhibitor IV treatment, with red representing cathepsin L inhibitor IV treatment and black representing DMSO treatment. Both samples were infected with HSV-2 333 GFP. (D) Quantification of infection after treatment with cathepsin L inhibitor IV flow cytometry experiments.
FIG 7
FIG 7
Effect of overexpression of HPSE during HSV-2 infection. (A) Representative immunofluorescence microscopy images taken 24 h after infection with HSV-2 333 GFP after overexpression of HPSE, with green representing infected cells. (B) Average change in virus released from cells overexpressing HPSE and infected with HSV-2 333 every 12 h up to 48 h. (C) Representative flow cytometry histogram showing change in newly infected cells after overexpression of HPSE, with red representing HPSE overexpression and black representing EV. Both samples were infected with HSV-2 333 GFP. (D) Quantification of infection after overexpression of HPSE flow cytometry experiments.

Similar articles

Cited by

References

    1. Xu F, Sternberg MR, Gottlieb SL, Berman SM, Markowitz LE, Forhan SE, Taylor LD. 2010. Seroprevalence of herpes simplex virus type 2 among persons aged 14–49 years—United States, 2005–2008. MMWR Morb Mortal Wkly Rep 59:456–459. - PubMed
    1. Kinghorn GR. 1993. Genital herpes: natural history and treatment of acute episodes. J Med Virol 1:33–38. - PubMed
    1. Scoular A, Norrie J, Gillespie G, Mir N, Carman WF. 2002. Longitudinal study of genital infection by herpes simplex virus type 1 in Western Scotland over 15 years. BMJ 324:1366–1367. doi:10.1136/bmj.324.7350.1366. - DOI - PMC - PubMed
    1. Wald A. 2006. Genital HSV-1 infections. Sex Transm Infect 82:189–190. doi:10.1136/sti.2006.019935. - DOI - PMC - PubMed
    1. Xu F, Sternberg MR, Kottiri BJ, McQuillan GM, Lee FK, Nahmias AJ, Berman SM, Markowitz LE. 2006. Trends in herpes simplex virus type 1 and type 2 seroprevalence in the United States. JAMA 296:964–973. doi:10.1001/jama.296.8.964. - DOI - PubMed

Publication types

MeSH terms

LinkOut - more resources