. 2018 Nov;28(11):1675-1687.
doi: 10.1101/gr.234872.118. Epub 2018 Sep 19.

Young genes have distinct gene structure, epigenetic profiles, and transcriptional regulation

Affiliations

Young genes have distinct gene structure, epigenetic profiles, and transcriptional regulation

Michael S Werner et al. Genome Res. 2018 Nov.

Abstract

Species-specific, new, or "orphan" genes account for 10%-30% of eukaryotic genomes. Although initially considered to have limited function, an increasing number of orphan genes have been shown to provide important phenotypic innovation. How new genes acquire regulatory sequences for proper temporal and spatial expression is unknown. Orphan gene regulation may rely in part on origination in open chromatin adjacent to preexisting promoters, although this has not yet been assessed by genome-wide analysis of chromatin states. Here, we combine taxon-rich nematode phylogenies with Iso-Seq, RNA-seq, ChIP-seq, and ATAC-seq to identify the gene structure and epigenetic signature of orphan genes in the satellite model nematode Pristionchus pacificus Consistent with previous findings, we find young genes are shorter, contain fewer exons, and are on average less strongly expressed than older genes. However, the subset of orphan genes that are expressed exhibit distinct chromatin states from similarly expressed conserved genes. Orphan gene transcription is determined by a lack of repressive histone modifications, confirming long-held hypotheses that open chromatin is important for new gene formation. Yet orphan gene start sites more closely resemble enhancers defined by H3K4me1, H3K27ac, and ATAC-seq peaks, in contrast to conserved genes that exhibit traditional promoters defined by H3K4me3 and H3K27ac. Although the majority of orphan genes are located on chromosome arms that contain high recombination rates and repressive histone marks, strongly expressed orphan genes are more randomly distributed. Our results support a model of new gene origination by rare integration into open chromatin near enhancers.


Figures

Figure 1.
Figure 1.
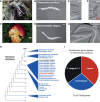
Comparison of Pristionchus pacificus and Caenorhabditis elegans and phylogenetic relationship. (A,B). P. pacificus is often found in a necromenic relationship with insect hosts, preferentially scarab beetles, in the dormant dauer state. When the beetle dies, worms exit the dauer stage to feed on bacteria that bloom on the decomposing carcass. (C,D) C. elegans, the classic nematode model organism, is often found in leaf detritus and rotting fruits. Example rotting apple photo taken by M.S.W. (EG) P. pacificus has become an important model for developmental (phenotypic) plasticity. Adults can adopt (E) a narrow mouth form with one tooth (stenostomatous [St]) that makes them strict bacterial feeders. However, the “boom-and-bust” life cycle creates significant competition for resources, and under crowded conditions adults can develop an alternative mouth form (F) with a wider buccal cavity and an extra tooth (eurystomatous [Eu]) that allows them to prey on other nematodes. (G) Shown here is a eurystomatous P. pacificus preying on a C. elegans larva. (H) A schematic phylogeny of nematodes that was generated based on the publications of Holterman et al. (2017) and Van Megen et al. (2009). (I) Breakdown of P. pacificus genes by evolutionary category: One-to-one orthology with C. elegans (C. elegans 1:1) is the most conserved, followed by genes sharing homology with at least one gene from the 24 other nematodes (homologous), and finally genes that are only found in Pristionchus (orphan). All categories were defined by BLASTP homology (e-value ≤0.001) (Methods).
Figure 2.
Figure 2.
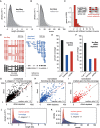
Long-read RNA sequencing (Iso-Seq) improves gene annotation, identifies alternative splicing, and can distinguish different evolutionary gene classes by gene structure. (A) Density distribution of cDNA gene lengths between the El Paco reference (gray) and Iso-Seq annotation (black). The Iso-Seq annotation was derived from guided assembly using StringTie (Pertea et al. 2016; Methods), and plots were created using the density function in R. (B) Density distribution of exons per gene between El Paco reference and Iso-Seq annotations. Method and color scheme are similar to A. (C) Alternatively spliced isoforms, defined as having multiple detected isoforms with the same start and stop coordinates. The white column represents genes containing isoforms that have the same exon–intron structure but different splice sites, and red columns represent genes containing isoforms with different numbers of exons due to intron retention or exon inclusion/exclusion. (D) Example locus of Iso-Seq reads compared to standard short-read RNA-seq. Also shown are Iso-Seq-assembled isoforms compared to the single reference gene umm-S259-11.10-mRNA-1, visualized using Integrated Genome Viewer (IGV). (E,F) Percent coverage of evolutionary gene classes by Iso-Seq with either the “direct” method (E) or rRNA-depleted “total RNA” (F). (G–I) Iso-Seq coverage per gene of each evolutionary class in direct (y-axis) compared to total (x-axis). Coverage was determined by BEDTools, and median ratios of direct/total RNA are presented. Lines (slope = 1, y intercept = 0) represent equal coverage between methods. (J,K) Similar density distributions of cDNA length and exon number as in A and B, but for the three evolutionary gene classes.
Figure 3.
Figure 3.
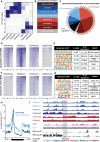
The epigenome of Pristionchus pacificus. (A) Chromatin states determined through a hidden Markov model (ChromHMM) clustered by histone modifications and ATAC-seq, normalized by coverage. Darker blue represents greater enrichment. (B) Candidate annotation of each chromatin state according to ENCODE/modENCODE data sets (Ernst et al. 2011; Roadmap Epigenomics Consortium et al. 2015). Repressive chromatin states are divided into three categories according to standard definitions of constitutive (repressed 3) and facultative (repressed 1 and 2) heterochromatin. Poised enhancers are defined according to previous annotations of loci containing H3K27me3 and DNase sensitivity. (C) Genome-wide distribution of chromatin states, and further clustering into three categories: repressive, transcribed, or regulatory. (D) Heatmap of indicated histone modifications for promoter chromatin states, in which each line represents a single 6-kb locus centered on the promoter. Heatmap matrices were generated in HOMER, clustered from highest to lowest enrichment, and plotted in R. (E) Position weight matrices of de novo sequence motifs in promoters, queried using HOMER. The table also includes the percentage of promoters containing motif, P-value, and matches to known transcription factors. (F,G) Similar to D,E, but for enhancer chromatin states. (H) Average density plots of promoter (dark blue) and enhancer (light blue) locations relative to gene bodies, extended 5 kb in each direction from their 5′ and 3′ ends. Density values measured using HOMER and plotted in Excel. (I) Epigenomic data of histone modification ChIP-seq, ATAC-seq, and RNA-seq surrounding the Ppa-pax3 gene. Input is included as a reference, and chromatin state annotations are included at the bottom matching the colors in C. ChIP-seq and ATAC-seq coverage are autoscaled per sample, and RNA-seq forward (F) and reverse (R) read coverage is in log-scale.
Figure 4.
Figure 4.
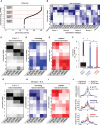
Chromatin states correlate with expression, but expressed young genes exhibit distinct profiles. (A) Average expression (FPKM) from two biological replicates of RNA-seq, plotted for each gene from highest to lowest along the x-axis. Expression categories were binned according to approximate inflection points. (B) Chromatin state enrichment of each expression category broken down by genetic element (i.e., TSSs, UTRs, exons, and introns). (CE) Similar to B, but for each evolutionary gene class. (F) Expression of each evolutionary gene class determined from average RNA-seq FPKMs: (*) P-value <0.05, Welch's t-test (two-tailed). (GI) Similar to BE, but only for highly expressed (groups 1 and 2) genes belonging to each category. (J) Normalized average densities of H3K4me3, H3K4me1, H3K27ac, and ATAC-seq over a 7-kb window centered at 5′ ends. Densities were measured in HOMER and normalized to the highest and lowest values in each gene class.
Figure 5.
Figure 5.
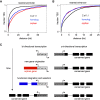
Distance of promoters and enhancers to evolutionary gene classes. (A) Distance cumulative frequency distribution of the nearest promoter, or (B) enhancer (active and poised) to transcription start sites (TSSs) from each evolutionary gene category. (C) Model of new gene transcriptional regulation. Enhancers exhibit bidirectional transcription, which can lead to de novo gene expression, or expression of duplications/insertions. If the new gene provides a useful function, selection will occur on not only protein function, but also the gene structure leading to more exons, and on regulatory elements to provide more temporal or spatial control, and more or less transcription. Ultimately, evolution on enhancer sequences will convert it to a traditional promoter.
Figure 6.
Figure 6.
Chromosome-wide distribution of histone modifications reveals distinct patterns for evolutionary gene classes and a double-band pattern on Chr I. Genome-wide patterns of histone modifications from ChIP-seq and ATAC-seq presented as a heatmap with increasing abundance from white to blue, and white to red for RNA-seq (normalized by depth). Also plotted are gene densities of each evolutionary class binned by expressed (groups 1 and 2) or transcriptionally repressed (groups 3 and 4) for each class.

Similar articles

Cited by

References

    1. Abrusán G. 2013. Integration of new genes into cellular networks, and their structural maturation. Genetics 195: 1407–1417. - PMC - PubMed
    1. Andersson R, Gebhard C, Miguel-Escalada I, Hoof I, Bornholdt J, Boyd M, Chen Y, Zhao X, Schmidl C, Suzuki T, et al. 2014. An atlas of active enhancers across human cell types and tissues. Nature 507: 455–461. - PMC - PubMed
    1. Andersson R, Sandelin A, Danko CG. 2015. A unified architecture of transcriptional regulatory elements. Trends Genet 31: 426–433. - PubMed
    1. Baralle FE, Giudice J. 2017. Alternative splicing as a regulator of development and tissue identity. Nat Rev Mol Cell Biol 18: 437–451. - PMC - PubMed
    1. Barnes TM, Kohara Y, Coulson A, Hekimi S. 1995. Meiotic recombination, noncoding DNA and genomic organization in Caenorhabditis elegans. Genetics 141: 159–179. - PMC - PubMed

Publication types

Substances

LinkOut - more resources