. 2018 Sep 20;3(18):e99592.
doi: 10.1172/jci.insight.99592.

Beclin-1 regulates cigarette smoke-induced kidney injury in a murine model of chronic obstructive pulmonary disease

Affiliations

Beclin-1 regulates cigarette smoke-induced kidney injury in a murine model of chronic obstructive pulmonary disease

Maria A Pabón et al. JCI Insight. .

Abstract

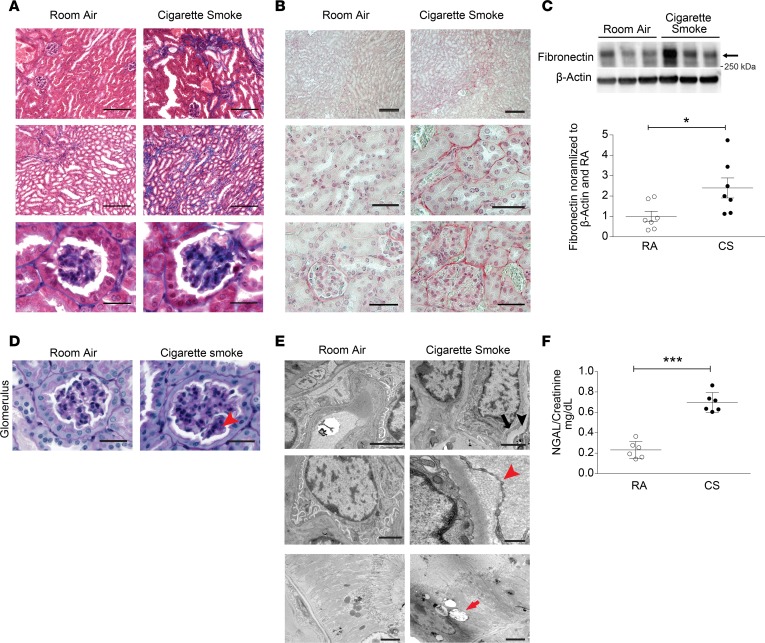
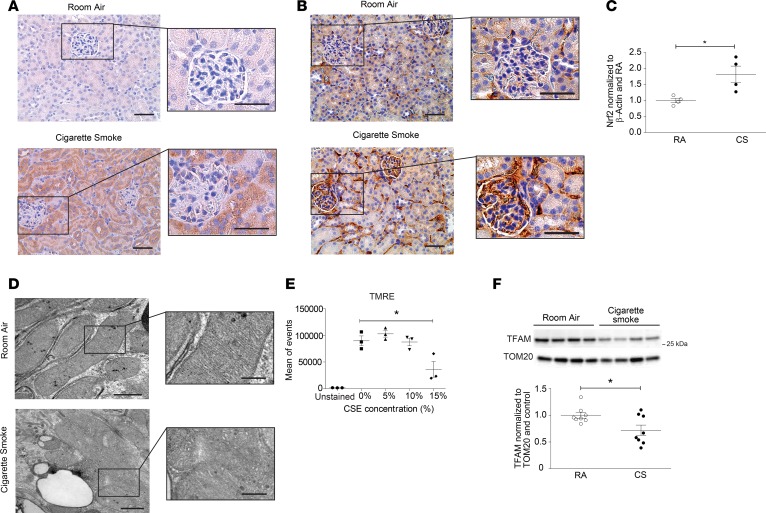
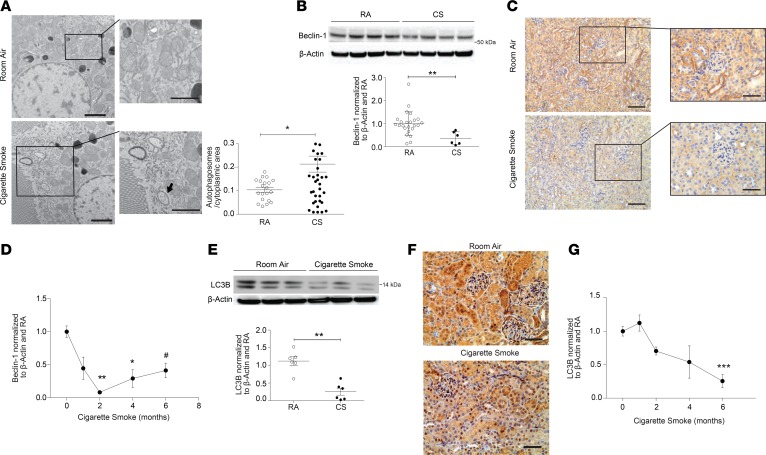
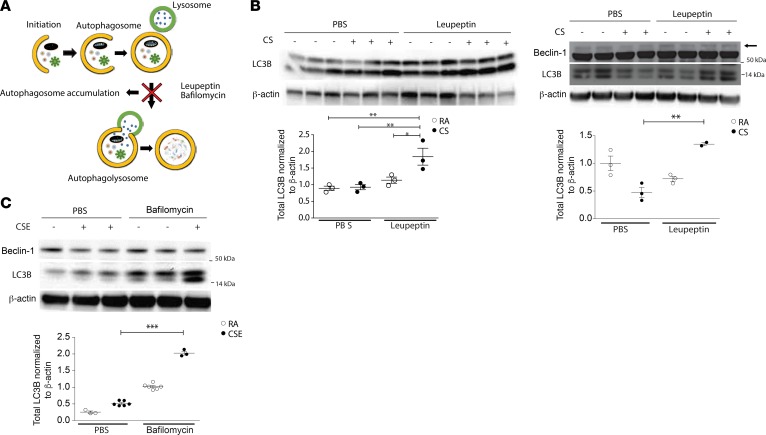
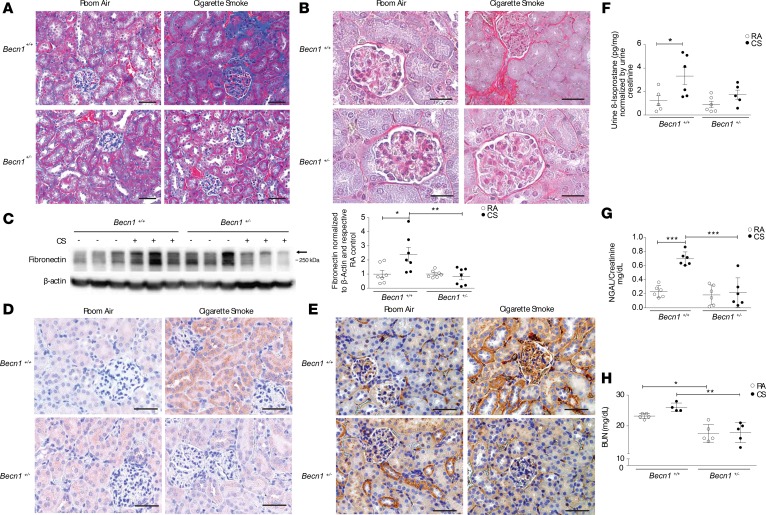
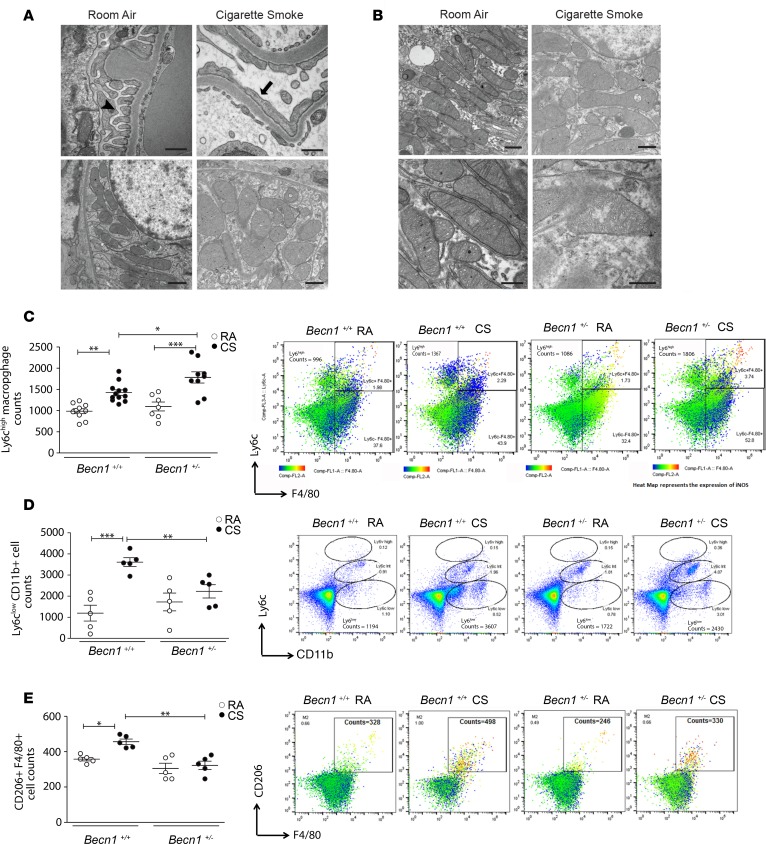
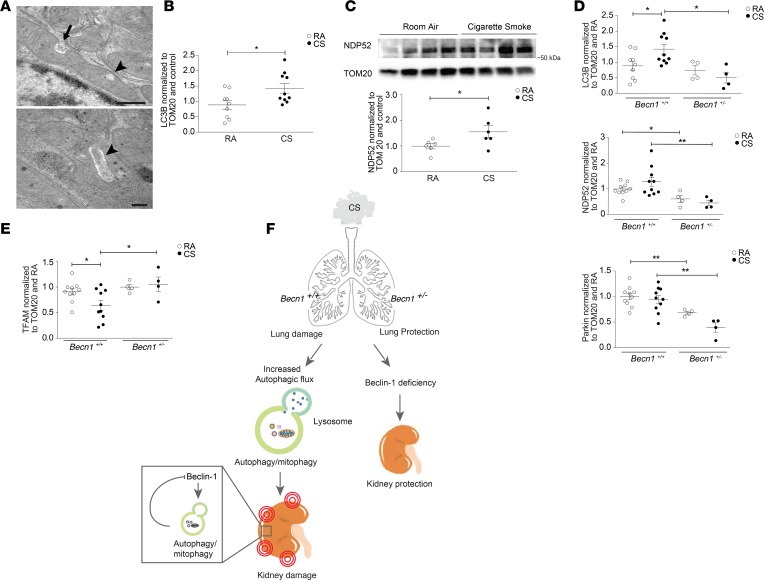
Chronic obstructive pulmonary disease (COPD), associated with cigarette smoke-induced (CS-induced) emphysema, contributes significantly to the global health care burden of disease. Although chronic kidney disease (CKD) may occur in patients with COPD, the relationship between COPD and CKD remains unclear. Using a murine model of experimental COPD, we show that chronic CS exposure resulted in marked kidney injury and fibrosis, as evidenced by histological and ultrastructural changes, altered macrophage subpopulations, and expression of tissue injury, fibrosis, and oxidative stress markers. CS induced mitochondrial dysfunction, and increased autophagic flux in kidney tissues and in kidney tubular epithelial (HK-2) cells, as determined by LC3B turnover assays. Mice heterozygous for Beclin-1 (Becn1+/-) were protected from the development of kidney tissue injury and renal fibrosis in response to CS exposure, and displayed impaired basal and inducible mitochondrial turnover by mitophagy. Interestingly, CS caused a reduction of Beclin-1 expression in mouse kidneys and kidney tubular epithelial cells, attributed to increased autophagy-dependent turnover of Beclin-1. These results suggest that Beclin-1 is required for CS-induced kidney injury and that reduced levels of Beclin-1 may confer renoprotection. These results identify the kidney as a target for CS-induced injury in COPD and the Beclin-1-dependent autophagy pathway as a potential therapeutic target in CKD.

Keywords: Autophagy; COPD; Chronic kidney disease; Nephrology; Pulmonology.


Conflict of interest statement

Conflict of interest: The authors have declared that no conflict of interest exists.

Figures

Figure 1
Figure 1. CS induces kidney injury in a murine model of COPD.
Kidney sections from mice exposed to room air (RA) or cigarette smoke (CS) for 6 months were stained with (A) Masson’s trichrome or (B) Sirius red. Scale bars: 50 μm and 25 μm (magnified images). (C) Western blot for fibronectin expression in kidneys after RA or CS exposure (n = 7 for each group), representative of 3 independent experiments. Graph represents quantification of Western blot data normalized to β-actin and RA control. (D) Periodic acid–Schiff (PAS) staining of kidney tissue from mice exposed to CS for 6 months, showing increased glomerular basement matrix content (arrowhead) relative to RA control. Scale bars: 25 μm. (E) Transmission electron microscopy (TEM) of kidney sections after 6 months of CS exposure, displaying podocyte foot process effacement (black arrow) and glomerular basement membrane thickening (black arrowhead), interstitial collagen deposition (red arrowhead), and cytoplasmic lipid droplets in tubular cells (red arrow) relative to RA control. Scale bars: 2 μm and 500 nm (collagen deposition in CS group). (F) Urine neutrophil gelatinase–associated lipocalin (NGAL) levels quantified by ELISA (mg/dl), normalized to urine creatinine after 6 months of CS exposure (n = 6 per group). All data are mean ± SEM. *P < 0.05, ***P < 0.001 by 2-tailed Student’s t test.
Figure 2
Figure 2. CS induces oxidative stress and mitochondrial injury in a murine model of COPD.
(A) Nitrotyrosine and (B) 8-Oxo-2′-deoxyguanosine (8-oxo-DG) staining detected by immunohistochemical staining of kidney tissue of mice exposed to room air (RA) or cigarette smoke (CS) for 6 months. Scale bars: 50 μm and 25 μm (magnified images). (C) Quantification of Nrf2 expression measured by Western blot in kidney tissue from mice exposed to RA or CS for 6 months (n = 4 in each group) normalized to β-actin and control. Data are mean ± SEM. *P < 0.05, analyzed by Student’s t test. (D) Transmission electron microscopy (TEM) of kidney sections harvested after 6 months of CS exposure, depicting mitochondrial swelling and loss of cristae definition, compared with RA control. Scale bars: 1 μm and 0.5 μm (magnified images). (E) Quantification of mitochondrial membrane potential of HK-2 cells treated in vitro with increasing concentrations of CS extract (CSE), measured by tetramethylrhodamine ethyl ester (TMRE) detected by FACS. Data are mean ± SEM. *P < 0.05 by 1-way ANOVA with Bonferroni’s post hoc test. (F) Representative Western blot of mitochondrial transcription factor A (TFAM) expression in kidneys after 6 months of CS exposure (3 independent determinations), with quantification (n = 8 per group). Data were normalized to TOM20 and RA control. All data are mean ± SEM. *P < 0.05 by 2-tailed Student’s t test.
Figure 3
Figure 3. Regulation of autophagy in mouse kidneys after cigarette smoke exposure.
(A) Representative transmission electron microscopy (TEM) image from kidney tubular cells displaying double-membrane autophagosome formation (black arrow) after 6 months of cigarette smoke (CS) exposure compared with room air (RA) control, with quantification of autophagosomes per cytoplasmic area (mean of autophagosome number in 10 images/group). Scale bars: 2 μm. Data are mean ± SEM. *P < 0.05 by 2-tailed Student’s t test. (B) Beclin-1 expression in kidney tissue after 6 months of CS or RA exposure (n = 24 for RA, n = 6 for CS); representative blot and quantification normalized to β-actin and RA control. Data are mean ± SEM. **P < 0.01 by 2-tailed Student’s t test. (C) Beclin-1 immunohistochemical staining of kidney tissue sections after 6 months of CS exposure compared with RA. Scale bars: 50 μm and 25 μm (magnified images). (D) Beclin-1 expression plotted against time of CS exposure (0 months of exposure, n = 27; 1 month of exposure, n = 6; 2 months of exposure, n = 9; 4 months of exposure, n = 6; and 6 months of exposure, n = 6). Data are mean ± SEM; *P < 0.05, **P < 0.01 compared with 0 months of exposure, 1-way ANOVA with Bonferroni’s post hoc test; #P < 0.05 compared with 0 months of exposure, 2-tailed Student’s t test. (E) Representative Western blot (3 independent experiments) for LC3B expression in kidneys after 6 months of CS exposure, with quantification (n = 6 per group) normalized to β-actin and RA control. Data are mean ± SEM. **P < 0.01 by 2-tailed Student’s t test. (F) Immunohistochemical staining for LC3B expression in kidney tissue of mice exposed to CS or RA (6 months). Scale bars: 50 μm. (G) Time course of LC3B expression in kidney tissue, and quantification of Western blots from 2, 4, and 6 months exposure to CS, normalized to β-actin and RA control (0 months of exposure, n = 27; 1 month of exposure, n = 6; 2 months of exposure, n = 9; 4 months of exposure, n = 6; and 6 months of exposure, n = 6). Data are mean ± SEM, ***P < 0.001 compared with 0 months of exposure, 1-way ANOVA with Bonferroni’s post hoc test.
Figure 4
Figure 4. Autophagy activity is induced in mouse kidneys after cigarette smoke exposure.
(A) Scheme representing autophagic flux experiment in which leupeptin or bafilomycin A1 inhibits autophagosome degradation, leading to autophagosome accumulation. (B) Mice subjected to RA or CS for 2 months (left panel) or 6 months (right panel) were assayed for autophagic flux in vivo by injection with leupeptin or vehicle (PBS), followed by Western blotting for LC3B expression in kidney tissue after 2 and 6 months of exposure and Beclin-1 expression after 6 months of exposure. Dot plots represent quantitation of Western blots (n = 3 per group, except for 6 months CS + leupeptin exposure, n = 2 per group). (C) HK-2 cells were exposed to CSE in the absence or presence of bafilomycin A1. Representative Western blot of Beclin-1 and LC3B expression to determine autophagic flux in vitro. Dot plots represent quantitation of 3 independent experiments. All data are mean ± SEM.*P < 0.05, **P < 0.01, ***P < 0.001, analyzed by 1-way ANOVA with Bonferroni’s post hoc test.
Figure 5
Figure 5. Beclin-1–deficient mice are protected against damage after cigarette smoke exposure.
(A) Masson’s trichrome and (B) Sirius red staining of kidney tissue in Becn1+/– mice compared with Becn1+/+ mice after cigarette smoke (CS) exposure. Scale bars: 50 μm (A) and 25 μm (B). (C) Representative blot and quantification showing fibronectin expression in whole kidney tissue homogenates of Becn1+/– and Becn1+/+ mice exposed to CS or room air (RA) for 6 months (n = 7 per group). Data are mean ± SEM. *P < 0.05, **P < 0.01 by 2-tailed Student’s t test. (D) Nitrotyrosine and (E) 8-Oxo-2′-deoxyguanosine (8-oxo-DG) staining detected by immunohistochemistry in Becn1+/+ mice and Becn1+/– after 6 months of CS exposure. Scale bars: 50 μm. (F) Urine 8-isoprostane levels quantified by ELISA (mg/dl), normalized to urine creatinine after 6 months of CS exposure in Becn1+/– mice compared with Becn1+/+ mice (n = 5 for Becn1+/+ RA and Becn1+/– CS mice; and n = 6 for Becn1+/+ CS and Becn1+/– RA mice). (G) Urine neutrophil gelatinase–associated lipocalin (NGAL) levels quantified by ELISA (mg/dl), normalized to urine creatinine after 6 months of CS exposure in Becn1+/– mice compared with Becn1+/+ mice (n = 6 per group). (H) Blood urea nitrogen (BUN) levels quantified by ELISA (mg/dl), after 6 months of CS exposure in Becn1+/– mice compared with Becn1+/+ mice (n = 5 per group, except Becn1+/+ CS, n = 4). Data are mean ± SEM. *P < 0.05, **P < 0.01, ***P < 0.001, analyzed by 1-way ANOVA with Bonferroni’s post hoc test.
Figure 6
Figure 6. Beclin-1–deficient mice have a decreased profibrotic macrophage phenotype early in the disease process.
(A) Transmission electron microscopy (TEM) sections of the glomerular compartment after 2 months of cigarette smoke (CS) exposure compared with room air (RA), displaying normal podocyte foot processes in RA control (black arrowhead) and podocyte foot process effacement (black arrow) in CS mice, as well as mitochondrial swelling in CS-exposed mice. Scale bars: 500 nm (upper panels) and 1 μm (lower panels). (B) TEM sections of tubular compartment after 2 months of CS exposure compared with RA, displaying mitochondrial swelling in tubular cells in CS-exposed mice. Scale bars: 1 μm (upper panels) and 500 nm (lower panels). (CE) Characterization of M1 or proinflammatory (Ly6chiF4/80+) and M2 or profibrotic (CD206+F4/80+) macrophages performed using flow cytometry, with evidence of (C) an increased Ly6Chi iNOS-expressing population in Becn1+/– compared with Becn1+/+ mice (n = 10 for Becn1+/+ RA, n = 12 for Becn1+/+ CS, n = 7 for Becn1+/– RA, n=9 for Becn1+/+ CS), but (D and E) decreased infiltration of CD206+F4/80+ and Ly6Clo populations in Becn1+/– compared with Becn1+/+ mice (n = 5 per group) after 2 months of CS exposure. All data are mean ± SEM. *P < 0.05, **P < 0.01, ***P < 0.001, analyzed by 1-way ANOVA with Bonferroni’s post hoc test.
Figure 7
Figure 7. Becn1+/– mice have decreased mitophagy at baseline that does not increase after cigarette smoke exposure.
(A) Mitochondria of renal tubular epithelial cells of WT mice exposed to cigarette smoke (CS), showing invaginations (arrow) and loss of mitochondrial matrix (arrowhead) relative to RA control. Scale bars: 500 nm (top) and 200 nm (bottom). (B) Quantification of LC3B detected in mitochondrial fractions from WT mice, normalized to TOM20 and room air (RA) control (n = 9 for RA, n =10 for CS). (C) Representative Western blot of NDP52 in mitochondrial fractions from WT mice exposed to 6 months of CS compared with RA. Graph represents quantification of Western data normalized to TOM20 and RA control (n = 9 for RA, n = 10 for CS). (D) Quantification of Western blots of LC3B, NDP52, Parkin and (E) Mitochondrial transcription factor A (TFAM) expression detected in mitochondrial fractions after 6 months of CS or RA exposure in Becn1+/– mice relative to Becn1+/+ mice. Data were normalized to TOM20 and control (n = 10/group for Becn1+/+ mice, and n = 4/group for Becn1+/– mice). All data are mean ± SEM. *P < 0.05, **P < 0.01, analyzed by Student’s t test (B and C) and 1-way ANOVA with Bonferroni’s post hoc test (D and E). (F) Diagram representing CS-induced kidney injury. After systemic exposure to CS, autophagy is upregulated in kidneys in association with kidney injury. Becn1+/– mice have reduced autophagy and display reduced kidney injury after CS exposure. The increased autophagic activity and autophagosome turnover in response to CS exposure reduces Beclin-1 steady-state levels, as a potential compensatory mechanism.

Similar articles

Cited by

References

    1. US Department of Health and Human Services, Centers for Disease Control and Prevention, National Center for Health Statistics. Health, United States, 2016: With Chartbook on Long-Term Trends in Health. Hyattsville, Maryland, USA: National Center for Health Statistics; 2017. https://www.cdc.gov/nchs/data/hus/hus16.pdf Accessed September 7, 2018.
    1. Barnes PJ, Shapiro SD, Pauwels RA. Chronic obstructive pulmonary disease: molecular and cellular mechanisms. Eur Respir J. 2003;22(4):672–688. doi: 10.1183/09031936.03.00040703. - DOI - PubMed
    1. Hogg JC, et al. The nature of small-airway obstruction in chronic obstructive pulmonary disease. N Engl J Med. 2004;350(26):2645–2653. doi: 10.1056/NEJMoa032158. - DOI - PubMed
    1. Mannino DM, Buist AS. Global burden of COPD: risk factors, prevalence, and future trends. Lancet. 2007;370(9589):765–773. doi: 10.1016/S0140-6736(07)61380-4. - DOI - PubMed
    1. Decramer M, Janssens W, Miravitlles M. Chronic obstructive pulmonary disease. Lancet. 2012;379(9823):1341–1351. doi: 10.1016/S0140-6736(11)60968-9. - DOI - PMC - PubMed

Publication types

MeSH terms