. 2018 Sep 20;3(18):e121718.
doi: 10.1172/jci.insight.121718.

Single-cell RNA sequencing reveals microglia-like cells in cerebrospinal fluid during virologically suppressed HIV

Affiliations

Single-cell RNA sequencing reveals microglia-like cells in cerebrospinal fluid during virologically suppressed HIV

Shelli F Farhadian et al. JCI Insight. .

Abstract

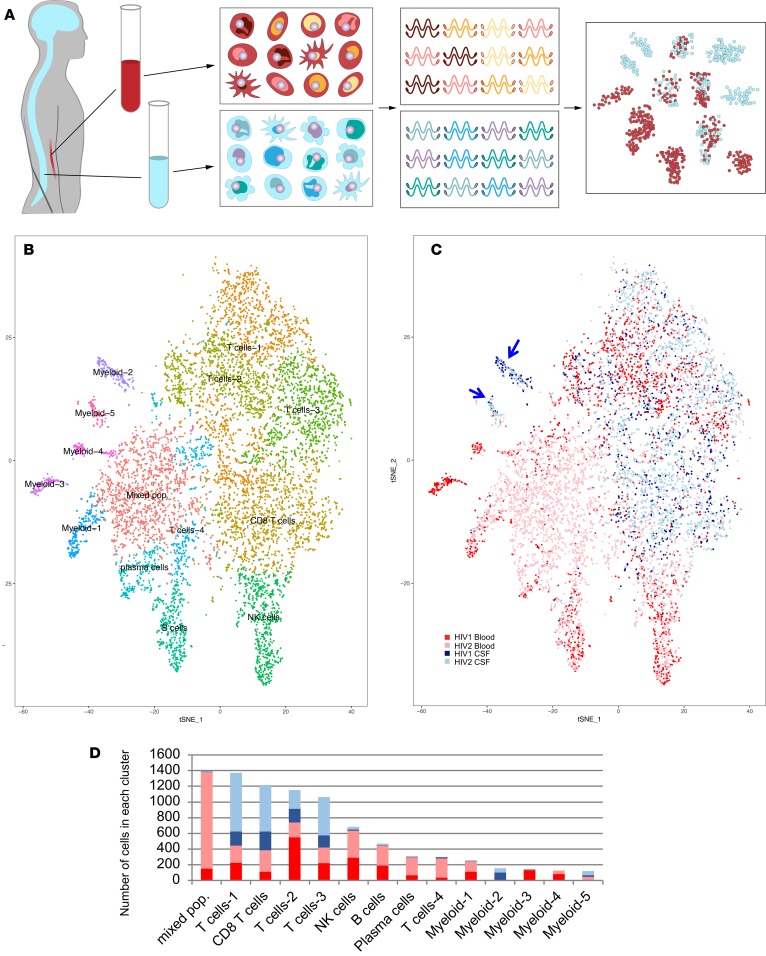
Central nervous system (CNS) immune activation is an important driver of neuronal injury during several neurodegenerative and neuroinflammatory diseases. During HIV infection, CNS immune activation is associated with high rates of neurocognitive impairment, even during sustained long-term suppressive antiretroviral therapy (ART). However, the cellular subsets that drive immune activation and neuronal damage in the CNS during HIV infection and other neurological conditions remain unknown, in part because CNS cells are difficult to access in living humans. Using single-cell RNA sequencing (scRNA-seq) on cerebrospinal fluid (CSF) and blood from adults with and without HIV, we identified a rare (<5% of cells) subset of myeloid cells that are found only in CSF and that present a gene expression signature that overlaps significantly with neurodegenerative disease-associated microglia. This highlights the power of scRNA-seq of CSF to identify rare CNS immune cell subsets that may perpetuate neuronal injury during HIV infection and other conditions.

Keywords: AIDS/HIV; Inflammation; Neurological disorders.


Conflict of interest statement

Conflict of interest: The authors have declared that no conflict of interest exists.

Figures

Figure 1
Figure 1. Single-cell RNA sequencing of paired blood and CSF samples.
(A) CSF and blood were collected and processed in parallel. Single PBMCs and CSF cells were applied to separate arrays, with 10,000 cells applied to each SeqWell array. Single-cell whole transcriptomes were tagged to retain information about the cell, and then sequenced. Sequencing data from single cells was pooled for cluster analysis based on differential gene expression, revealing clusters that are composed predominantly of CSF cells. (B) t-Distributed Stochastic Neighbor Embedding (tSNE) visualization of cell populations identified through unsupervised cluster analysis of blood and CSF derived from 2 HIV+ individuals (HIV1 and HIV2). Clusters are labeled based on expression of canonical marker genes (see also Supplemental Figure 1). (C) tSNE visualization of cells, labeled by sample (HIV1 or HIV2) and tissue (CSF or blood) of origin, revealing 2 myeloid clusters that are predominantly composed of CSF cells (blue arrows). (D) Bar plots quantifying the number of cells from blood and CSF from each sample in each cluster.
Figure 2
Figure 2. Single-cell RNA sequencing reveals a disease-associated microglia-like cellular subset in cerebrospinal fluid.
(A) Heatmap showing the top 15 genes whose expression levels are highest and most differentiating in each of the 5 myeloid subsets. (B) Venn diagram shows genes that were found in Myeloid-2 (blue) and across 2 independent transcriptomic studies of neurodegenerative disease–associated microglial cells derived from mouse brain (green [ref. 16] and orange [ref. 27]), with P < 10–13 and P < 10–4 for the probability of finding overlapping genes when comparing the Myeloid-2 subset to refs. and , respectively). (C) Examination of an independent CSF sample from an HIV+ participant (HIV3) reveals a group of cells with high expression of the genes that characterize the CSF microglia-like myeloid subset (Myeloid-2). (D) Box plots showing the percentage of Myeloid-2 transcripts per cell in HIV+ CSF (n = 5,919 pooled cells), uninfected CSF (n = 1,770 pooled), and blood (n = 5,581 pooled cells), with P values comparing the distribution of Myeloid-2 transcripts between samples (Wilcoxon’s rank-sum test). Shown are the median (black line) and 25th and 75th percentiles (box outlines).

References

    1. Tozzi V, et al. Persistence of neuropsychologic deficits despite long-term highly active antiretroviral therapy in patients with HIV-related neurocognitive impairment: prevalence and risk factors. J Acquir Immune Defic Syndr. 2007;45(2):174–182. doi: 10.1097/QAI.0b013e318042e1ee. - DOI - PubMed
    1. Heaton RK, et al. Neurocognitive change in the era of HIV combination antiretroviral therapy: the longitudinal CHARTER study. Clin Infect Dis. 2015;60(3):473–480. doi: 10.1093/cid/ciu862. - DOI - PMC - PubMed
    1. Grauer OM, et al. Neurocognitive decline in HIV patients is associated with ongoing T-cell activation in the cerebrospinal fluid. Ann Clin Transl Neurol. 2015;2(9):906–919. doi: 10.1002/acn3.227. - DOI - PMC - PubMed
    1. Lovato L, et al. Related B cell clones populate the meninges and parenchyma of patients with multiple sclerosis. Brain. 2011;134(Pt 2):534–541. - PMC - PubMed
    1. Stern JN, et al. B cells populating the multiple sclerosis brain mature in the draining cervical lymph nodes. Sci Transl Med. 2014;6(248):248ra107. doi: 10.1126/scitranslmed.3008879. - DOI - PMC - PubMed

Publication types

Substances