. 2018 Sep 20;3(18):e121886.
doi: 10.1172/jci.insight.121886.

Essential role of IFN-γ in T cell-associated intestinal inflammation

Affiliations

Essential role of IFN-γ in T cell-associated intestinal inflammation

Yoshihiro Eriguchi et al. JCI Insight. .

Abstract

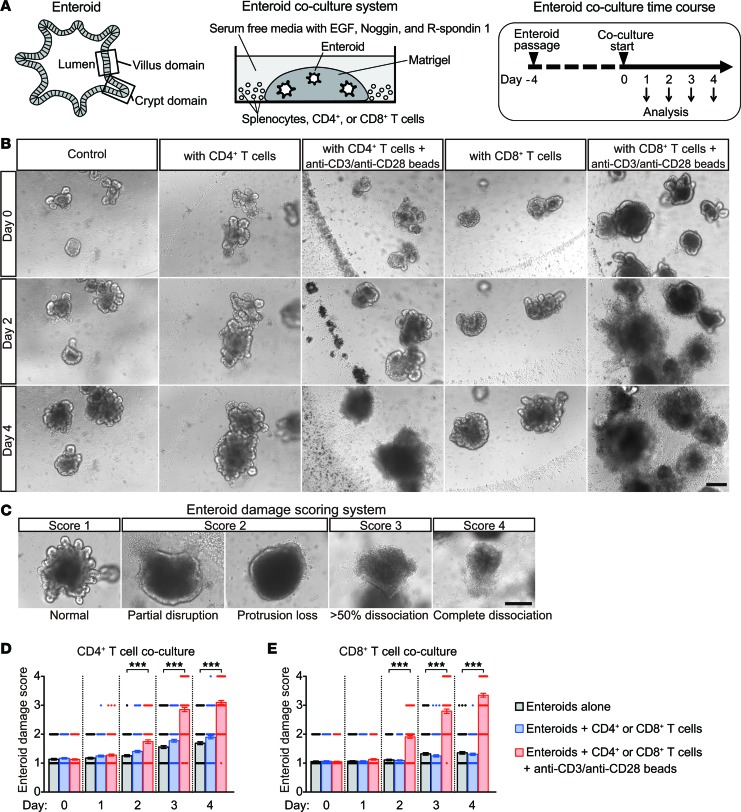
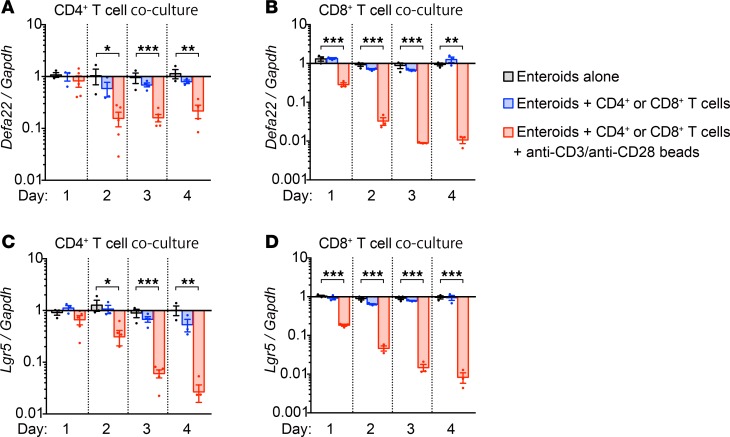
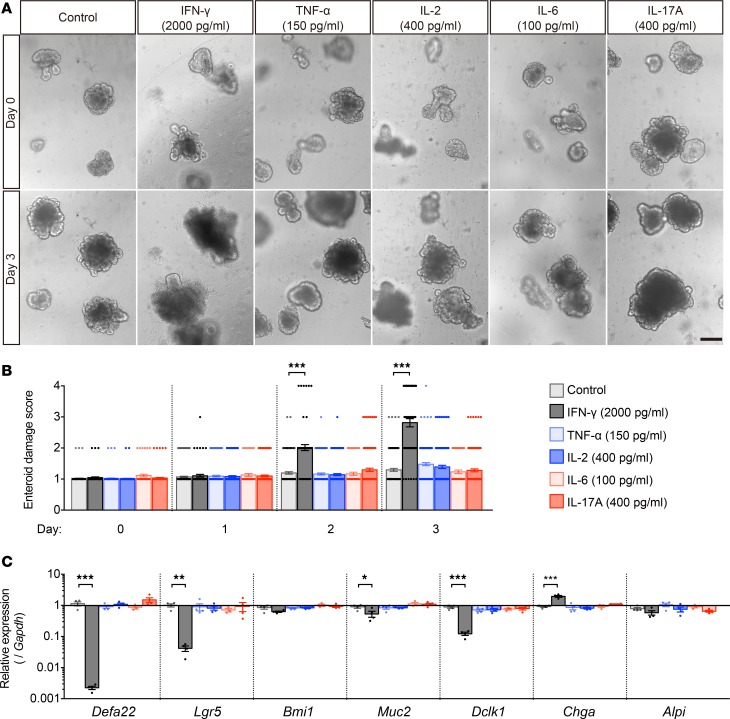
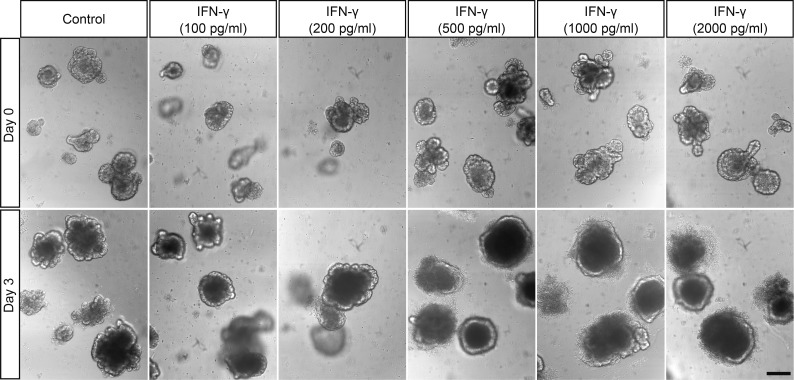
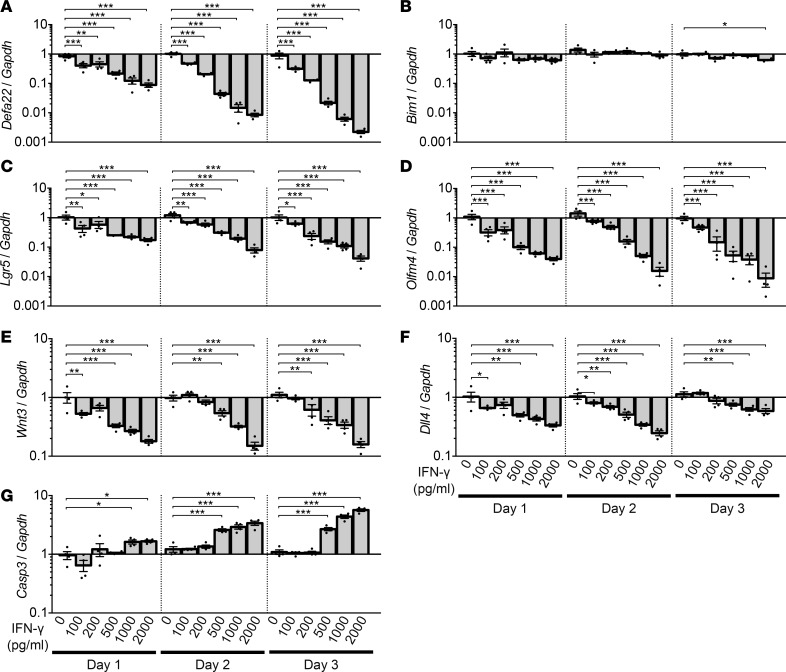
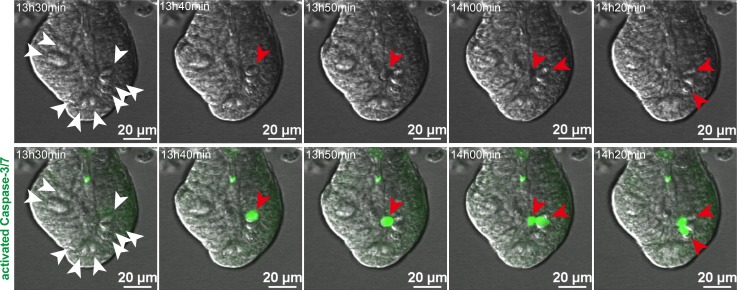
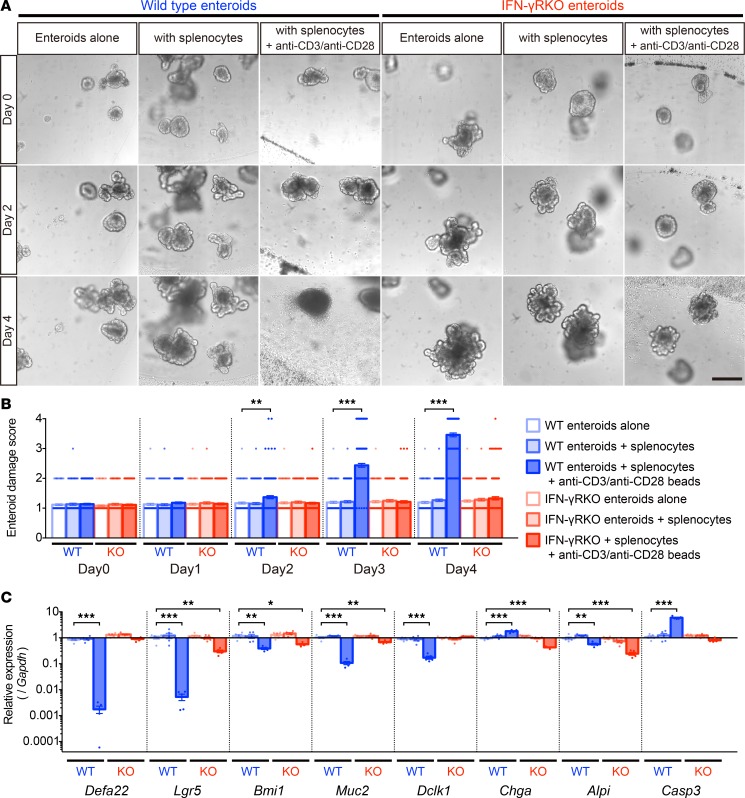
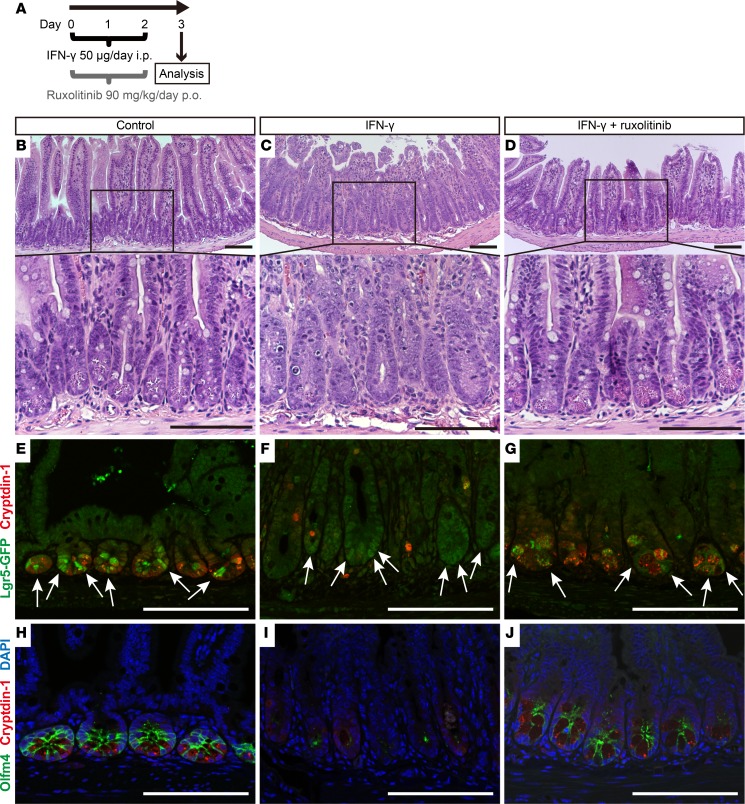
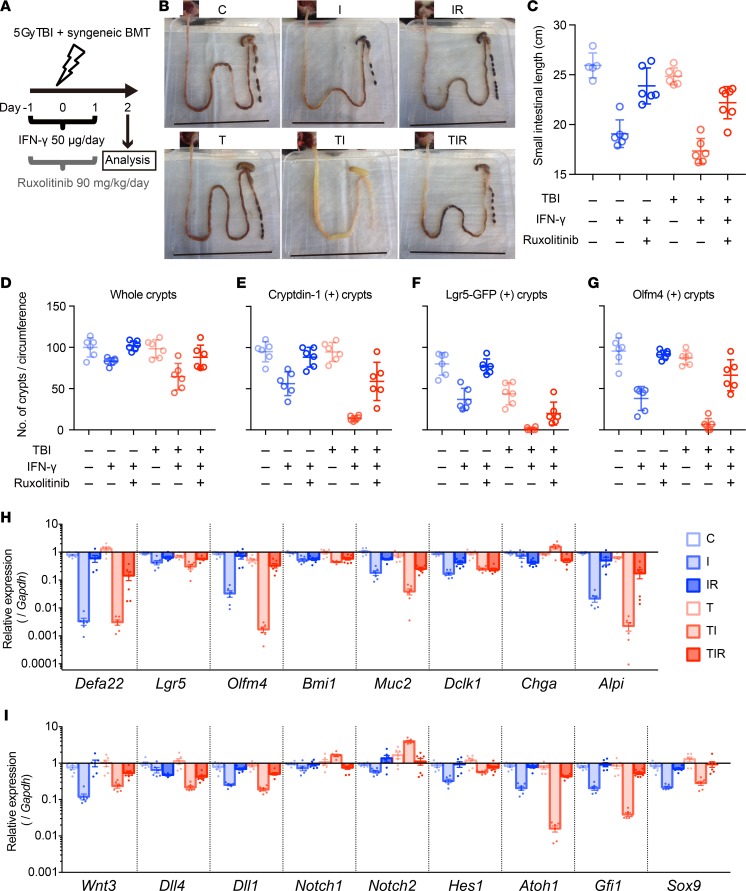
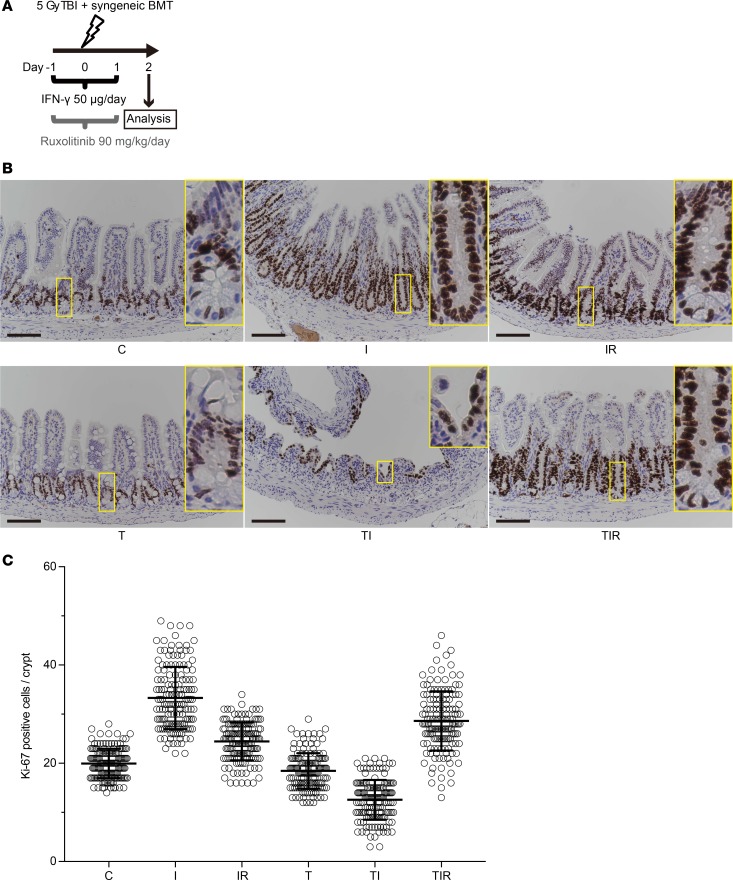
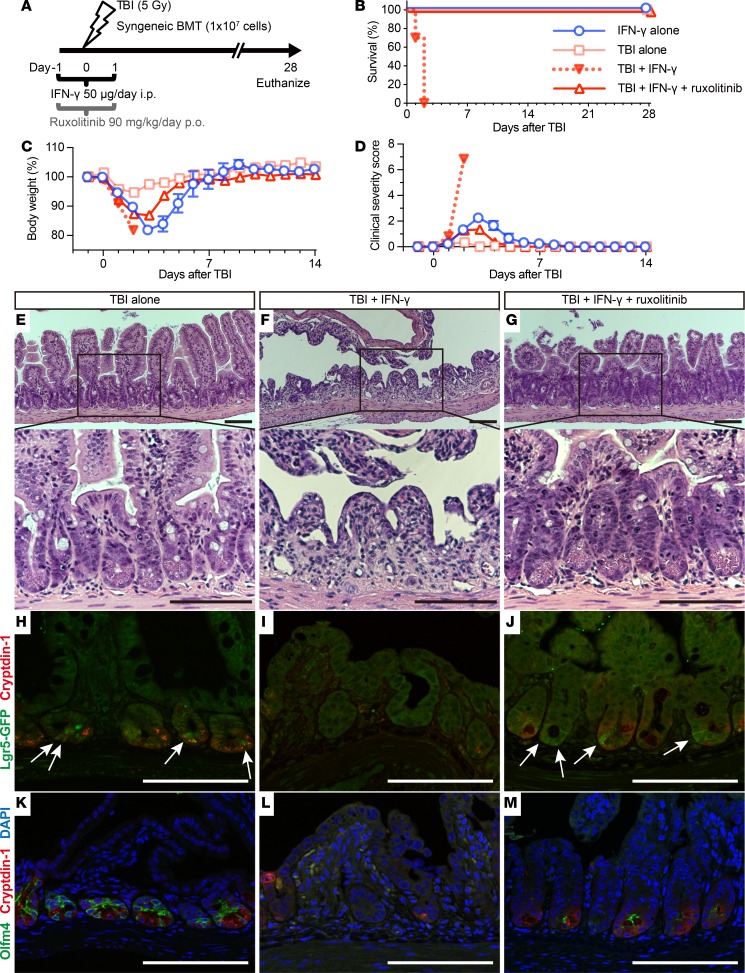
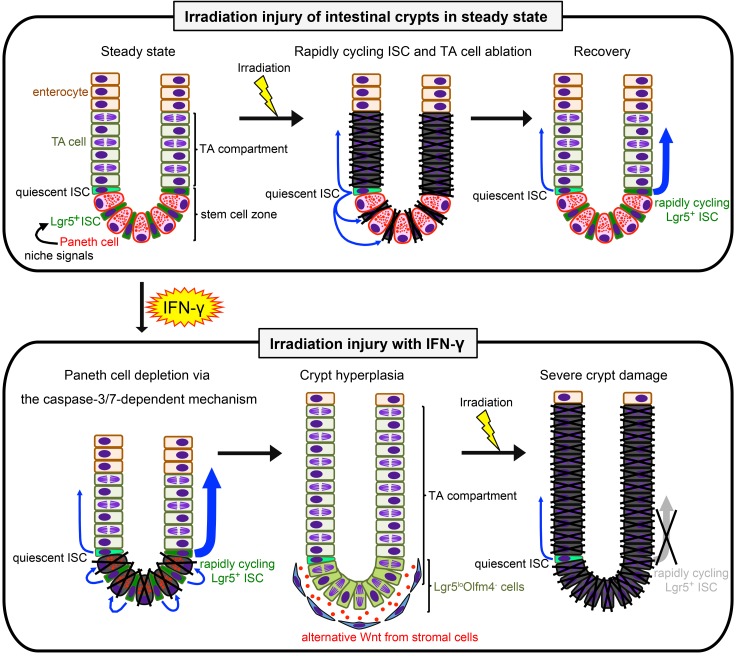
Paneth cells contribute to small intestinal homeostasis by secreting antimicrobial peptides and constituting the intestinal stem cell (ISC) niche. Certain T cell-mediated enteropathies are characterized by extensive Paneth cell depletion coincident with mucosal destruction and dysbiosis. In this study, mechanisms of intestinal crypt injury have been investigated by characterizing responses of mouse intestinal organoids (enteroids) in coculture with mouse T lymphocytes. Activated T cells induced enteroid damage, reduced Paneth cell and Lgr5+ ISC mRNA levels, and induced Paneth cell death through a caspase-3/7-dependent mechanism. IFN-γ mediated these effects, because IFN-γ receptor-null enteroids were unaffected by activated T cells. In mice, administration of IFN-γ induced enteropathy with crypt hyperplasia, villus shortening, Paneth cell depletion, and modified ISC marker expression. IFN-γ exacerbated radiation enteritis, which was ameliorated by treatment with a selective JAK1/2 inhibitor. Thus, IFN-γ induced Paneth cell death and impaired regeneration of small intestinal epithelium in vivo, suggesting that IFN-γ may be a useful target for treating defective mucosal regeneration in enteric inflammation.

Keywords: Cytokines; Gastroenterology; Homeostasis; Inflammation; Inflammatory bowel disease.


Conflict of interest statement

Conflict of interest: The authors have declared that no conflict of interest exists.

Figures

Figure 1
Figure 1. Activated T cells induce enteroid damage.
(A) Overall design of enteroid and T cell coculture experiments. (B) Enteroids cocultured with CD4+ or CD8+ T cells (5 × 10⁴ cells per well) with (activated) or without (resting) anti-CD3/anti-CD28 beads. (C) Enteroid damage scoring system. Damage scores of enteroids cocultured with CD4+ (D) or CD8+ (E) T cells. Data are representative of 2 independent experiments and are shown as mean ± SEM (n = 100 enteroids per group); gray bars, enteroids alone; blue bars, enteroids plus resting T cells; red bars, enteroids plus activated T cells. Dunnett’s multiple comparisons test was used to compare each group with the control group. ***P < 0.001. Scale bars: 200 μm.
Figure 2
Figure 2. Activated T cells reduce Paneth cell and Lgr5+ ISC marker mRNA levels.
(AD) Enteroids cocultured with CD4+ or CD8+ T cells (5 × 10⁴ cells per well) with (activated) or without (resting) anti-CD3/anti-CD28 beads. After removal of CD4+ (A and C) and CD8+ (B and D) T cells, enteroid RNAs were analyzed by qRT-PCR to measure levels of Defa22 (A and B) and Lgr5 (C and D) mRNAs. Data are representative of 2 independent experiments and shown as mean ± SEM (enteroids alone, n = 3 independent wells, gray bars; enteroids + resting T cells, n = 4, blue bars; enteroids + activated T cells, n = 4, red bars). Dunnett’s multiple comparisons test was used to compare each group with the control group. *P < 0.05, **P < 0.01, ***P < 0.001.
Figure 3
Figure 3. IFN-γ induces enteroid damage.
(A) Enteroids were exposed to IFN-γ, TNF-α, IL-2, and IL-17A, the highest levels released into coculture media, or with 100 pg/ml in the case of IL-6 to determine which cytokine(s) mediate enteroid damage. Only IFN-γ treatment caused damage. (B) Damage scores of enteroids exposed for 3 days to the proinflammatory cytokines shown. Data are from 2 independent experiments and shown as mean ± SEM (n = 100 enteroids per group). (C) qRT-PCR analyses of lineage markers in enteroids exposed to cytokines for 3 days. Data are representative of 2 independent experiments and shown as mean ± SEM (n = 4 independent wells). Dunnett’s multiple comparisons test was used to compare each group with the control group. *P < 0.05, **P < 0.01, ***P < 0.001. Scale bar: 200 μm.
Figure 4
Figure 4. IFN-γ induces dose-dependent enteroid damage.
Enteroids were exposed to IFN-γ for 3 days as shown. Representative images from 2 experiments are shown. Scale bar: 200 μm.
Figure 5
Figure 5. IFN-γ induces dose-dependent loss of Paneth cells and rapidly cycling stem cells.
Enteroids were exposed to IFN-γ for 3 days. (AG) qRT-PCR analyses to quantify lineage-specific mRNAs, niche signal mRNAs of Paneth cell origin, and apoptosis mRNA levels in enteroids exposed to IFN-γ for 1, 2, and 3 days. Data are from 2 independent experiments and are shown as mean ± SEM (n = 4 independent wells). Dunnett’s multiple comparisons test was used to compare each group with the control group at each time point. *P < 0.05, **P < 0.01, ***P < 0.001.
Figure 6
Figure 6. IFN-γ induces Paneth cell death through a caspase-3/7–dependent pathway.
Still images from time-lapse analysis of caspase-3/7 activity in an enteroid exposed to IFN-γ (from Supplemental Videos 1 and 2). Paneth cells (white arrowheads) are granule-containing and appear white in the differential interference contrast images (top row). Cells containing activated caspase-3/7 have bright green nuclei (red arrowheads), which were detected only in Paneth cells and extruded into the crypt lumen after caspase-3/7 activation (bottom row). Time after addition of 2 ng/ml IFN-γ is indicated in the upper left corner of each image. Representative images from 2 experiments are shown. Scale bars: 20 μm.
Figure 7
Figure 7. IFN-γ mediates enteroid damage induced by splenocyte activation.
(A) WT or IFN-γ receptor–KO (IFN-γRKO, KO) enteroids in coculture with WT splenocytes with or without activation using anti-CD3/anti-CD28 beads. (B) Damage scores of WT or KO enteroids in coculture with control or activated WT splenocytes. Data are representative of 2 independent experiments and shown as mean ± SEM, with n = 100 enteroids per group. (C) qRT-PCR analyses to quantify lineage-specific and apoptosis marker mRNAs in WT or IFN-γRKO enteroids in coculture with control or activated WT splenocytes for 4 days. Data are representative of 2 independent experiments and shown as mean ± SEM (n = 5 independent wells). Dunnett’s multiple comparisons test was used to compare each group with the WT control group. *P < 0.05, **P < 0.01, ***P < 0.001. Scale bar: 200 μm.
Figure 8
Figure 8. Exogenous IFN-γ depletes Paneth cells and modifies the expression of rapidly cycling ISC markers in vivo.
(A) Overall experimental scheme for IFN-γ and ruxolitinib administration in mice. Ileum samples were collected 72 hours after the first dose of IFN-γ. Histochemical staining (H&E) of ileum sections from control (B), IFN-γ–treated (C), or IFN-γ + ruxolitinib–treated (D) C57BL/6 mice. (EJ) Confocal image for cryptdin-1 (red) of Lgr5-EGFP-ires-creERT2 mouse ileum sections. (EG) Lgr5-GFP+ ISCs are green (white arrows). (HJ) Sections stained for Olfm4 (green) with DAPI (blue). Control (E and H), IFN-γ–treated (F and I), and IFN-γ + ruxolitinib–treated (G and J) ileum sections are shown. The results are representative of 2 experiments. Note that some ileal crypts of IFN-γ–treated mice lack Paneth cells and Olfm4+ ISCs (I), but crypts that are faintly positive for Lgr5-GFP cells are still evident (F). Scale bars: 100 μm.
Figure 9
Figure 9. Aggravated radiation enteropathy and impaired epithelial regeneration induced by IFN-γ.
(A) Schematics of the study to determine effects of TBI, IFN-γ, and ruxolitinib on intestinal epithelium in mice. Ileum tissue was collected 48 hours after TBI and analyzed. (B) Representative small intestines of control (C), IFN-γ (I), IFN-γ + ruxolitinib (IR), TBI (T), TBI + IFN-γ (TI), and TBI + IFN-γ + ruxolitinib (TIR) mice are shown. Scale bars: 8 cm. (C) Lengths of small bowels in cohort. Measurements from 2 experiments were combined and presented as mean ± SD; control group, n = 4; TIR, n = 7; remaining groups, n = 6. (DG) Quantification of crypt numbers per ileum circumference section at 48 hours after TBI. Whole (D), cryptdin-1+ (E), Lgr5-GFP+ (F), and Olfm4+ (G) crypts were counted in 2 ileum circumference sections of 3 different Lgr5-EGFP-ires-creERT2 mice from each group. Data are from 2 separate experiments and show mean ± SD. (H and I) qRT-PCR analyses were performed to quantify mRNAs coding for lineage-specific markers, niche factors, and requisite lineage-determining transcription factors in whole terminal ileum tissue. Data from 2 separate experiments were combined and are shown as mean ± SEM; TIR group, n = 7; all other groups, n = 6 biological replicates. Tukey’s multiple comparisons test was used to compare each cohort. Mean values of data in CG and statistical results in CI are presented in Supplemental Tables 2–4.
Figure 10
Figure 10. IFN-γ modulation of ileal crypt cell proliferation in response to irradiation injury.
(A) Schematics of the study to determine effects of TBI, IFN-γ, and ruxolitinib on intestinal epithelium in mice. Ileum tissue was collected 48 hours after TBI and analyzed. (B) IHC staining of Ki-67 in mouse ileal sections. Control (C), IFN-γ (I), IFN-γ + ruxolitinib (IR), TBI (T), TBI + IFN-γ (TI), and TBI + IFN-γ + ruxolitinib (TIR) are shown. Scale bars: 100 μm. (C) Ki-67+ cell numbers per longitudinal crypt section were counted in 30 ileal crypts per mouse. Data from 5 different C57BL/6 mice in each group were combined from 2 separate experiments and are shown as mean ± SD. Tukey’s multiple comparisons test was used to compare the each cohort. Statistical results of data in C are presented in Supplemental Table 5.
Figure 11
Figure 11. IFN-γ increases the radiosensitivity of intestinal epithelial tissue.
(A) Schematic depiction of TBI, and IFN-γ and ruxolitinib administration in mice. After TBI, mice received syngeneic bone marrow transplantation (BMT) to rescue from bone marrow death on day 0. Survival (B), body weight as a percentage of initial weight (C), and clinical severity scores (D) from 2 independent experiments were combined, and data are shown as mean values ± SEM (IFN-γ alone group, n = 6; TBI alone group, n = 6; TBI + IFN-γ group, n = 10; TBI + IFN-γ + ruxolitinib group, n= 10). (EM) Histology of mouse ileal sections 48 hours after TBI. H&E staining of ileum sections from mice receiving TBI (E), TBI + IFN-γ (F), or TBI + IFN-γ + ruxolitinib (G). (HM) Confocal imaging of Lgr5-EGFP-ires-creERT2 mouse ileum sections. Immunofluorescence staining of cryptdin-1 (red, H-M), Lgr5-GFP+ (green, white arrows, H-J), Olfm4 (green) and DAPI (blue) (K-M) for mice that received TBI (H and K), TBI + IFN-γ (I and L), or TBI + IFN-γ + ruxolitinib (J and M). The results are representative of 2 separate experiments and illustrate the reduction in crypt numbers and the loss and absence of Paneth cells and rapidly cycling ISCs in ileum of TBI + IFN-γ–treated mice (F, I, and L). Scale bars: 100 μm.
Figure 12
Figure 12. Schematic representation of hypothetical IFN-γ etiology augmenting irradiation injury.
Upper images depict the course of crypt recovery from irradiation injury. Rapidly cycling ISCs that converted from quiescent ISCs after irradiation (center image, blue arrows) restore damaged crypts promptly (33, 34). Lower panel shows the hypothetical IFN-γ etiology. In the absence of niche signals previously derived from Paneth cells, Lgr5loOlfm4 cells, and TA cells become prevalent, and Lgr5loOlfm4 cells replace positions the base of the crypts that formerly were occupied by the depleted Paneth cells. The increase in Lgr5loOlfm4 cells relative to Lgr5+Olfm4+ ISCs may contribute to crypt hyperplasia. However, in crypts depleted of Paneth cells by IFN-γ exposure, Bmi1+ quiescent ISCs cannot convert to rapidly cycling ISCs in sufficient numbers to respond to irradiation, resulting in failure to repair and restore epithelial integrity. Blue arrows indicate ISC division.

References

    1. Clevers HC, Bevins CL. Paneth cells: maestros of the small intestinal crypts. Annu Rev Physiol. 2013;75:289–311. doi: 10.1146/annurev-physiol-030212-183744. - DOI - PubMed
    1. Ayabe T, Satchell DP, Wilson CL, Parks WC, Selsted ME, Ouellette AJ. Secretion of microbicidal alpha-defensins by intestinal Paneth cells in response to bacteria. Nat Immunol. 2000;1(2):113–118. doi: 10.1038/77783. - DOI - PubMed
    1. Salzman NH, Ghosh D, Huttner KM, Paterson Y, Bevins CL. Protection against enteric salmonellosis in transgenic mice expressing a human intestinal defensin. Nature. 2003;422(6931):522–526. doi: 10.1038/nature01520. - DOI - PubMed
    1. Salzman NH, et al. Enteric defensins are essential regulators of intestinal microbial ecology. Nat Immunol. 2010;11(1):76–83. doi: 10.1038/ni.1825. - DOI - PMC - PubMed
    1. Masuda K, Sakai N, Nakamura K, Yoshioka S, Ayabe T. Bactericidal activity of mouse α-defensin cryptdin-4 predominantly affects noncommensal bacteria. J Innate Immun. 2011;3(3):315–326. doi: 10.1159/000322037. - DOI - PubMed

Publication types

MeSH terms