. 2018 Sep 20;3(18):e121495.
doi: 10.1172/jci.insight.121495.

Gluconeogenesis and risk for fasting hyperglycemia in Black and White women

Affiliations

Gluconeogenesis and risk for fasting hyperglycemia in Black and White women

Stephanie T Chung et al. JCI Insight. .

Abstract

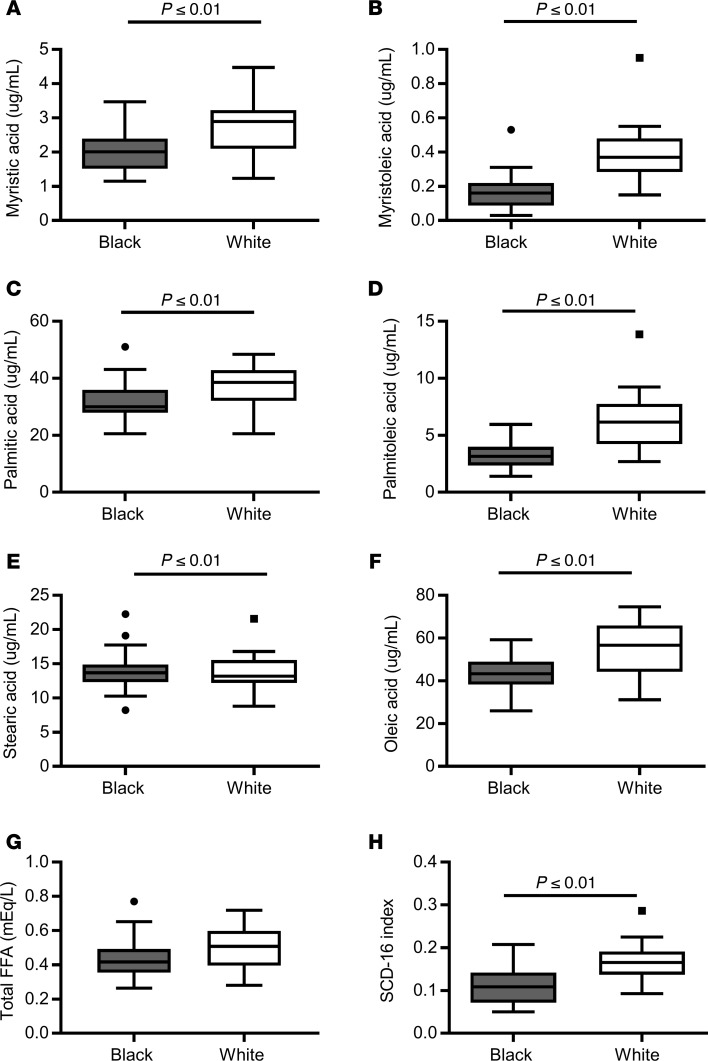
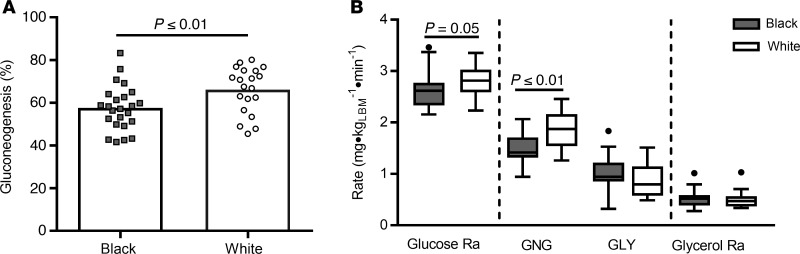
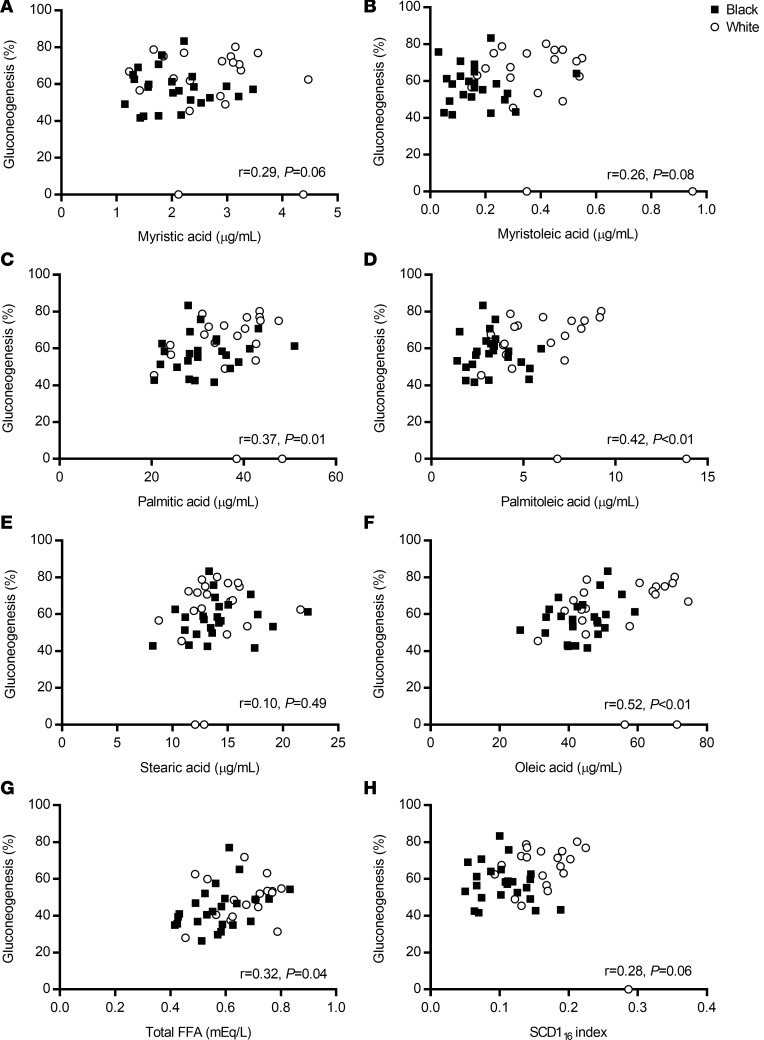
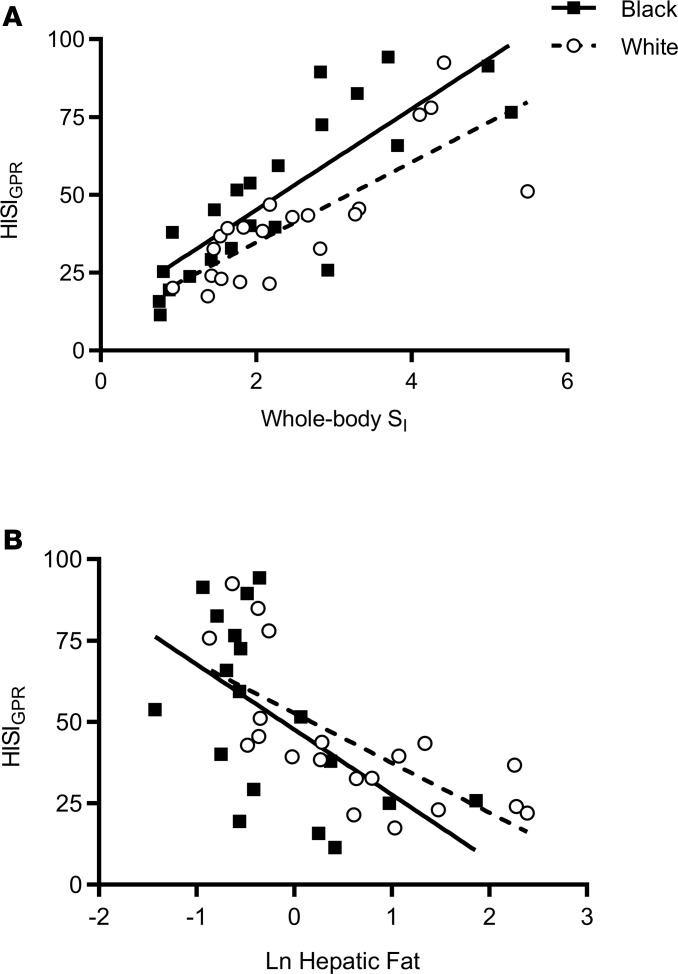
Black women, compared with White women, have high rates of whole-body insulin resistance but a lower prevalence of fasting hyperglycemia and hepatic steatosis. This dissociation of whole-body insulin resistance from fasting hyperglycemia may be explained by racial differences in gluconeogenesis, hepatic fat, or tissue-specific insulin sensitivity. Two groups of premenopausal federally employed women, without diabetes were studied. Using stable isotope tracers, [2H2O] and [6,62-H2]glucose, basal glucose production was partitioned into its components (gluconeogenesis and glycogenolysis) and basal whole-body lipolysis ([2H5]glycerol) was measured. Indices of insulin sensitivity, whole-body (SI), hepatic (HISIGPR), and adipose tissue, were calculated. Hepatic fat was measured by proton magnetic resonance spectroscopy. Black women had less hepatic fat and lower fractional and absolute gluconeogenesis. Whole-body SI, HISIGPR, and adipose tissue sensitivity were similar by race, but at any given level of whole-body SI, Black women had higher HISIGPR. Therefore, fasting hyperglycemia may be a less common early pathological feature of prediabetes in Black women compared with White women, because gluconeogenesis remains lower despite similar whole-body SI.

Keywords: Gluconeogenesis; Glucose metabolism; Insulin; Metabolism.


Conflict of interest statement

Conflict of interest: The authors have declared that no conflict of interest exists.

Figures

Figure 1
Figure 1. Individual fatty acid concentrations and stearoyl Co-A desaturase activity by race.
Tukey box-and-whisker plots of (A) myristic acid, (B) myristoleic acid, (C) palmitic acid, (D) palmitoleic acid, (E) stearic acid, (F) oleic acid, (G) total free fatty acid (FFA), and (H) SCD-116 index in Black (gray, n = 24) and White (white, n = 22) women. Top and bottom box limits represent the 75th and 25th percentile, respectively; midlines represent the median; and top and bottom whiskers represent the 75th percentile plus 1.5 of the interquartile range (IQR) and the 25th percentile minus 1.5 IQR, respectively. Black dots represent any values that lie outside the range of the whiskers. Individual fatty acid concentrations were measured by high-resolution liquid chromatography mass spectrometry. The stearoyl Co-A desaturase 1 activity (SCD-116) index is an indicator of hepatic de novo lipogenesis, calculated as the plasma ratio of palmitoleic to palmitic acid. Groups were compared by unpaired Student’s t test.
Figure 2
Figure 2. Basal rates of glucose and glycerol turnover in Black and White women.
Using stable isotope tracers after a 10- to 12-hour overnight fast, we compared basal rates of (A) fractional gluconeogenesis (GNG) (boxes represent mean per group, with individual data points in Black women [gray squares, n = 24] and White women [white circles, n = 22]) and (B) glucose turnover (Ra), absolute GNG, glycogenolysis (GLY), and glycerol Ra (Tukey box plots) in Black women (gray, n = 24) and White women (White, n = 22). Top and bottom box limits represent the 75th and 25th percentile, respectively; midlines represent the median; and top and bottom whiskers represent the 75th percentile plus 1.5 of the interquartile range (IQR) and the 25th percentile minus 1.5 IQR, respectively. Black dots represent any values that lie outside the range of the whiskers. Groups were compared by unpaired Student’s t test. LBM, lean body mass.
Figure 3
Figure 3. The relationship of fractional gluconeogenesis with fatty acid concentrations and stearoyl Co-A desaturase activity.
Scatterplots and Pearson correlations for (A) myristic acid, (B) myristoleic acid, (C) palmitic acid, (D) palmitoleic acid, (E) stearic acid, (F) oleic acid, (G) total free fatty acid (FFA), and (H) SCD-116 in Black women (black box and solid line, n = 24) and White women (white circle, dotted line, n = 22). SCD-116, stearoyl Co-A desaturase 1 activity index. SCD-116 is an indicator of hepatic de novo lipogenesis, calculated as the plasma ratio of palmitoleic to palmitic acid.
Figure 4
Figure 4. Relationship of hepatic insulin sensitivity index with whole-body insulin sensitivity and hepatic fat.
(A) Scatter plot of hepatic insulin sensitivity index (HISIGPR) with whole-body insulin sensitivity (SI) in Black women (black squares and solid line, n = 22) and White women (white circles and dotted line, n = 21). Using linear regression analyses, Black women had higher HISIGPR at any given level of whole-body SI (β = 11.8; 95% CI: 3.1, 20.4; adjusted R2 = 0.64; P < 0.01). There was no interaction between whole-body SI and race (P > 0.50). (B) Scatter plot of HISIGPR with Ln hepatic fat in Black women (black squares and line, n = 18) and White women (White circles and dotted line, n = 20). Ln, natural log-transformed. Pearson correlations were used to determine correlation coefficients (black, r = –0.6, and White, r = –0.7, P ≤ 0.01).

Similar articles

Cited by

References

    1. Ogurtsova K, et al. IDF Diabetes Atlas: Global estimates for the prevalence of diabetes for 2015 and 2040. Diabetes Res Clin Pract. 2017;128:40–50. doi: 10.1016/j.diabres.2017.03.024. - DOI - PubMed
    1. Benjamin EJ, et al. Heart Disease and Stroke Statistics-2018 Update: A Report From the American Heart Association. Circulation. 2018;137(12):e67–e492. - PubMed
    1. Utumatwishima JN, Chung ST, Bentley AR, Udahogora M, Sumner AE. Reversing the tide - diagnosis and prevention of T2DM in populations of African descent. Nat Rev Endocrinol. 2018;14(1):45–56. - PubMed
    1. Chung ST, Sumner AE. Diabetes: T2DM risk prediction in populations of African descent. Nat Rev Endocrinol. 2016;12(3):131–132. doi: 10.1038/nrendo.2016.2. - DOI - PubMed
    1. Price AJ, et al. Prevalence of obesity, hypertension, and diabetes, and cascade of care in sub-Saharan Africa: a cross-sectional, population-based study in rural and urban Malawi. Lancet Diabetes Endocrinol. 2018;6(3):208–222. doi: 10.1016/S2213-8587(17)30432-1. - DOI - PMC - PubMed

Publication types

MeSH terms