. 2018 Sep 19;8(1):14020.
doi: 10.1038/s41598-018-32338-w.

Green microalgae in marine coastal waters: The Ocean Sampling Day (OSD) dataset

Affiliations

Green microalgae in marine coastal waters: The Ocean Sampling Day (OSD) dataset

Margot Tragin et al. Sci Rep. .

Abstract

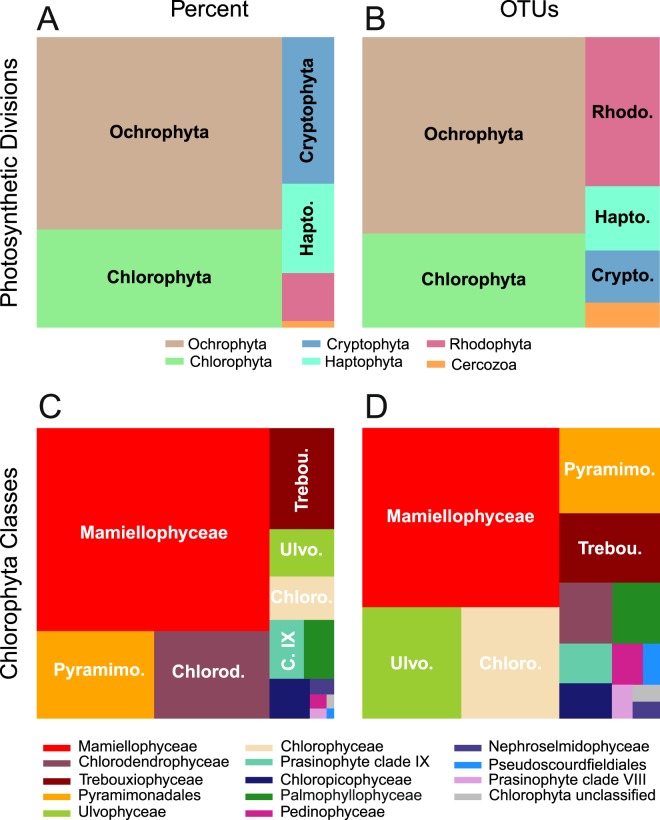
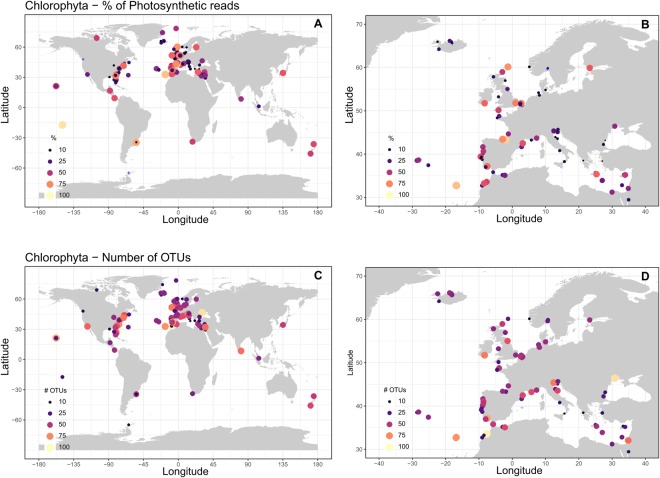
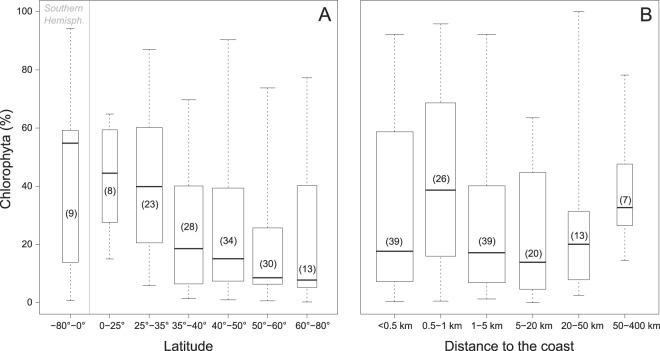
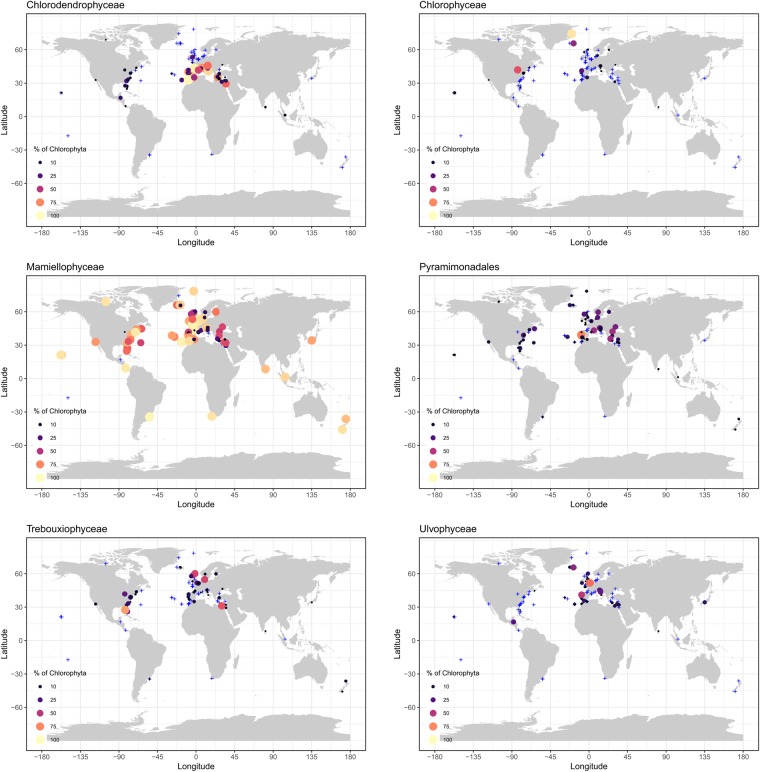
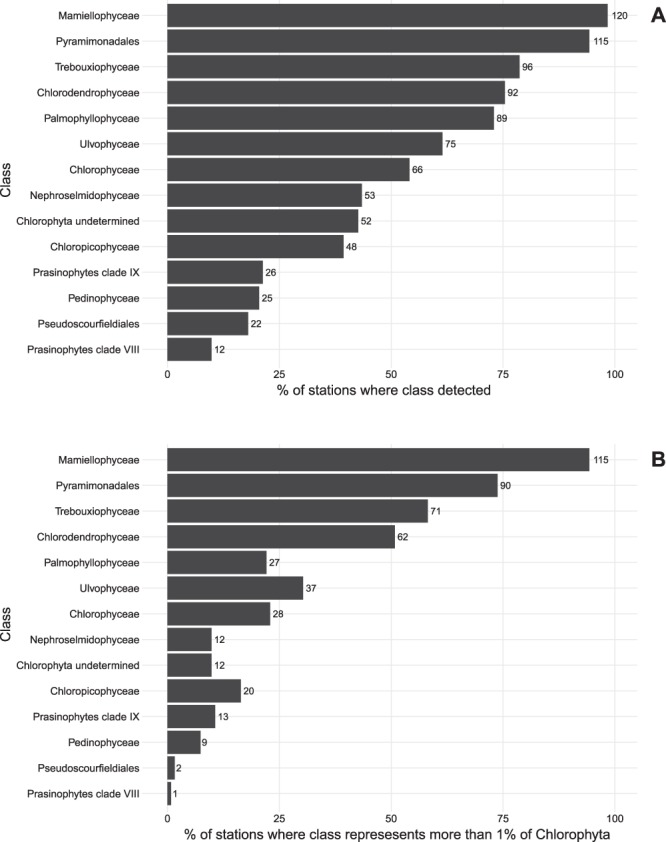
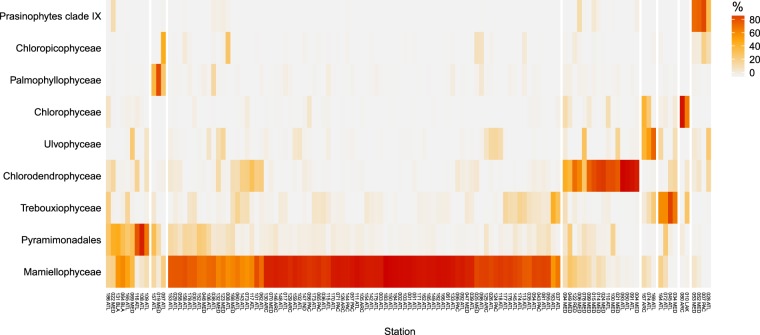
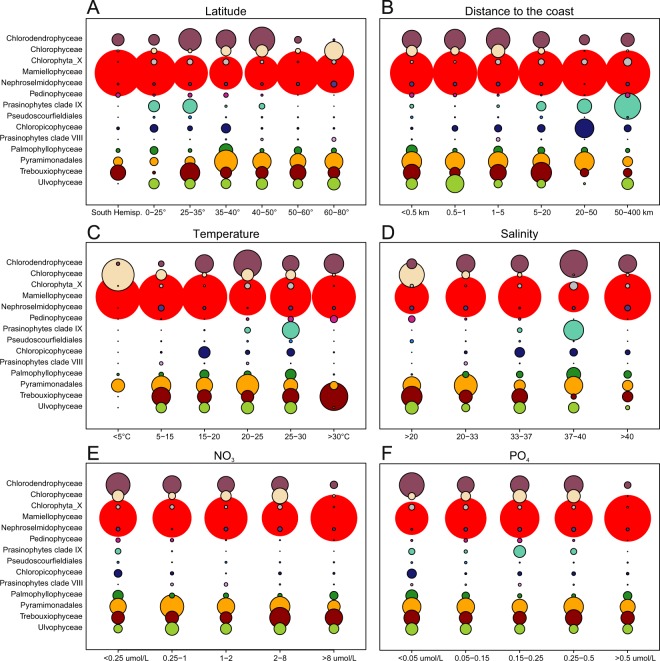
The ecology and distribution of green phytoplankton (Chlorophyta) in the ocean is poorly known because most studies have focused on groups with large cell size such as diatoms or dinoflagellates that are easily recognized by traditional techniques such as microscopy. The Ocean Sampling Day (OSD) project sampled surface waters quasi-simultaneously at 141 marine locations, mostly in coastal waters. The analysis of the 18S V4 region OSD metabarcoding dataset reveals that Chlorophyta are ubiquitous and can be locally dominant in coastal waters. Chlorophyta represented 29% of the global photosynthetic reads (Dinoflagellates excluded) and their contribution was especially high at oligotrophic stations (up to 94%) and along the European Atlantic coast. Mamiellophyceae dominated most coastal stations. At some coastal stations, they were replaced by Chlorodendrophyceae, Ulvophyceae, Trebouxiophyceae or Chlorophyceae as the dominating group, while oligotrophic stations were dominated either by Chloropicophyceae or the uncultured prasinophytes clade IX. Several Chlorophyta classes showed preferences in terms of nitrate concentration, distance to the coast, temperature and salinity. For example, Chlorophyceae preferred cold and low salinity coastal waters, and prasinophytes clade IX warm, high salinity, oligotrophic oceanic waters.


Conflict of interest statement

The authors declare no competing interests.

Figures

Figure 1
Figure 1
Contribution (average number of reads per station) and diversity (number of OTUs) of photosynthetic group at OSD stations. (A) Photosynthetic divisions (Total number of reads = 1,103,675). (B) Idem for OTUs (Total = 3069). (C) Chlorophyta classes (Total number of reads = 313,240). (D) Idem for OTUs (Total = 749).
Figure 2
Figure 2
(A) Map of the contribution of Chlorophyta to OSD photosynthetic reads (dinoflagellates excluded). (B) Idem for Europe. Stations where Chlorophyta reads represented less than 1% of photosynthetic reads are represented by blue crosses. (C,D) Idem for number of Chlorophyta OTUs.
Figure 3
Figure 3
Boxplots of Chlorophyta contribution to photosynthetic reads (dinoflagellates excluded) per range of metadata. (A) Latitude. (B) Distance to the coast. Numbers in brackets correspond to the number of stations in the range (also represented by the boxplot width).
Figure 4
Figure 4
Contribution of the 6 major Chlorophyta classes at OSD stations in surface. Circle size and color are proportional to the contribution of the class relative to all Chlorophyta reads (in %). Stations where the class contributed to less than one percent of the Chlorophyta reads are represented by blue crosses. Stations with less than 100 Chlorophyta reads recorded were not considered.
Figure 5
Figure 5
(A) Percentage of OSD surface stations where a given Chlorophyta class was detected (at least one read). Numbers at right of bars correspond to number of stations. (B) Idem but for stations where the class contributed more than 1% of the Chlorophyta reads. Stations with less than 100 Chlorophyta reads were not considered.
Figure 6
Figure 6
Heatmap of OSD Chlorophyta communities. Colors refer to the percentage of reads in each class related to the total number of Chlorophyta reads. Stations and classes have been clustered using Bray-Curtis dissimilarity. Stations could be split into 8 major groups (separated by white lines). Only Chlorophyta classes representing on average at least 1% of the Chlorophyta reads were taken into account. Stations with less than 100 Chlorophyta reads recorded were not considered.
Figure 7
Figure 7
Contribution of Chlorophyta classes per range of metadata. (A) Latitude (OSD metadata). (B) Distance to the coast (calculated). (C) Water temperature (measured in situ). (D) Salinity (measured in situ). (E) Nitrates (World Ocean database 2013). (F) Phosphates (World Ocean database 2013). Circles are proportional to the average contribution of a given class to total Chlorophyta. For salinity, OSD10 was not taken into account since it is located in a freshwater lake.

References

    1. Nakayama T, et al. The basal position of scaly green flagellates among the green algae (Chlorophyta) is revealed by analyses of nuclear-encoded SSU rRNA sequences. Protist. 1998;149:367–80. doi: 10.1016/S1434-4610(98)70043-4. - DOI - PubMed
    1. Fučíková K, et al. New phylogenetic hypotheses for the core Chlorophyta based on chloroplast sequence data. Front. Ecol. Evol. 2014;2:63.
    1. Leliaert F, et al. Phylogeny and molecular evolution of the green algae. CRC. Crit. Rev. Plant Sci. 2012;31:1–46. doi: 10.1080/07352689.2011.615705. - DOI
    1. Guillou L, et al. Diversity of picoplanktonic prasinophytes assessed by direct nuclear SSU rDNA sequencing of environmental samples and novel isolates retrieved from oceanic and coastal marine ecosystems. Protist. 2004;155:193–214. doi: 10.1078/143446104774199592. - DOI - PubMed
    1. Viprey M, Guillou L, Ferréol M, Vaulot D. Wide genetic diversity of picoplanktonic green algae (Chloroplastida) in the Mediterranean Sea uncovered by a phylum-biased PCR approach. Environ. Microbiol. 2008;10:1804–1822. doi: 10.1111/j.1462-2920.2008.01602.x. - DOI - PubMed

Publication types

Substances

LinkOut - more resources