. 2018 Sep 19;8(1):14076.
doi: 10.1038/s41598-018-32075-0.

Optogenetic Peripheral Nerve Immunogenicity

Affiliations

Optogenetic Peripheral Nerve Immunogenicity

Benjamin E Maimon et al. Sci Rep. .

Abstract

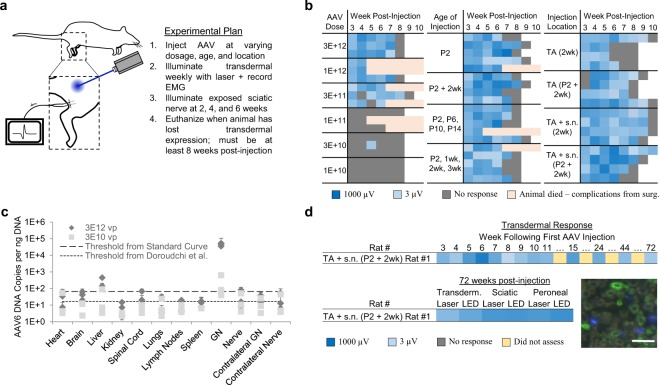
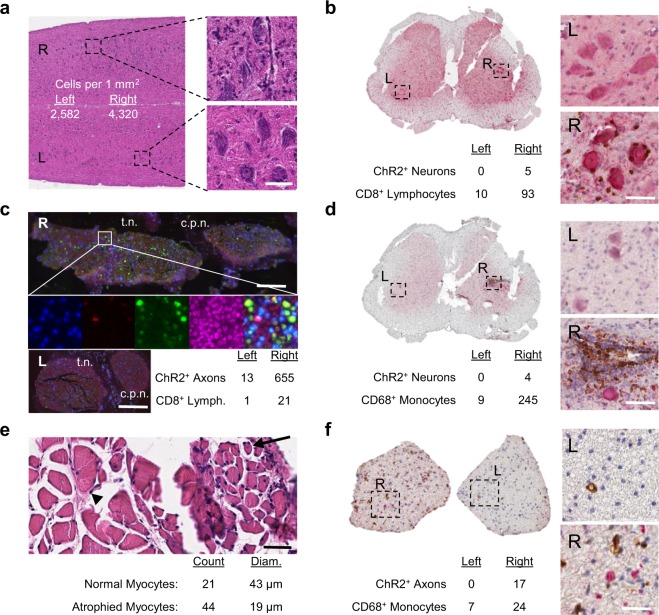
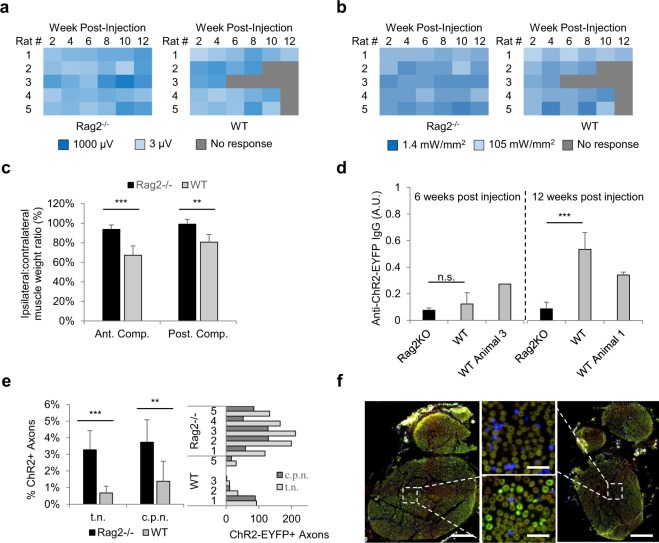
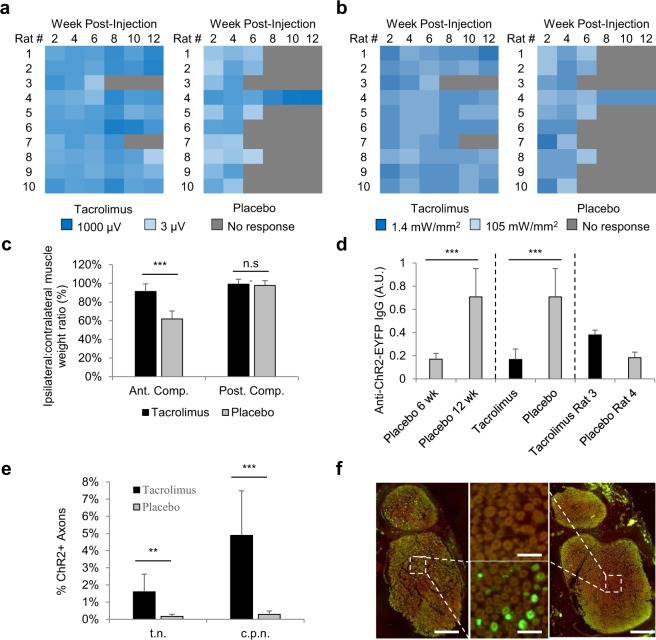
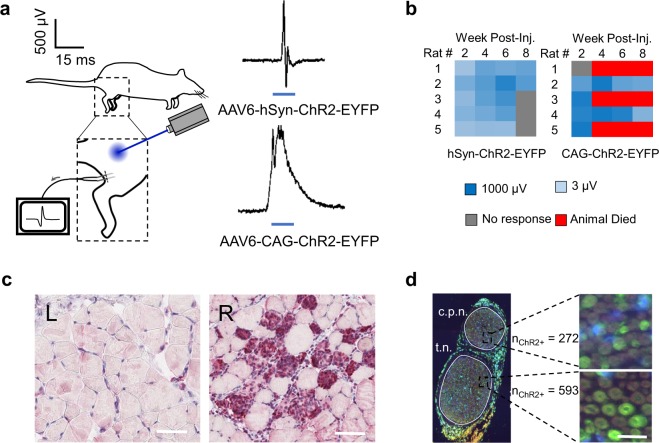
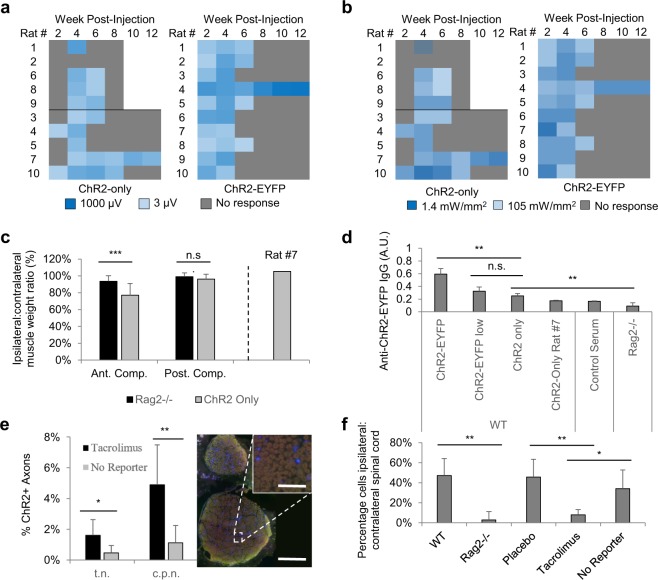
Optogenetic technologies have been the subject of great excitement within the scientific community for their ability to demystify complex neurophysiological pathways in the central (CNS) and peripheral nervous systems (PNS). The excitement surrounding optogenetics has also extended to the clinic with a trial for ChR2 in the treatment of retinitis pigmentosa currently underway and additional trials anticipated for the near future. In this work, we identify the cause of loss-of-expression in response to transdermal illumination of an optogenetically active peroneal nerve following an anterior compartment (AC) injection of AAV6-hSyn-ChR2(H134R) with and without a fluorescent reporter. Using Sprague Dawley Rag2-/- rats and appropriate controls, we discover optogenetic loss-of-expression is chiefly elicited by ChR2-mediated immunogenicity in the spinal cord, resulting in both CNS motor neuron death and ipsilateral muscle atrophy in both low and high Adeno-Associated Virus (AAV) dosages. We further employ pharmacological immunosuppression using a slow-release tacrolimus pellet to demonstrate sustained transdermal optogenetic expression up to 12 weeks. These results suggest that all dosages of AAV-mediated optogenetic expression within the PNS may be unsafe. Clinical optogenetics for both PNS and CNS applications should take extreme caution when employing opsins to treat disease and may require concurrent immunosuppression. Future work in optogenetics should focus on designing opsins with lesser immunogenicity.


Conflict of interest statement

The authors declare no competing interests.

Figures

Figure 1
Figure 1
(a) Experimental plan for dosage, timing, and location of injection animals. (b) Logarithmic VRMS amplitude of Tibialis Anterior (TA) motor activity in response to 473 nm, 45 mW/mm2 transdermal illumination of the proximal tibia for 4 s at 5 Hz and 10 ms PW for different groups. (2wk = 2 week, P2 = 2 day postpartum, s.n. = Sciatic Nerve) (c) Biodistribution results for 3E12 vp and 3E10 vp injected animals. (GN = Gastrocnemius Muscle, Nerve = Sciatic Nerve). n = 3 biologically independent samples for each group. (d) Time-course for Rat #1 in group TA + s.n. P2 & 2 wk. This animal did not lose transdermal expression up through 72 weeks post-injection, when rat was euthanized. Logarithmic VRMS activity at the sciatic and peroneal nerves at time of euthanasia with different illumination sources shown, as well as sciatic nerve cross-section showing ChR2+ axons (green) and DAPI (blue): scale bar = 30 µm.
Figure 2
Figure 2
(a) Coronal lumbar H&E spinal cord section of ChR2-EYFP+ neurons in rat showing ipsilateral inflammation present. Scale bar = 80 μm. Experiment repeated 4 times with similar results. (b) Lumbar spinal cord cross-section immunohistochemistry for ChR2-EYFP (red), CD8 (brown), and hematoxylin (blue). Scale bar = 60 µm. Experiment repeated 3 times with similar results. (c) Sciatic nerve (R) and contralateral sciatic nerve (L) stained for ChR2-EYFP (green), CD8 (red), DAPI (blue), and background axons (magenta) with tibial (t.n.) and common peroneal (c.p.n.) nerve divisions labeled. Scale bar (R) = 250 µm; Scale bar (L) = 500 µm. Experiment repeated 2 times with similar results. (d) Lumbar spinal cord cross-section immunohistochemistry for ChR2-EYFP (red), CD68 (brown), and hematoxylin (blue). Scale bar = 60 µm. Experiment repeated 3 times with similar results. (e) Tibialis Anterior (TA) cross-section of ChR2-transduced rat showing myocytes which are healthy (arrowhead) and those with denervation atrophy (arrow): Scale bar = 60 µm. Experiment repeated 3 times with similar results. (f) Ventral root cross-section immunohistochemistry for ChR2-EYFP (red), CD68 (brown), and hematoxylin (blue). Scale bar = 20 µm. Experiment repeated 2 times with similar results.
Figure 3
Figure 3
(a) Logarithmic VRMS amplitude of Tibialis Anterior (TA) motor activity in response to 473 nm, 105 mW/mm2 transdermal illumination of the proximal tibia for 4 s at 5 Hz and 10 ms PW for Rag2−/− and WT rats treated with high dose AAV6. (b) Logarithmic minimum transdermal illumination power needed to elicit transdermal EMG spikes from TA: VRMS threshold set to 2.45 µV, which was empirically determined to be the max noise level of recordings. (c) Ipsilateral to contralateral side of injection muscle weight ratio at the time of euthanasia for high dose Rag2−/− and WT rats in both the anterior and posterior compartment muscle groups, representing primarily the TA and Gastrocnemius muscles respectively (n = 5 per group). P = 1E-3 for Ant. Comp. and P = 3E-3 for Post. Comp. (d) Normalized ELISA comparing plasma antibodies against ChR2(H134R)-EYFP for Rag2KO and WT rats at 6 weeks post injection (n = 2 for Rag2KO, n = 5 for WT) and 12 weeks post injection (n = 5 for both groups). P = 8E-4 for 12 week. WT Animal 3 was the only rat which lost transdermal optogenetic expression at week 6. WT Animal 1 was the only rat which maintained expression at week 12. In addition to being included in their respective groups, these animals are also shown separately. (e) ChR2-EYFP+ axon counts as percentage of total axons (left) and as absolutes (right) in tibial nerve (t.n.) and peroneal nerve (c.p.n.) divisions of sciatic nerve of WT and Rag2−/− rats (nRag2−/− = 8, nWT = 7): Pleft = 2E-4. Pright = 3E-3. On left, rats from excitotoxicity control group also included. WT Rat #4 sciatic nerve omitted because was not properly paraffin processed. (f) Sciatic nerve cross sections of representative Rag2−/− rat (left) and WT rat (right) labeled for ChR2-EYFP (green) and DAPI (blue). Scale barleft,right = 120 µm, Scale barcenter = 20 µm. Experiment repeated 3 times with similar results.
Figure 4
Figure 4
(a) Logarithmic VRMS amplitude of Tibialis Anterior (TA) motor activity in response to 473 nm, 105 mW/mm2 transdermal illumination of the proximal tibia for 4 s at 5 Hz and 10 ms PW for rats treated with slow release tacrolimus pellet compared to rats treated with placebo pellet. (b) Logarithmic minimum transdermal illumination power needed to elicit transdermal EMG spikes from TA for tacrolimus-treated and placebo-treated rats: VRMS spike threshold set to 2.45 µV, which was empirically determined to be the max noise level of recordings. (c) Ipsilateral to contralateral side of injection muscle weight ratio at the time of euthanasia between tacrolimus and placebo rats for both the anterior and posterior compartment muscle groups, representing primarily the TA and Gastrocnemius muscles respectively (n = 8 for tacrolimus, 9 for placebo group). Tacrolimus rats #3 and #7 (which had lost expression at time of euthanasia), and placebo rat #4 (which maintained expression at time of euthanasia) were excluded, as shown in Supplemental Figures. P = 3E-6 for anterior compartment and P = 0.23 for posterior compartment. (d) Normalized ELISA comparing plasma antibodies against ChR2(H134R)-EYFP for WT rats at 6 weeks post injection (n = 10) and 12 weeks post injection (all others, n = 10). P = 5E-5 for 6 vs 12 week comparison. P = 3E-5 for tacrolimus vs. placebo comparison at 12 weeks. In addition to being included in their respective groups, rat #3 in tacrolimus group and rat #4 in placebo group are also shown separately as they are outliers in their respective groups. (e) ChR2-EYFP+ axon counts as percentage of total axons in tibial nerve (t.n.) and common peroneal nerve (c.p.n.) of tacrolimus and placebo rats (nTacrolimus = 8, nPlacebo = 9): Pt.n. = 5E-3; Pc.p.n. = 1E-3. Tacrolimus rats #3 and #7 (which had lost expression at time of euthanasia), and placebo rat #4 (which maintained expression at time of euthanasia) were excluded. (f) Sciatic nerve cross sections of representative Rag2−/− rat (left) and WT rat (right) labeled for ChR2-EYFP (green) and DAPI (blue). Scale barleft,right = 120 µm, Scale barcenter = 20 µm. Experiment repeated 7 times with similar results.
Figure 5
Figure 5
(a) Tibialis Anterior (TA) EMG recordings in response to 473 nm transdermal illumination of proximal tibia in rats transduced with rAAV-ChR2 restricted by either hSyn or CAG promoter. (b) Logarithmic minimum transdermal illumination power needed to elicit transdermal EMG spikes from TA for hSyn and CAG promoters: VRMS spike threshold set to 2.45 µV, which was empirically determined to be the max noise level of recordings. (c) TA cross-section of CAG rat 8 weeks post-injection showing healthy myocytes devoid of inflammation on contralateral limb (left) and ChR2-EYFP transduced myocytes co-localized with significant inflammatory cells on ipsilateral limb (red, right): scale bar = 40 µm. Experiment repeated 1 time with similar results. (d) Immunofluorescence for ChR2+ axons in CAG-ChR2-EYFP sciatic nerve sections along with counts in peroneal (c.p.n.) and tibial (t.n.) sections: scale bar = 20 µm. Experiment repeated 1 time with similar results.
Figure 6
Figure 6
(a) Logarithmic VRMS amplitude of Tibialis Anterior (TA) motor activity in response to 473 nm, 105 mW/mm2 transdermal illumination of the proximal tibia for 4 s at 5 Hz and 10 ms PW for rats injected with ChR2-only vs. those with ChR2-EYFP. (b) Logarithmic minimum transdermal illumination power needed to elicit transdermal EMG spikes from TA for ChR2-only and ChR2-EYFP rats: VRMS spike threshold set to 2.45 µV, which was empirically determined to be the max noise level of recordings. (c) Ipsilateral to contralateral side of injection muscle weight ratio at the time of euthanasia between Rag2−/− and ChR2-only rats for both the anterior (A.C.) and posterior compartment (P.C.) muscle groups, representing primarily the TA and Gastrocnemius muscles respectively (n = 9 for Rag2−/−, n = 9 for ChR2 only). ChR2-only rat #7 (which had maintained expression at time of euthanasia) was also shown separately and excluded from significance test (PA.C. = 7E-5, PP.C. = 0.06). (d) Normalized ELISA comparing plasma antibodies against ChR2(H134R)-EYFP for WT rats at normal and low dose, Rag2−/− rats at normal dose, and ChR2(H134R) WT rats without reporter (nChR2-EYFP = 4, nChR2-EYFP low = 4, nChR2 only = 3, nRag2−/− = 5). Only ChR2-only rats who had lost all transdermal and subcutaneous expression at the time of blood collection were included. Pleft = 0.002; Pcenter = 0.12; Pright = 0.006. (e) ChR2-EYFP+ axon counts as percentage of total axons in tibial nerve (t.n.) and peroneal nerve (c.p.n.) of tacrolimus and no reporter rats (nTacrolimus = 8, nNoReporter = 9): Pt.n. = 0.02; Pc.p.n. = 4E-3. Tacrolimus rats #3 and #7 (which had lost expression at time of euthanasia), and no reporter rat #7 (which maintained expression at time of euthanasia) were excluded. Sciatic nerve cross sections of representative no reporter rat labeled for ChR2 (green) and DAPI (blue). Scale barbottom = 200 µm, Scale bartop = 30 µm. (f) Number of DAPI+ cells on ipsilateral side compared to contralateral side of spinal cord expressed as a percentage increase for WT (n = 3), Rag2−/− (n = 3), placebo (n = 3), tacrolimus (n = 3), and no reporter rats (n = 5). PANOVA = 8E-3. Can reject the null using Fisher’s LSD at α = 0.01 for ** and α = 0.05 for *.

References

    1. Montgomery KL, et al. Beyond the brain: Optogenetic control in the spinal cord and peripheral nervous system. Sci. Transl. Med. 2016;8:337rv5. doi: 10.1126/scitranslmed.aad7577. - DOI - PubMed
    1. Klapoetke NC, et al. Independent optical excitation of distinct neural populations. Nat. Methods. 2014;11:338–46. doi: 10.1038/nmeth.2836. - DOI - PMC - PubMed
    1. Maimon BE, Sparks K, Srinivasan S, Zorzos AN, Herr HM. Spectrally distinct channelrhodopsins for two-colour optogenetic peripheral nerve stimulation. Nat. Biomed. Eng. 2018;2:485–496. doi: 10.1038/s41551-018-0255-5. - DOI - PubMed
    1. Maimon B, et al. Transdermal optogenetic peripheral nerve stimulation. J. Neural Eng. 2017 doi: 10.1088/1741-2552/aa5e20. - DOI - PubMed
    1. Towne C, Montgomery KL, Iyer SM, Deisseroth K, Delp SL. Optogenetic control of targeted peripheral axons in freely moving animals. PLoS One. 2013;8:e72691. doi: 10.1371/journal.pone.0072691. - DOI - PMC - PubMed

Publication types

MeSH terms

LinkOut - more resources