

TGF-β1 promotes expression of fibrosis-related genes through the induction of histone variant H3.3 and histone chaperone HIRA
- PMID: 30232404
- PMCID: PMC6145928
- DOI: 10.1038/s41598-018-32518-8
TGF-β1 promotes expression of fibrosis-related genes through the induction of histone variant H3.3 and histone chaperone HIRA
Abstract
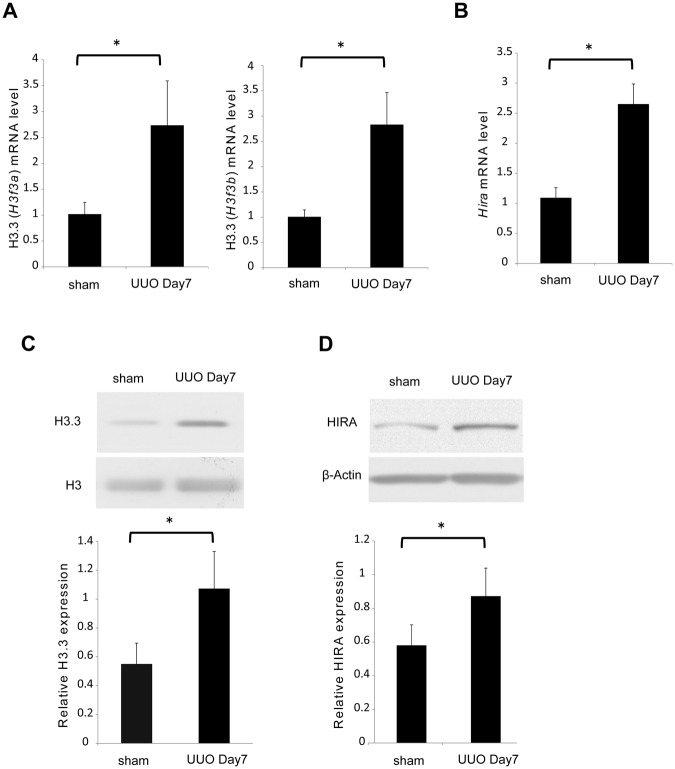
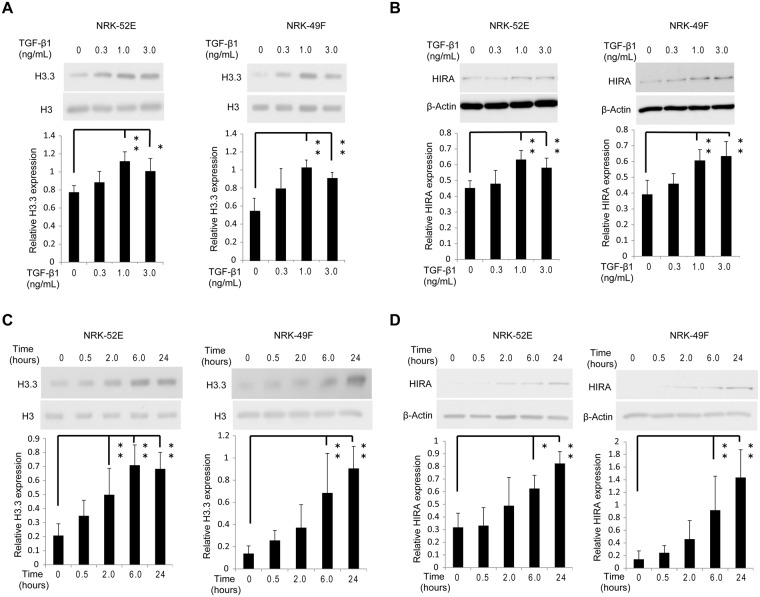
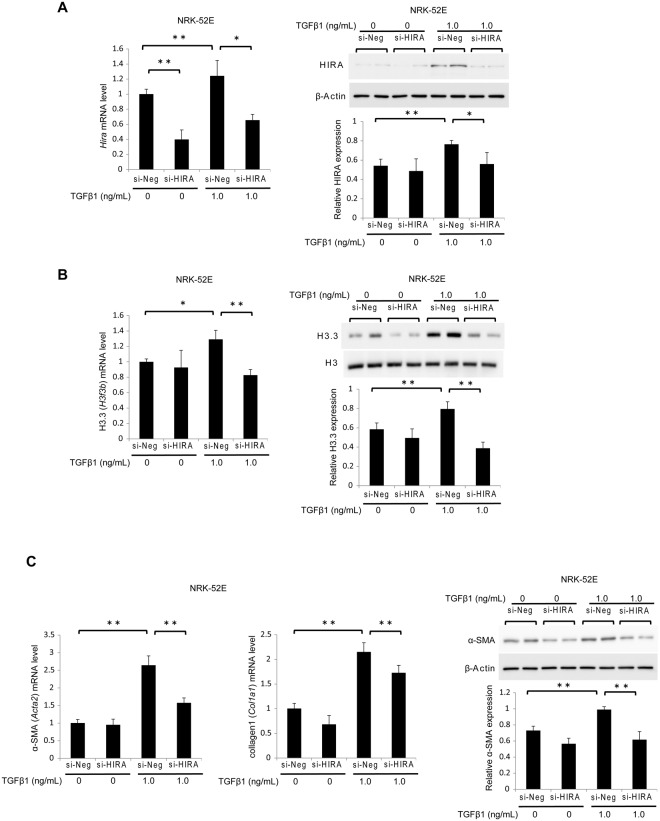
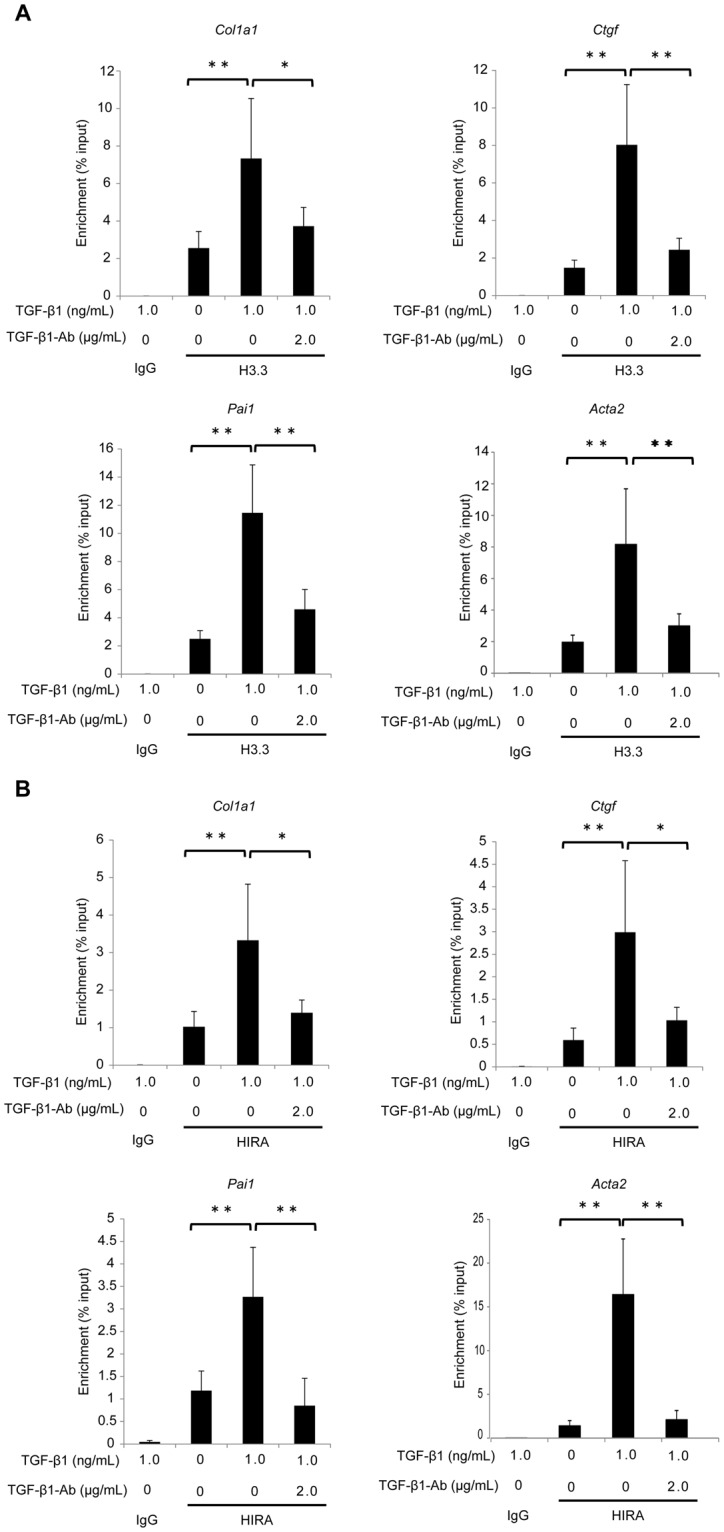
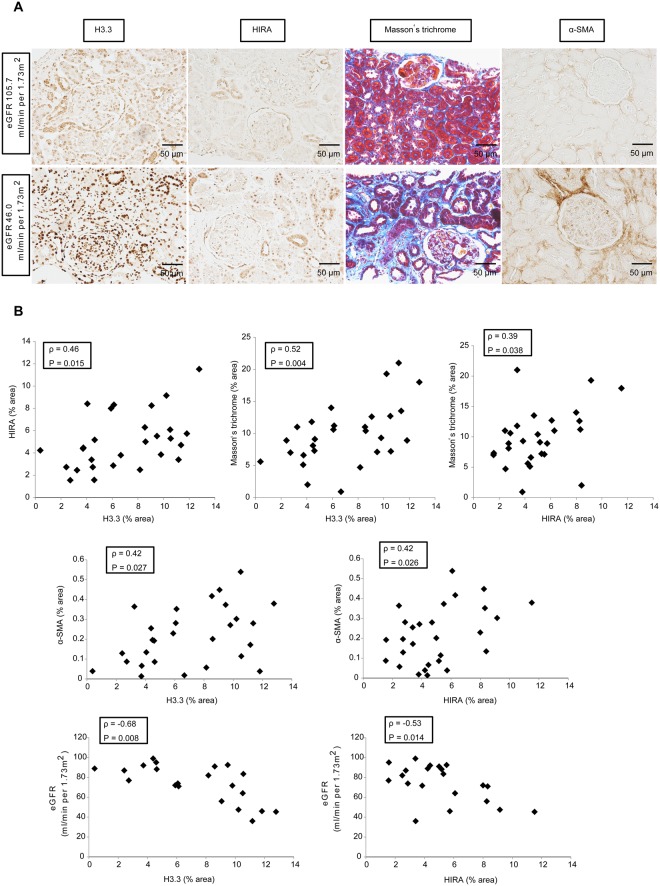
Renal fibrosis is a histological manifestation that occurs in almost every type of chronic kidney disease. Histone variant H3.3 and its chaperone, histone cell cycle regulation defective homolog A (HIRA), serve as epigenetic marks that regulate transcriptional activity. In this study, we assessed the roles of histone H3.3 and HIRA in unilateral ureteral-obstruction (UUO) mice. In UUO mice, the levels of histone H3.3 and HIRA were significantly upregulated in the kidneys. These upregulated levels were decreased by a TGF-β1 neutralizing antibody. TGF-β1 induced histone H3.3 and HIRA expression in vitro via a Smad3-dependent pathway in normal rat kidney (NRK)-52E cells. Additionally, knockdown of HIRA expression decreased histone H3.3 expression and fibrogenesis in NRK-52E cells after TGF-β1 stimulation. Chromatin immunoprecipitation analysis revealed that promoters of fibrosis-related genes were immunoprecipitated with both histone H3.3 and HIRA in NRK-52E cells. Lastly, in human kidney biopsies from patients diagnosed with IgA nephropathy, histone H3.3 and HIRA immunostaining correlated positively with areas of fibrosis and estimated glomerular filtration rate. In conclusion, TGF-β1 induces expression of histone H3.3 and HIRA, which regulates expression of fibrosis-related genes.
Conflict of interest statement
The authors declare no competing interests.
Figures


Similar articles
-
Inhibition of H3K9 histone methyltransferase G9a attenuates renal fibrosis and retains klotho expression.Kidney Int. 2016 Jan;89(1):147-57. doi: 10.1038/ki.2015.291. Epub 2016 Jan 4. Kidney Int. 2016. PMID: 26444031
-
Inhibition of SET Domain-Containing Lysine Methyltransferase 7/9 Ameliorates Renal Fibrosis.J Am Soc Nephrol. 2016 Jan;27(1):203-15. doi: 10.1681/ASN.2014090850. Epub 2015 Jun 4. J Am Soc Nephrol. 2016. PMID: 26045091 Free PMC article.
-
HGF alleviates renal interstitial fibrosis via inhibiting the TGF-β1/SMAD pathway.Eur Rev Med Pharmacol Sci. 2018 Nov;22(22):7621-7627. doi: 10.26355/eurrev_201811_16378. Eur Rev Med Pharmacol Sci. 2018. PMID: 30536302
-
A Molecular Prospective for HIRA Complex Assembly and H3.3-Specific Histone Chaperone Function.J Mol Biol. 2017 Jun 30;429(13):1924-1933. doi: 10.1016/j.jmb.2016.11.010. Epub 2016 Nov 19. J Mol Biol. 2017. PMID: 27871933 Free PMC article. Review.
-
The Histone Variant H3.3 in Transcriptional Regulation and Human Disease.J Mol Biol. 2017 Jun 30;429(13):1934-1945. doi: 10.1016/j.jmb.2016.11.019. Epub 2016 Nov 26. J Mol Biol. 2017. PMID: 27894815 Free PMC article. Review.
Cited by
-
Multi-omics Analysis to Identify Key Immune Genes for Osteoporosis based on Machine Learning and Single-cell Analysis.Orthop Surg. 2024 Nov;16(11):2803-2820. doi: 10.1111/os.14172. Epub 2024 Sep 5. Orthop Surg. 2024. PMID: 39238187 Free PMC article.
-
Obstructive nephropathy and molecular pathophysiology of renal interstitial fibrosis.Physiol Rev. 2023 Oct 1;103(4):2827-2872. doi: 10.1152/physrev.00027.2022. Epub 2023 Jul 13. Physiol Rev. 2023. PMID: 37440209 Free PMC article. Review.
-
Genome-wide CRISPR screen reveals host genes that regulate SARS-CoV-2 infection.bioRxiv [Preprint]. 2020 Jun 17:2020.06.16.155101. doi: 10.1101/2020.06.16.155101. bioRxiv. 2020. Update in: Cell. 2021 Jan 7;184(1):76-91.e13. doi: 10.1016/j.cell.2020.10.028. PMID: 32869025 Free PMC article. Updated. Preprint.
-
Latent disease similarities and therapeutic repurposing possibilities uncovered by multi-modal generative topic modeling of human diseases.Bioinform Adv. 2023 Apr 12;3(1):vbad047. doi: 10.1093/bioadv/vbad047. eCollection 2023. Bioinform Adv. 2023. PMID: 37123453 Free PMC article.
-
Kidney Tissue Proteome Profiles in Short Versus Long Duration of Delayed Graft Function - A Pilot Study in Donation After Circulatory Death Donors.Kidney Int Rep. 2024 Feb 10;9(5):1473-1483. doi: 10.1016/j.ekir.2024.02.012. eCollection 2024 May. Kidney Int Rep. 2024. PMID: 38707804 Free PMC article.
References
Publication types
MeSH terms
Substances
Grants and funding
LinkOut - more resources
Full Text Sources
Other Literature Sources
Miscellaneous
