. 2018 Sep 19;8(1):14045.
doi: 10.1038/s41598-018-32364-8.

Cell-based RNAi screening and high-content analysis in primary calvarian osteoblasts applied to identification of osteoblast differentiation regulators

Affiliations

Cell-based RNAi screening and high-content analysis in primary calvarian osteoblasts applied to identification of osteoblast differentiation regulators

Mubashir Ahmad et al. Sci Rep. .

Abstract

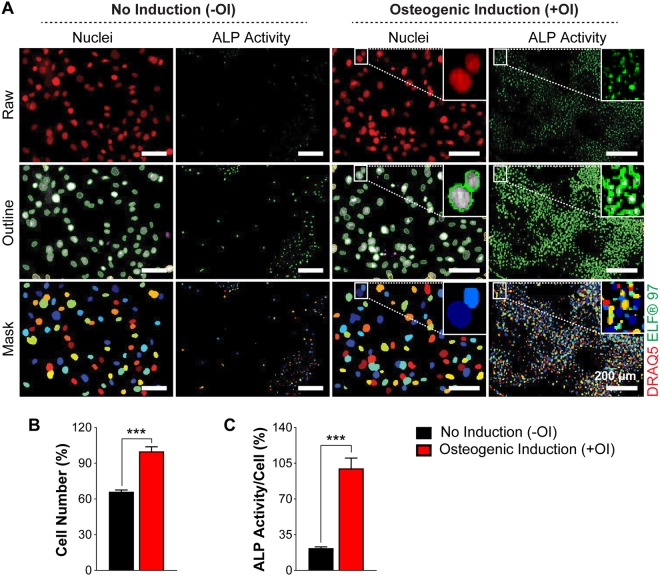
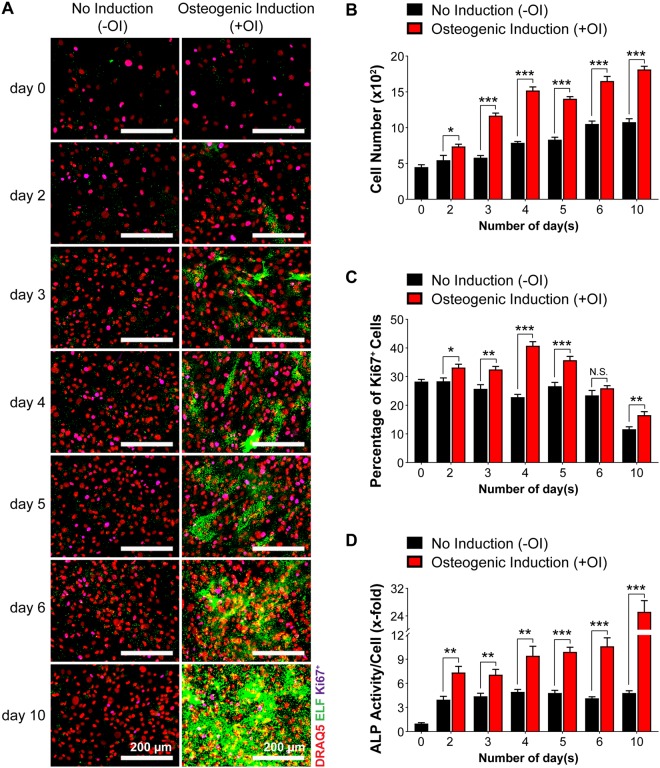
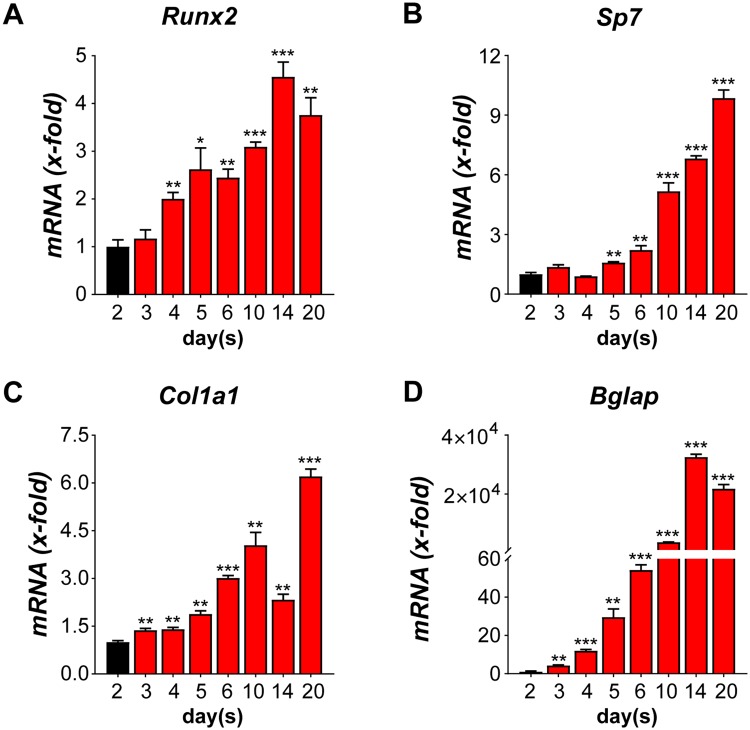
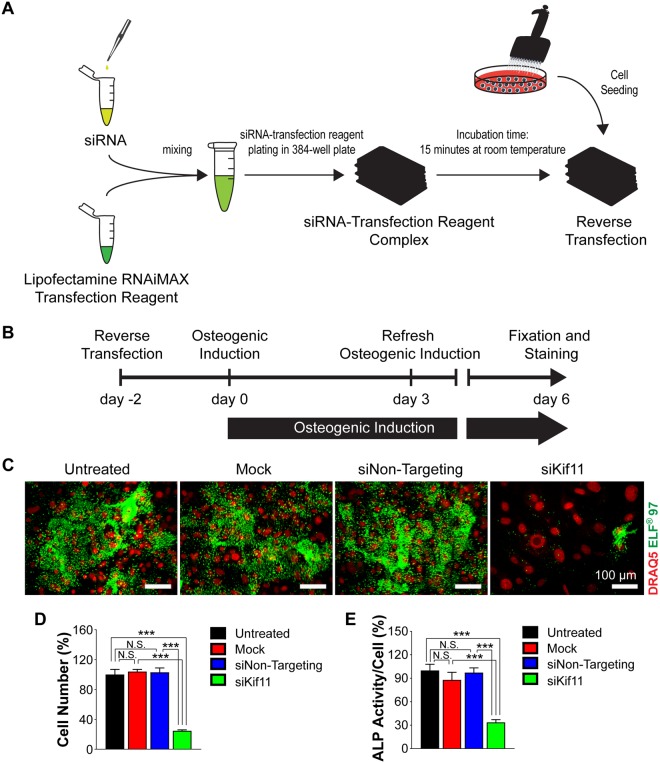
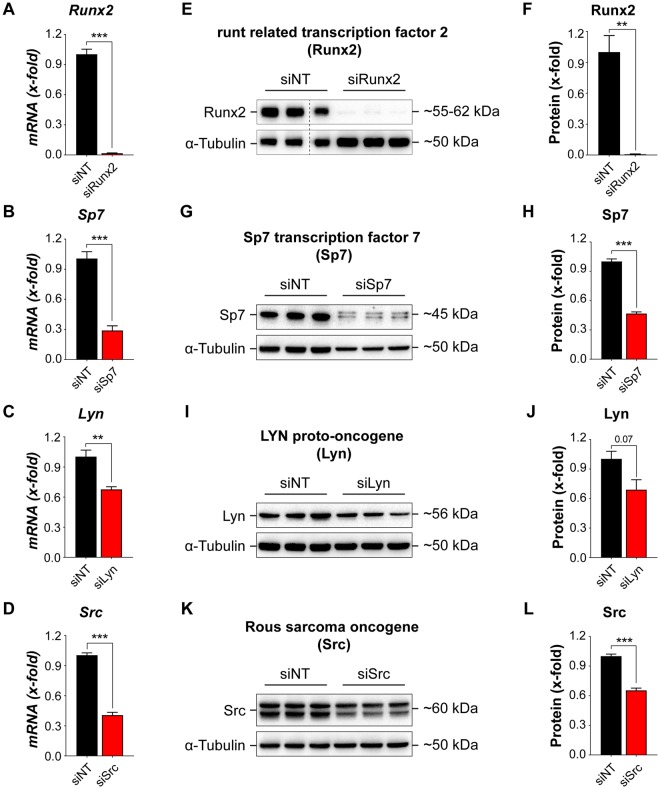
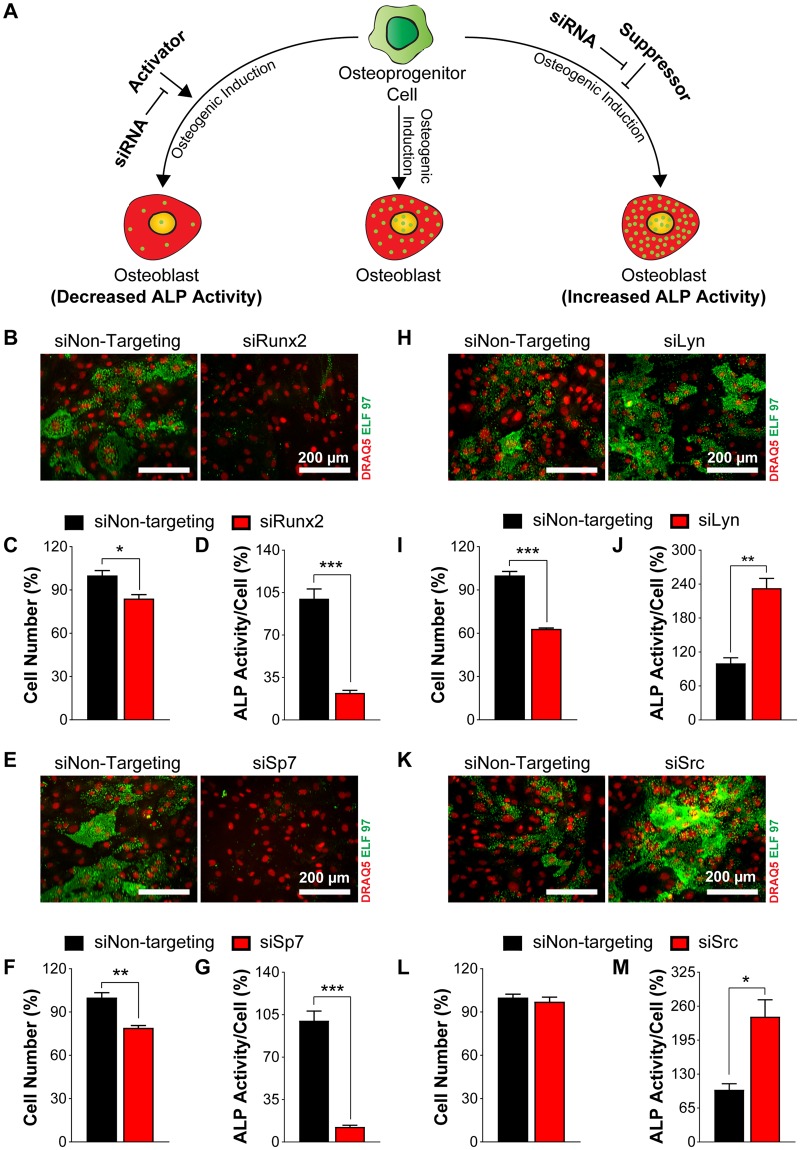
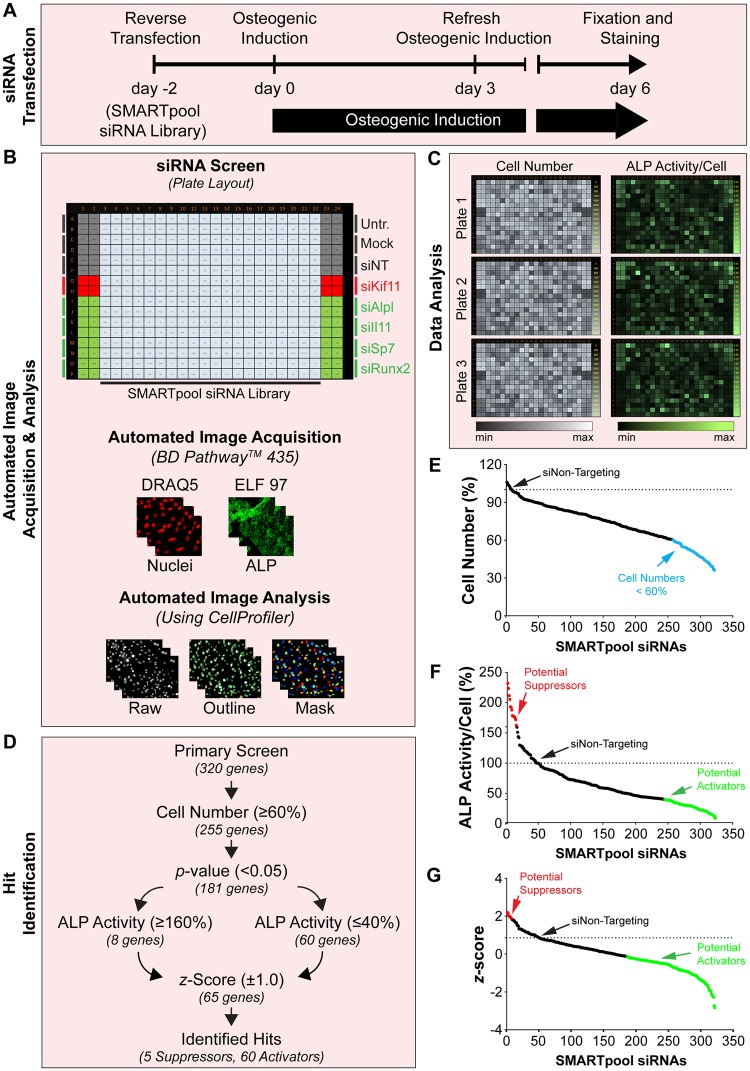
Osteoblasts are responsible for the maintenance of bone homeostasis. Deregulation of their differentiation is etiologically linked to several bone disorders, making this process an important target for therapeutic intervention. Systemic identification of osteoblast regulators has been hampered by the unavailability of physiologically relevant in vitro systems suitable for efficient RNAi and for differentiation read-outs compatible with fluorescent microscopy-based high-content analysis (HCA). Here, we report a new method for identification of osteoblast differentiation regulators by combining siRNA transfection in physiologically relevant cells with high-throughput screening (HTS). Primary mouse calvarial osteoblasts were seeded in 384-well format and reverse transfected with siRNAs and their cell number and differentiation was assayed by HCA. Automated image acquisition allowed high-throughput analyses and classification of single cell features. The physiological relevance, reproducibility, and sensitivity of the method were validated using known regulators of osteoblast differentiation. The application of HCA to siRNAs against expression of 320 genes led to the identification of five potential suppressors and 60 activators of early osteoblast differentiation. The described method and the associated analysis pipeline are not restricted to RNAi-based screening, but can be adapted to large-scale drug HTS or to small-scale targeted experiments, to identify new critical factors important for early osteoblastogenesis.


Conflict of interest statement

The authors declare no competing interests.

Figures

Figure 1
Figure 1
Representative images of undifferentiated (−OI) and differentiated (+OI) primary calvarial osteoblasts, and their cell identification and segmentation using CellProfiler. (A) The upper panel shows raw images of nuclei and alkaline phosphatase (ALP) staining of −OI and +OI condition in primary calvarial osteoblasts, stained with DRAQ5 (red) and ELF 97 (green) respectively. The middle panel depicts the outline of the nuclear and ALP staining of −OI and +OI treated primary calvarial osteoblasts. The lower panel shows the segmentation of nuclei and ALP by CellProfiler software from −OI and +OI exposed primary calvarial osteoblasts. The segmentation can be visualized by differences in colors between adjacent cells, in both nuclear and ALP channels (lower panel). (B, C) Percent cell numbers and cellular ALP activity in −OI and +OI conditions. Data are expressed as mean ± SEM (n = 6). Scale bar: 200 µm. *p < 0.05, **p < 0.01, ***p < 0.001.
Figure 2
Figure 2
Quantification of alkaline phosphatase (ALP) activity and cellular proliferation during different stages of differentiation in primary calvarial osteoblasts.Primary calvarial osteoblasts were seeded in (A) 384-well plate and were grown up to 80% confluency. Subsequently, the cells were cultured either in the absence (−OI) or presence (+OI) of osteogenic induction medium for days indicated. (A) Cells were stained with DRAQ5 (red), Ki67 (purple), and ELF 97 (green) for nuclear, proliferative, and ALP staining respectively. (B) Quantification of cells shown in (A). (C) Percentage of Ki67+ cells (D) fold change in cellular ALP activity for −OI and +OI conditions at different time points. Data are expressed as mean ± SEM (n = 8). Scale bar: 200 µm. *p < 0.05, **p < 0.01, ***p < 0.001.
Figure 3
Figure 3
Expression of osteoblast-specific marker genes during osteoblast differentiation in primary calvarial osteoblasts. Expression of marker genes on specified days (A) Runx2, (B) Sp7, (C) Col1a1, and (D) Bglap. Data are expressed as mean ± SEM (n = 3). *p < 0.05, **p < 0.01, ***p < 0.001.
Figure 4
Figure 4
The efficiency of siRNA knockdown eight days after transfection in primary calvarial osteoblasts. (A) Scheme showing reverse transfection strategy. (B) Timeline showing the series of treatments during osteoblast differentiation in primary osteoblasts. (C) Representative microscopic images of primary osteoblasts showing DRAQ5 nuclear staining (red spheres) and ELF staining (green spots) after different treatments: untreated (media only), mock (transfection reagent only), siNon-Targeting (both siRNA and transfection reagent) and siKif11. (D,E) Percent cell numbers and cellular ALP activity after the treatments indicated in (C). Data are expressed as mean ± SEM (n = 6). Scale bar: 100 µm. *p < 0.05, **p < 0.01, ***p < 0.001.
Figure 5
Figure 5
siRNA knockdown of known regulators of osteoblast differentiation in primary calvarial osteoblasts. Quantitative real-time PCR analysis of genes after siRNA knockdown for 8 days: (A) Runx2, (B) Sp7, (C) Lyn, and (D) Src. Western blot analysis of respective genes after siRNA knockdown for eight days: (E,F) Runx2 (the empty lane has been cropped, as shown with the dotted line, For original, see Supplementary Fig. S5). (G,H) Sp7, (I,J) Lyn, and (K,L) Src. Data are expressed as mean ± SEM (n = 3). *p < 0.05, **p < 0.01, ***p < 0.001.
Figure 6
Figure 6
siRNA knockdown of known regulators modulates osteoblast differentiation in primary calvarial osteoblasts. (A) Scheme showing consequence of siRNA knockdown of regulators on osteoblast differentiation. (B,E) Representative microscopic images of DRAQ5 and ELF 97 stained cells after siRNA treatment against Sp7 and Runx2 using DRAQ5 (red) and ELF 97 (green) for nuclear and ALP staining, respectively. (C,F) Percentage of cell number after Runx2 and Sp7 siRNA knockdown, respectively. (D,G) Percent cellular ALP activity after Runx2 and Sp7 siRNA knockdown, respectively. (H,K) Representative microscopic images of DRAQ5 and ELF 97 stained cells after siRNA treatment against Lyn and Src, using DRAQ5 (red) and ELF 97 (green) for nuclear and ALP staining, respectively. (I,L) Percentage cell number after Lyn and Src siRNA knockdown respectively. (J,M) Percent cellular ALP activity after Lyn and Src siRNA knockdown respectively. Data are expressed as mean ± SEM (n = 3). Scale bar: 200 µM. *p < 0.05, **p < 0.01, ***p < 0.001.
Figure 7
Figure 7
High-content analysis of a siRNA library plate to identify novel regulators of osteoblast differentiation.(A) Scheme showing reverse transfection and osteoblast differentiation strategy of SMARTpool siRNA library. (B) Plate layout for the siRNA screen and automated image acquisition and analysis setup. (C) Heatmap table for determining the reproducibility of the screening plate in triplicates. The heatmap table depicts cell numbers (minimum-maximum threshold: scale from 0–6000 cells, shown on right side of each plate) and ALP fluorescence intensity per cell (minimum-maximum threshold: scale from 0–3.75, shown on right side of each plate). (D) Scheme showing the criteria’s employed for hit identification. (E) Percentage of cell number of screened genes in the form of a rank plot (light blue dots represent siRNAs affecting cell number <60%). (F) Percentage of cellular ALP activity of siRNAs screened in the form of a rank plot (red dots represent siRNAs increasing ALP ≥160%, green dots represent siRNAs decreasing ALP ≤40%). (G) The z-Score ( ± 1.0 compared to Non-Targeting control) of screened genes in the form of a rank plot (red dots represent siRNAs with higher z-score ± 1.86, green dots represent siRNAs with lower z-score ± −0.14). The screening was done in triplicates.

Similar articles

Cited by

References

    1. Qiang Y-W, et al. On the Molecular Mechanism of DKK1 Inhibition of Osteoblast Differentiation in Multiple Myeloma. Blood. 2006;108:3429–3429.
    1. Glorieux, F. H. Osteogenesis imperfecta. A disease of the osteoblast. Lancet (London, England)358 Suppl, S45 (2001). - PubMed
    1. Giuliani N, Rizzoli V, Roodman GD. Multiple myeloma bone disease: Pathophysiology of osteoblast inhibition. Blood. 2006;108:3992–3996. doi: 10.1182/blood-2006-05-026112. - DOI - PubMed
    1. Marie PJ. Osteoblast dysfunctions in bone diseases: from cellular and molecular mechanisms to therapeutic strategies. Cellular and molecular life sciences: CMLS. 2015;72:1347–1361. doi: 10.1007/s00018-014-1801-2. - DOI - PMC - PubMed
    1. Westendorf JJ, Kahler RA, Schroeder TM. Wnt signaling in osteoblasts and bone diseases. Gene. 2004;341:19–39. doi: 10.1016/j.gene.2004.06.044. - DOI - PubMed

Publication types

Substances

LinkOut - more resources