. 2018 Oct;562(7728):578-582.
doi: 10.1038/s41586-018-0543-y. Epub 2018 Sep 19.

Clearance of senescent glial cells prevents tau-dependent pathology and cognitive decline

Affiliations

Clearance of senescent glial cells prevents tau-dependent pathology and cognitive decline

Tyler J Bussian et al. Nature. 2018 Oct.

Abstract

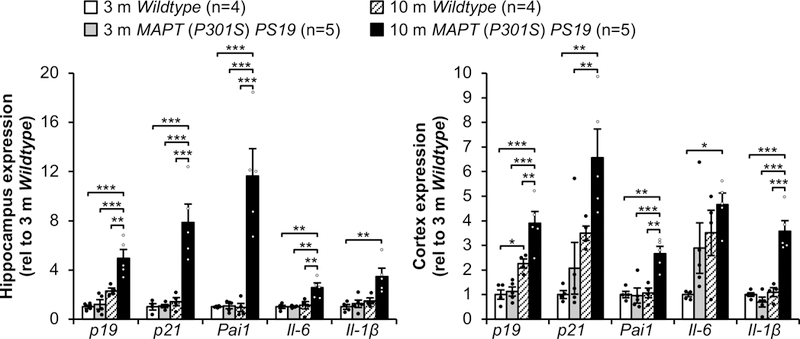
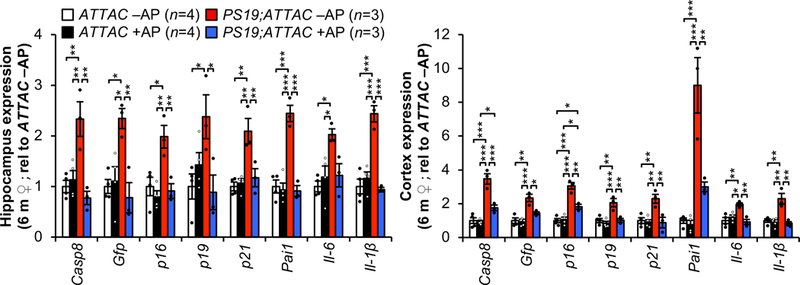
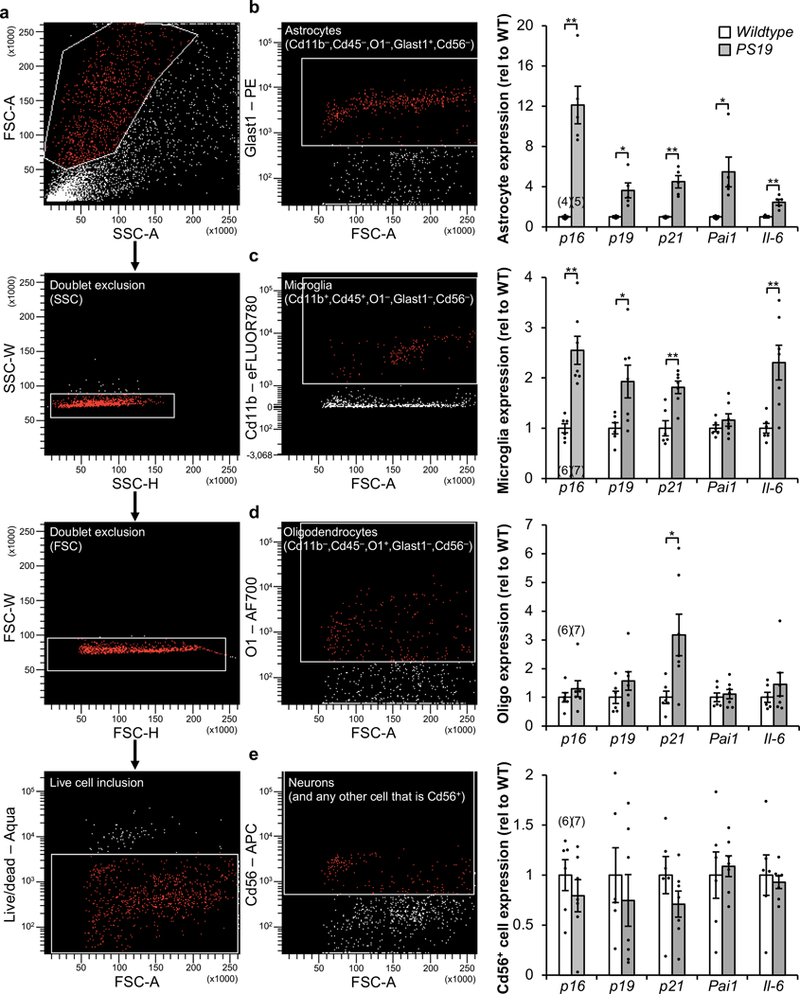
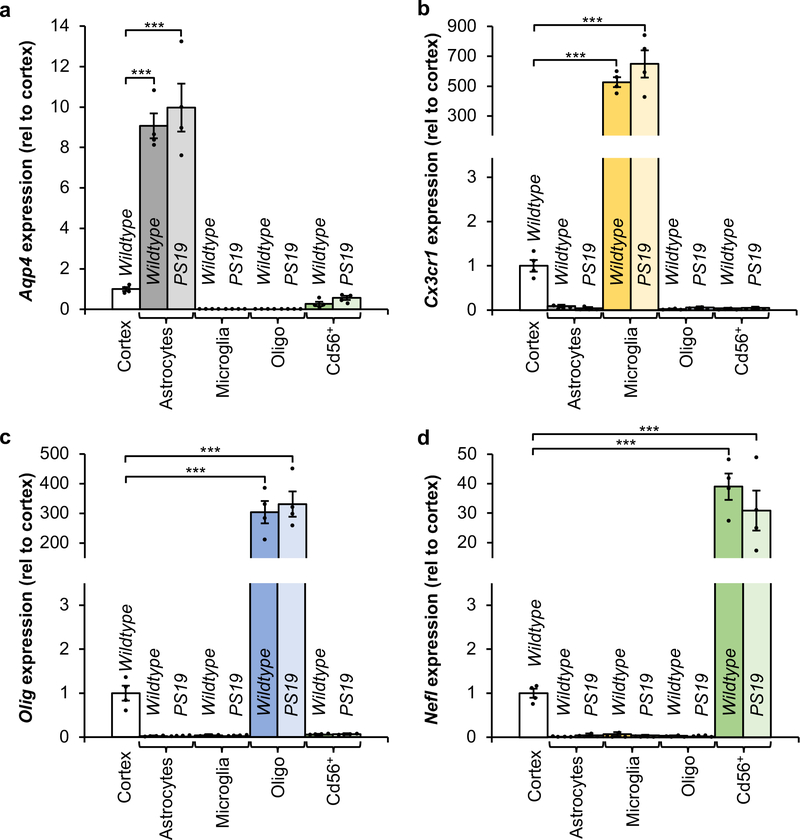
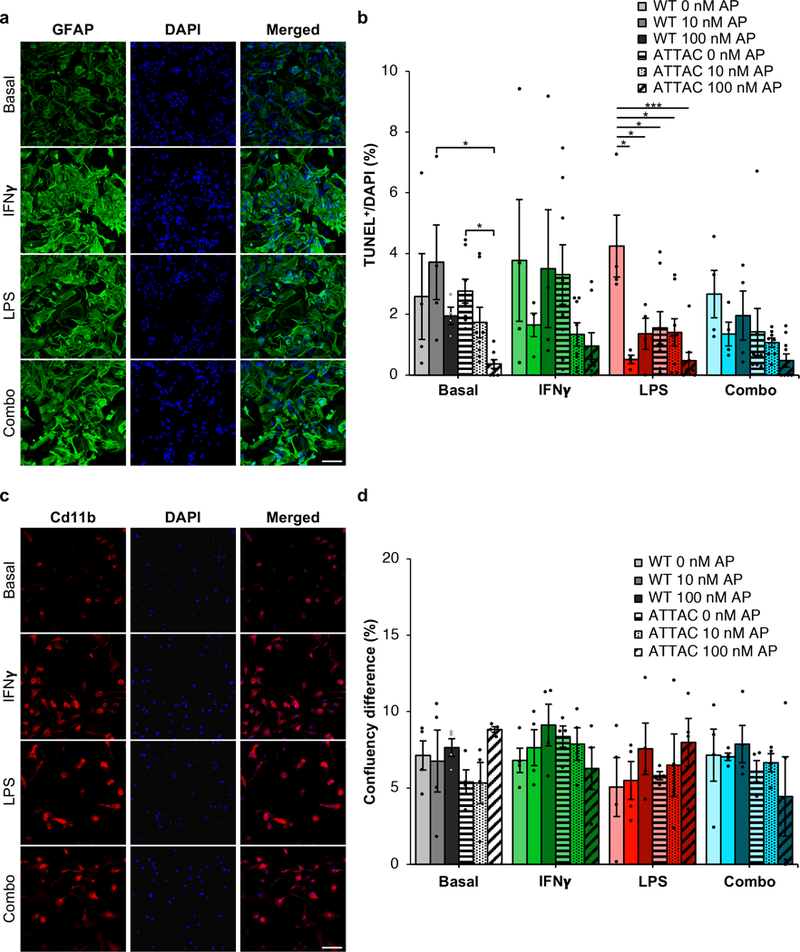
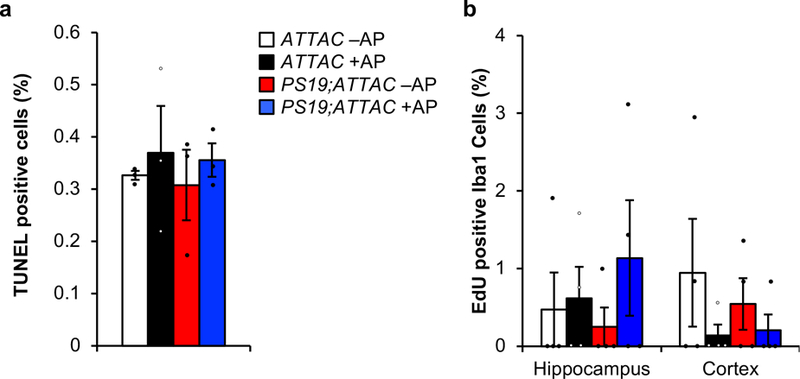
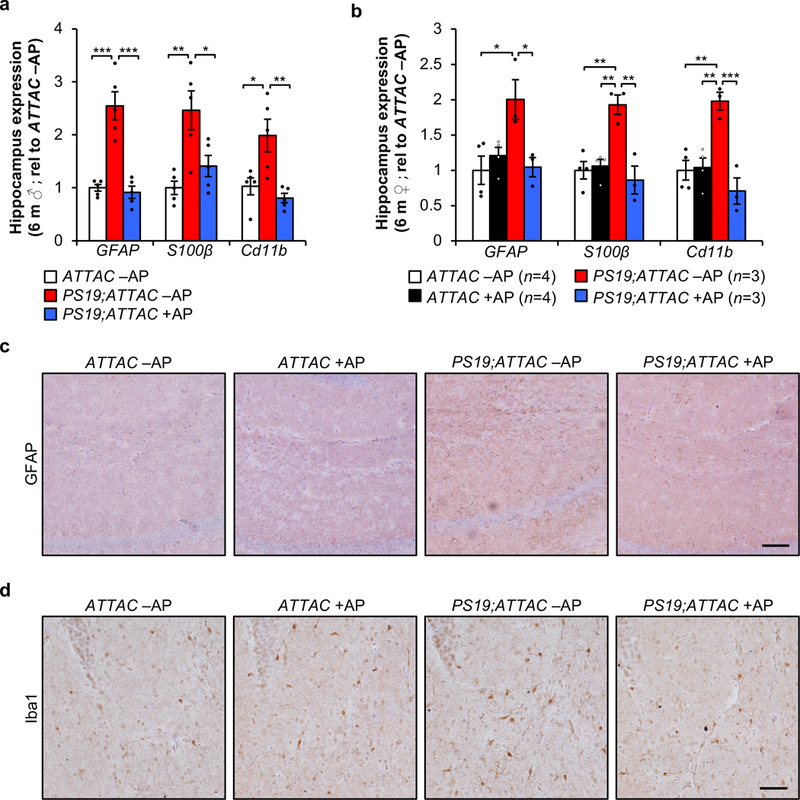
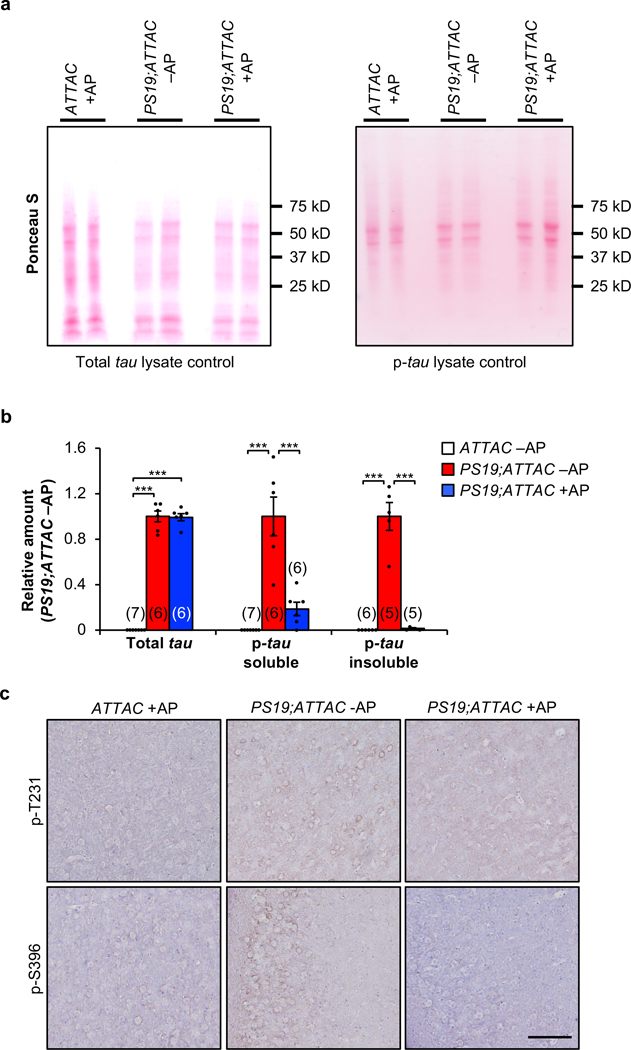
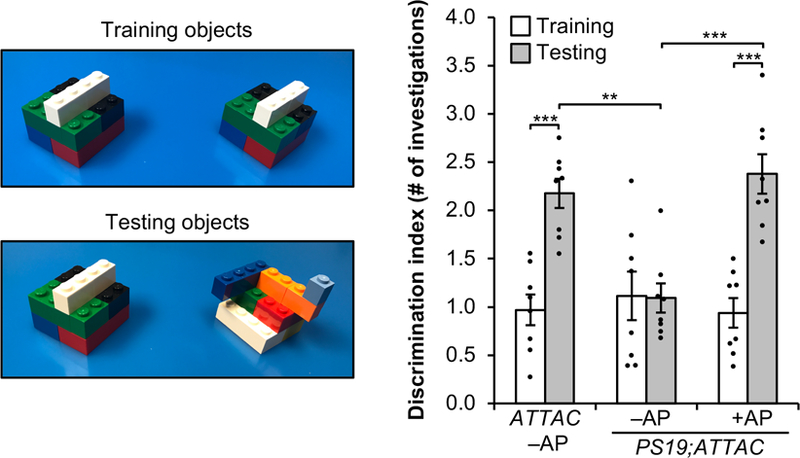
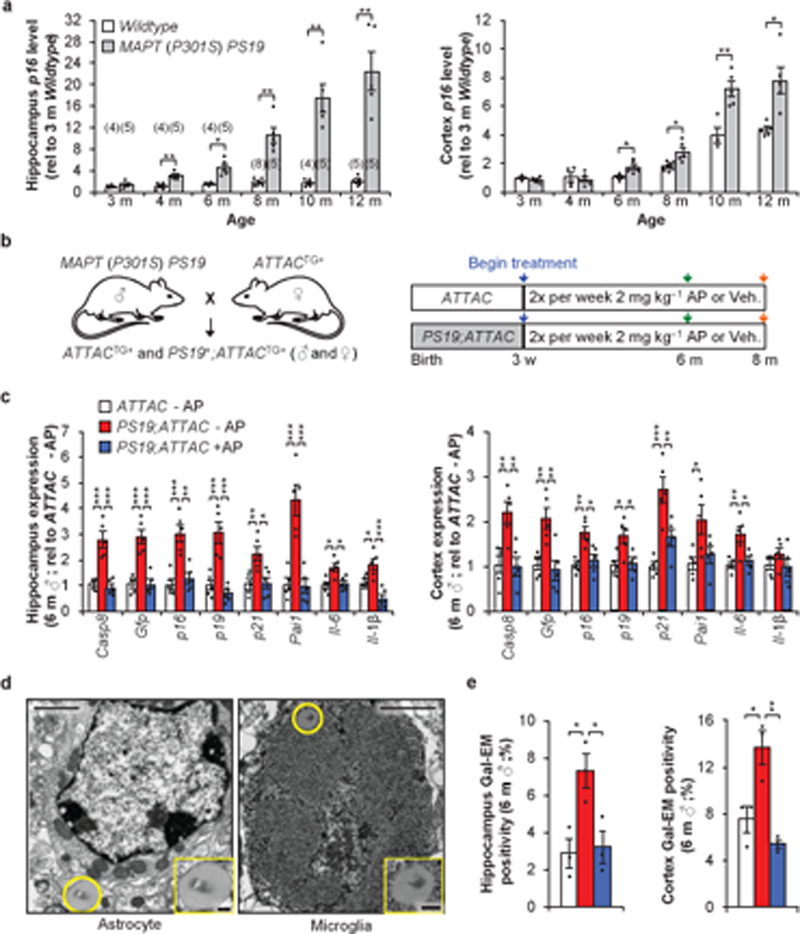
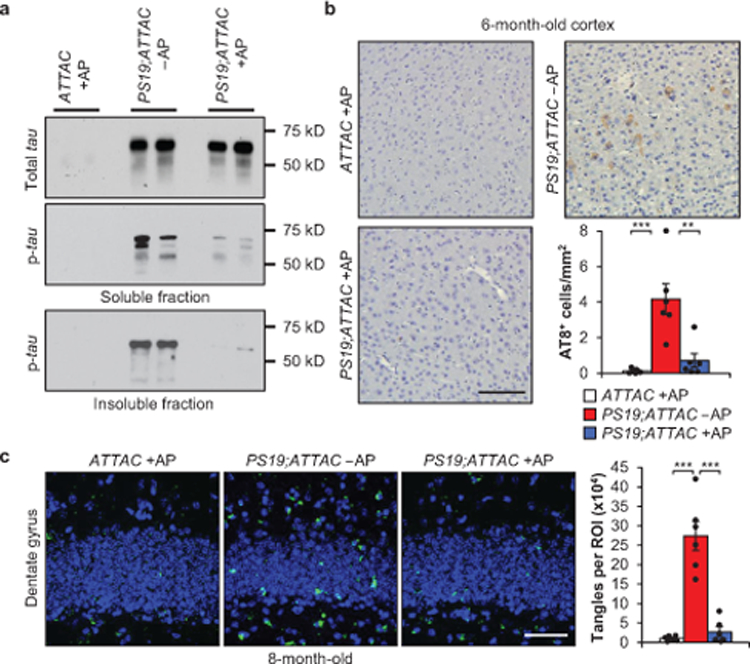
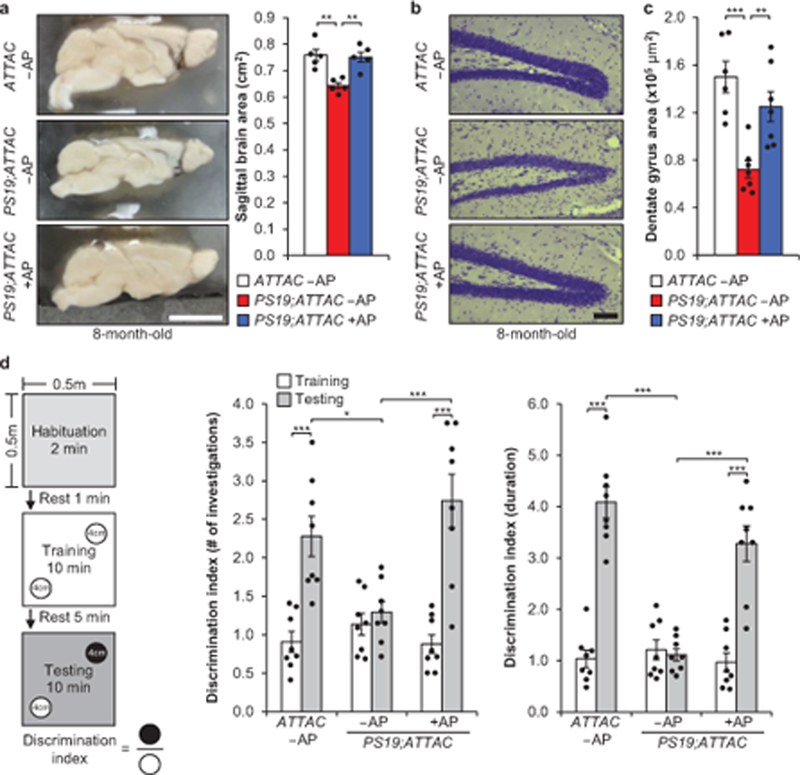
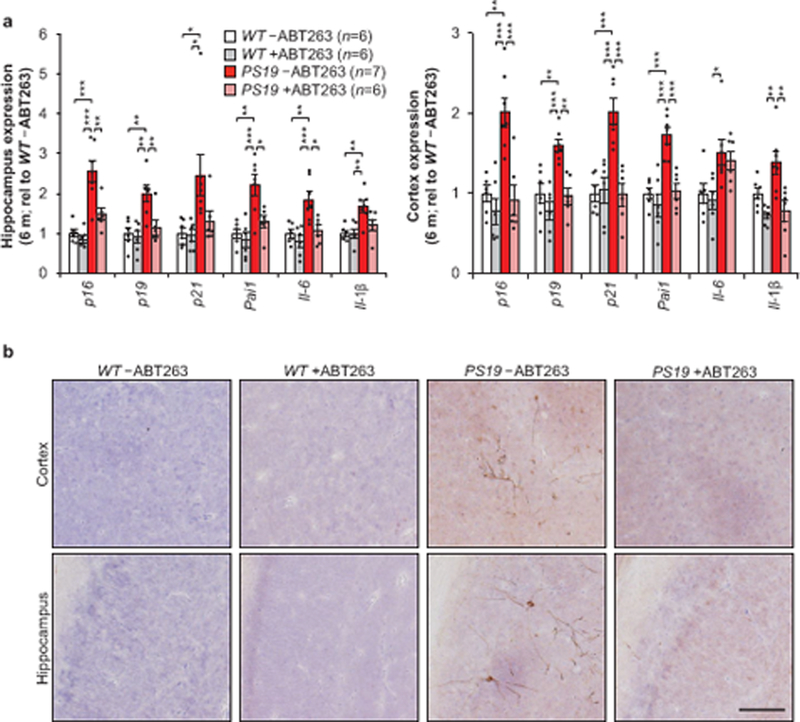
Cellular senescence, which is characterized by an irreversible cell-cycle arrest1 accompanied by a distinctive secretory phenotype2, can be induced through various intracellular and extracellular factors. Senescent cells that express the cell cycle inhibitory protein p16INK4A have been found to actively drive naturally occurring age-related tissue deterioration3,4 and contribute to several diseases associated with ageing, including atherosclerosis5 and osteoarthritis6. Various markers of senescence have been observed in patients with neurodegenerative diseases7-9; however, a role for senescent cells in the aetiology of these pathologies is unknown. Here we show a causal link between the accumulation of senescent cells and cognition-associated neuronal loss. We found that the MAPTP301SPS19 mouse model of tau-dependent neurodegenerative disease10 accumulates p16INK4A-positive senescent astrocytes and microglia. Clearance of these cells as they arise using INK-ATTAC transgenic mice prevents gliosis, hyperphosphorylation of both soluble and insoluble tau leading to neurofibrillary tangle deposition, and degeneration of cortical and hippocampal neurons, thus preserving cognitive function. Pharmacological intervention with a first-generation senolytic modulates tau aggregation. Collectively, these results show that senescent cells have a role in the initiation and progression of tau-mediated disease, and suggest that targeting senescent cells may provide a therapeutic avenue for the treatment of these pathologies.


Figures

Extended Data Figure 1.
Extended Data Figure 1.. Senescent cells accumulate in PS19 mice.
RT-qPCR analysis for senescence-associated genes in hippocampi (left) and cortices (right) of 3- and 10-month-old male mice (animal numbers indicated in the legend, 2 independent experiments; normalized to 3 m Wildtype group). Data are mean ± s.e.m. *P < 0.05; **P < 0.01; ***P < 0.001 (one-way ANOVA with Tukey’s multiple comparisons test). Exact P values can be found in the accompanying source data file.
Extended Data Figure 2.
Extended Data Figure 2.. AP-mediated clearance selectively removes senescent cells that accumulate in brains of PS19;ATTAC mice.
Expression of senescence markers from 6-month-old female hippocampus (left) and cortex (cortex) either vehicle (–AP) or AP20187 (+AP) treated assessed by RT-qPCR (animal numbers indicated in the legend; normalized to ATTAC –AP group). p21 is also known as Cdkn1a; Pai1 is also known as Serpine1. Data are mean ± s.e.m. *P < 0.05; **P < 0.01; ***P < 0.001 (one-way ANOVA with Tukey’s multiple comparisons test). Exact P values can be found in the accompanying source data file.
Extended Data Figure 3.
Extended Data Figure 3.. Neurons do not exhibit X-Gal crystals by Gal-TEM.
Representative electron microscopy image of neurons after SA-β-Gal staining from a 6-month-old vehicle-treated PS19;ATTAC male mouse (n = 3 male mice, 2 independent experiments). The image has been artificially colored to denote individual cell bodies. Scale bar: 10 µm.
Extended Data Figure 4.
Extended Data Figure 4.. Increased senescence-associated gene expression is observed in astrocytes and microglia isolated from PS19 mice.
a–e, Gating strategy (a) for FACS isolation of living astrocytes (b), microglia (c), oligodendrocytes (d), and neuron-enriched Cd56+ cells (e) from cortices from 6-month-old WT and PS19 mice. b, Astrocyte (Cd11b,Cd45,O1,GLAST+,Cd56) fraction (left) and RT-qPCR analysis (right). c, Microglia (Cd11b+,Cd45+,O1,GLAST+,Cd56) fraction (left) and RT-qPCR analysis (right). d, Oligodendrocyte (Cd11b,Cd45,O1+,GLAST,Cd56) fraction (left) and RT-qPCR analysis (right). e, Neuron-enriched Cd56+ (Cd11b,Cd45,O1,GLAST,Cd56+) fraction (left) and RT-qPCR analysis (right). p21 is also known as Cdkn1a; Pai1 is also known as Serpine1. Individual numbers of independent animal cell population isolations are indicated in the parentheses above p16Ink4a columns (2 independent experiments). Data are mean ± s.e.m. *P < 0.05; **P < 0.01 (unpaired two-sided t-tests with Welch’s correction). Exact P values can be found in the accompanying source data file.
Extended Data Figure 5.
Extended Data Figure 5.. Cell identity verification of cell populations isolated by FACS.
a–d, RT-qPCR analysis for cell identity markers from cell populations isolated from 6-month-old Wildtype and PS19 mice for Aqp4 expression enriched in astrocytes (a), Cx3cr1 expression enriched in microglia (b), Olig expression enriched in oligodendrocytes (c), and Nefl expression enriched in neurons (d). Expression is normalized to intact cortices of 6-month-old Wildtype mice (n = 4 biologically independent cell isolations for each group, 2 independent experiments). Data are mean ± s.e.m. ***P < 0.001 (one-way ANOVA with Tukey’s multiple comparisons test). Exact P values can be found in the accompanying source data file.
Extended Data Figure 6.
Extended Data Figure 6.. AP administration does not precociously eliminate non-senescent glial cells isolated from ATTAC mice.
a, Cd11b staining of primary microglia treated with IFNγ (200 ng/ml), LPS (100 ng/ml), or a combination of both (n = 3 biologically independent samples). b, Quantification of TUNEL positive bodies in basal or activated microglia (n = 4 WT and 8 ATTAC cultures for each treatment group, 2 independent experiments). c, GFAP staining of primary astrocytes treated with IFNγ, LPS, or a combination of both as described in (a) (n = 3 biologically independent samples). d, Quantification of confluency change over 24 hours in basal or activated astrocytes (n = 4 biologically independent cultures of each genotype and treatment). Scale Bars, 100 μm (a and c). Data are mean ± s.e.m. *P < 0.05; ***P < 0.001 (one-way ANOVA with Tukey’s multiple comparisons test (b and d)). Exact P values can be found in the accompanying source data file.
Extended Data Figure 7.
Extended Data Figure 7.. AP-administration does not broadly eliminate cells or increase proliferation of microglia.
a, Quantification of TUNEL positive bodies (as a percentage of all cells) at the transition between the CA2 and CA3 within the hippocampus after a short-term AP administration in 6-month-old mice (n = 3 mice per genotype and treatment group). b, Quantification of Iba1/EdU double positive cells in hippocampus and cortex from 6-month-old mice administered AP beginning at weaning age (n = 4 mice per genotype and treatment group). Data are mean ± s.e.m. We note that no comparison is statistically significant (one-way ANOVA with Tukey’s multiple comparisons test). Exact P values can be found in the accompanying source data file.
Extended Data Figure 8.
Extended Data Figure 8.. Senescent cells promote gliosis.
a, RT-qPCR analysis for Gfap, S100β, and Cd11b in hippocampi of 6-month-old male mice (n = 5 mice per group; normalized to ATTAC –AP group). b, RT-qPCR analysis as in (a) in hippocampi of 6-month-old female mice (animal number indicated in legend; normalized to ATTAC –AP group). c, Representative Gfap IHC staining in the hippocampus of 6-month-old vehicle and AP-treated ATTAC and PS19;ATTAC female mice (n = 4 mice per group, 2 independent experiments). d, Representative Iba1 staining in the hippocampus of 6-month-old vehicle and AP-treated ATTAC and PS19;ATTAC female mice (n = 4 mice per group, 2 independent experiments). Scale bar, 100 µm (c) and 50 µm (d). Data are mean ± s.e.m. *P < 0.05; **P < 0.01; ***P < 0.001 (one-way ANOVA with Tukey’s multiple comparisons test). Exact P values can be found in the accompanying source data file.
Extended Data Figure 9.
Extended Data Figure 9.. AP treatment attenuates tau phosphorylation.
a, Ponceau S loading controls for western blot lysates of 6-month-old whole brain total-tau (left) and phosphorylated tau (S202/T205; right) shown in Figure 3a. b, Quantification of westerns blot analysis from 6-month-old whole brain for soluble tau (left), soluble phosphorylated tau (S202/T205; middle), and insoluble phosphorylated tau (S202/T205; right). Biologically independent animal numbers are indicated, data are from ≥ 3 independent experiments. c, Immunostaining of 6-month-old cortex for phosphorylated tau protein at T231 (top) and S396 (bottom; n = 4 mice per group, 2 independent experiments). Scale bar, 100µm. Data are mean ± s.e.m. ***P < 0.001 (one-way ANOVA with Tukey’s multiple comparisons test). Exact P values can be found in the accompanying source data file.
Extended Data Figure 10.
Extended Data Figure 10.. Vision-based novel object discrimination remains intact in AP-treated PS19;ATTAC mice.
Objects used for novel object recognition during the training and testing phase for visual discrimination (left) and the average ratio for the number of investigations (right, n = 8 female mice per group). Data are mean ± s.e.m. **P < 0.01; ***P < 0.001 (two-way ANOVA with Tukey’s multiple comparisons test). Exact P values can be found in the accompanying source data file.
Figure 1.
Figure 1.. Senescent astrocytes and microglia that accumulate in brains of P301S (MAPT) PS19 mice can be removed using the INK-ATTAC transgene.
a, RT-qPCR analysis for p16Ink4a expression in hippocampus (left) and cortex (right) from Wildtype and P301S (MAPT) PS19 mice (animal numbers for each column are indicated in parentheses of hippocampus graph, 2 independent experiments; normalized to 3 m Wildtype group). b, Study design for clearance of senescent cells in PS19;ATTAC mice. Abbreviations: AP – AP20187; Veh. – vehicle. c, Expression of senescence markers from 6-month-old male hippocampus (left) and cortex (cortex) either vehicle (–AP) or AP20187 (+AP) treated assessed by RT-qPCR (n = 5 mice per group; normalized to ATTAC –AP group). p21 is also known as Cdkn1a; Pai1 is also known as Serpine1. d, Electron micrograph showing an X-Gal-positive astrocyte (left) and microglia (right) following SA-β-Gal staining from a 6-month-old vehicle-treated PS19;ATTAC male. e, Quantification of cells containing X-Gal crystals in the hippocampus (left) or cortex (right; n = 3 male mice per group, 2 independent experiments). Legend is as in (c). Scale bars, 1 μm (d) and 200 nm (d, insets). Data are mean ± s.e.m. *P < 0.05; **P < 0.01; ***P < 0.001 (unpaired two-sided t-tests with Welch’s correction (a) and one-way ANOVA with Tukey’s multiple comparisons test (c and e)). Exact P values can be found in the accompanying source data file.
Figure 2.
Figure 2.. Senescent cells promote insoluble tau aggregates.
a, Representative western blot (≥ 3 independent experiments) analysis of 6-month-old whole brain for soluble tau (top), soluble phosphorylated tau (S202/T205; middle), and insoluble phosphorylated tau (S202/T205; bottom). b, Immunostaining and quantification of cortex sections for phosphorylated tau (S202/T205) protein aggregates (n = 6 mice per group, 3 independent experiments). c, Thioflavin S staining and quantification for neurofibrillary tangles located within the dentate gyrus (n = 6 mice per group, 2 independent experiments; normalized to ATTAC +AP group). Key is as indicated in b. Scale bars, 100 μm (b) and 50 μm (c). Data are mean ± s.e.m. **P < 0.01; ***P < 0.001 (one-way ANOVA with Tukey’s multiple comparisons test). Exact P values can be found in the accompanying source data file. For gel source data, see Supplementary Figure 1.
Figure 3.
Figure 3.. Senescent cells drive neurodegenerative disease.
a, Sagittal midline brain area of 8-month-old mice (n = 5 males per group, 2 independent experiments). b, Nissl stains of the dentate gyrus from 8-month-old mice. c, Average area of the dentate gyrus (measuring the pyramidal neuron layer) from serial, coronal NeuN-stained free-floating sections (n = 6 ATTAC –AP and n = 7 PS19;ATTAC –AP and PS19;ATTAC +AP mice, 2 independent experiments). d, Novel object recognition experiment setup and average ratio for the number of investigations and duration of those investigations (n = 8 female mice per group). Scale bars, 0.5 cm (a) and 100 μm (b). Data are mean ± s.e.m. *P < 0.05; **P < 0.01; ***P < 0.001 (one-way ANOVA with Tukey’s multiple comparisons test (a and c) and two-way ANOVA with Tukey’s multiple comparisons test (d)). Exact P values can be found in the accompanying source data file.
Figure 4.
Figure 4.
ABT263 can modulate senescent cells and attenuate tau phosphorylation. a, Expression of senescence markers from 6-month-old hippocampus (left) and cortex (cortex) either vehicle (–ABT263) or ABT263 (+ABT263) treated assessed by RT-qPCR (animal numbers indicated in the legend; normalized to WT –ABT263 group). p21 is also known as Cdkn1a; Pai1 is also known as Serpine1. b, Representative immunostaining of cortex (top) and hippocampal (bottom) sections for phosphorylated tau (S202/T205) protein aggregates (n = 4 mice per group, 2 independent experiments). Scale bar, 100µm. Data are mean ± s.e.m. *P < 0.05; **P < 0.01; ***P < 0.001 (one-way ANOVA with Tukey’s multiple comparisons test). Exact P values can be found in the accompanying source data file.

Comment in

Similar articles

Cited by

References

    1. Hayflick L & Moorhead PS The serial cultivation of human diploid cell strains. Exp Cell Res 25, 585–621 (1961). - PubMed
    1. Coppe JP et al. Senescence-associated secretory phenotypes reveal cell-nonautonomous functions of oncogenic RAS and the p53 tumor suppressor. PLoS Biol 6, 2853–2868 (2008). - PMC - PubMed
    1. Baker DJ et al. Naturally occurring p16(Ink4a)-positive cells shorten healthy lifespan. Nature 530, 184–189 (2016). - PMC - PubMed
    1. Baker DJ et al. Clearance of p16Ink4a-positive senescent cells delays ageing-associated disorders. Nature 479, 232–236 (2011). - PMC - PubMed
    1. Childs BG et al. Senescent intimal foam cells are deleterious at all stages of atherosclerosis. Science 354, 472–477 (2016). - PMC - PubMed

Publication types

MeSH terms