Meta-Analysis
. 2018 Sep 19;8(1):14069.
doi: 10.1038/s41598-018-32221-8.

The human gut pan-microbiome presents a compositional core formed by discrete phylogenetic units

Affiliations
Meta-Analysis

The human gut pan-microbiome presents a compositional core formed by discrete phylogenetic units

Daniel Aguirre de Cárcer. Sci Rep. .

Abstract

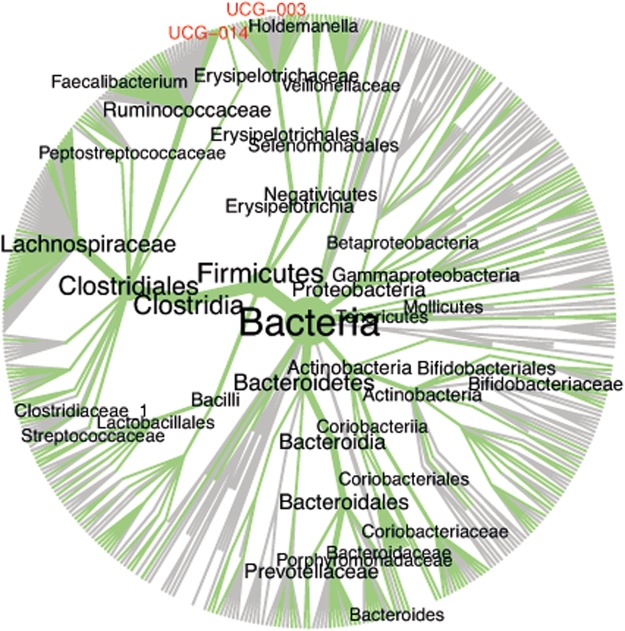
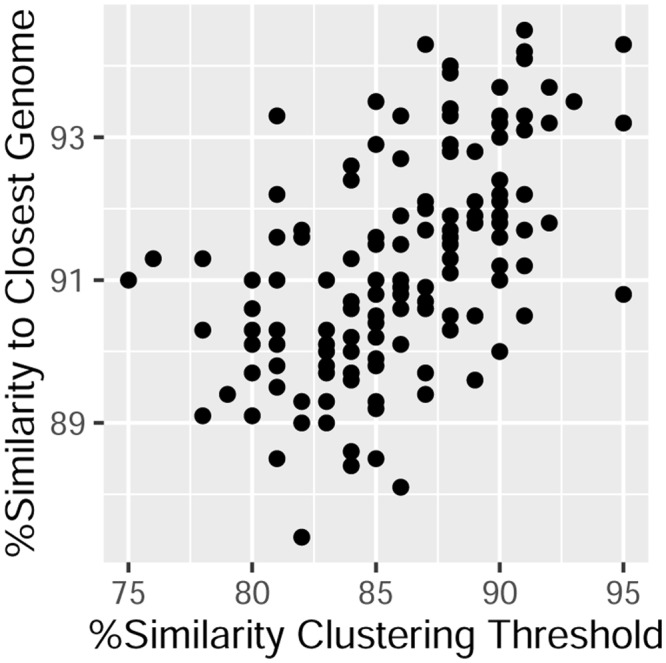
The complex community of microbes living in the human gut plays an important role in host wellbeing. However, defining a 'healthy' gut microbiome in terms of composition has remained an elusive task, despite its anticipated medical and scientific importance. In this regard, a central question has been if there is a 'core' microbiome consisting of bacterial groups common to all healthy humans. Recent studies have been able to define a compositional core in human gut microbiome datasets in terms of taxonomic assignments. However, the description of the core microbiome in terms of taxonomic assignments may not be adequate when considering subsequent analyses and applications. Through the implementation of a dynamic clustering approach in the meta-analyisis of comprehensive 16S rRNA marker gene datasets, this study found that the human gut pan-microbiome presents a preeminent compositional core comprised of discrete units of varying phylogenetic depth present in all individuals studied. Since both microbial traits and ecological coherence show signs of phylogenetic conservation, this outcome provides a new conceptual framework in the study of the ecosystem, as well as important practical considerations which should be taken into account in future research.


Conflict of interest statement

The authors declare no competing interests.

Figures

Figure 1
Figure 1
Graphical representation of the dynamic phylogenetic core identification approach. Panels in the cartoon provide a bidimensional representation of an imaginary N-dimensional sequence space populated by sequences (dots) from three different subjects (red, blue, green). During the initial iteration (A), sequences are clustered into OTUs at the highest similarity threshold, and OTUs containing sequences from all subjects are designated as “core OTUs” (here depicted as circles). In the second iteration (B), all sequences belonging to previously detected core OTUs are removed (grey dots), the remaining sequences are clustered into OTUs using a lower similarity threshold, and new OTUs containing sequences from all subjects are again designated as “core OTUs” (circles, now with larger radius). Subsequent iterations (C) continue in the same fashion. The result of the procedure (D) is a set of discrete portions of the sequence space (i.e. the core OTUs, depicted as circles) detected in all individuals and with different estimated phylogenetic depth (i.e. different radius sizes), jointly referred as the phylogenetic core.
Figure 2
Figure 2
Taxonomic representation of the Global phylogenetic core. The Metadiversity Plot summarizes the taxonomic assignments obtained for all sequences in the Global dataset, were both label and node sizes correlate with each specific taxon’s abundance. Only the most abundant taxa are labeled. Taxonomic ranks not appearing as assigned to any within-core OTUs representative sequence (0.97 similarity) appear in gray and red. The figure provides an indication of the taxonomic breadth of the phylogenetic core.
Figure 3
Figure 3
The phylogenetic core vs. sequenced genomes. The chart describes each core group detected in the Global dataset in terms of its phylogenetic depth (x axis) and its average within-core OTU similarity to closest sequenced genome (y axis).

References

    1. Falony G, et al. Population-level analysis of gut microbiome variation. Science. 2016;352:560–564. doi: 10.1126/science.aad3503. - DOI - PubMed
    1. Turnbaugh PJ, et al. The human microbiome project. Nature. 2007;449:804–810. doi: 10.1038/nature06244. - DOI - PMC - PubMed
    1. Mullard A. Microbiology: The inside story. Nature. 2008;453:478–580. doi: 10.1038/453578a. - DOI - PubMed
    1. Huse SM, Ye Y, Zhou Y, Fodor AA. A Core Human Microbiome as Viewed through 16S rRNA Sequence Clusters. PLoS One. 2012;7:e34242. doi: 10.1371/journal.pone.0034242. - DOI - PMC - PubMed
    1. Tap J, et al. Towards the human intestinal microbiota phylogenetic core. Environ Microbiol. 2009;11:2574–2584. doi: 10.1111/j.1462-2920.2009.01982.x. - DOI - PubMed

Publication types

LinkOut - more resources