Review
. 2018 Oct;9(5):857-882.
doi: 10.1007/s13244-018-0643-0. Epub 2018 Sep 19.

Radiological review of skull lesions

Affiliations
Review

Radiological review of skull lesions

Carrie K Gomez et al. Insights Imaging. 2018 Oct.

Abstract

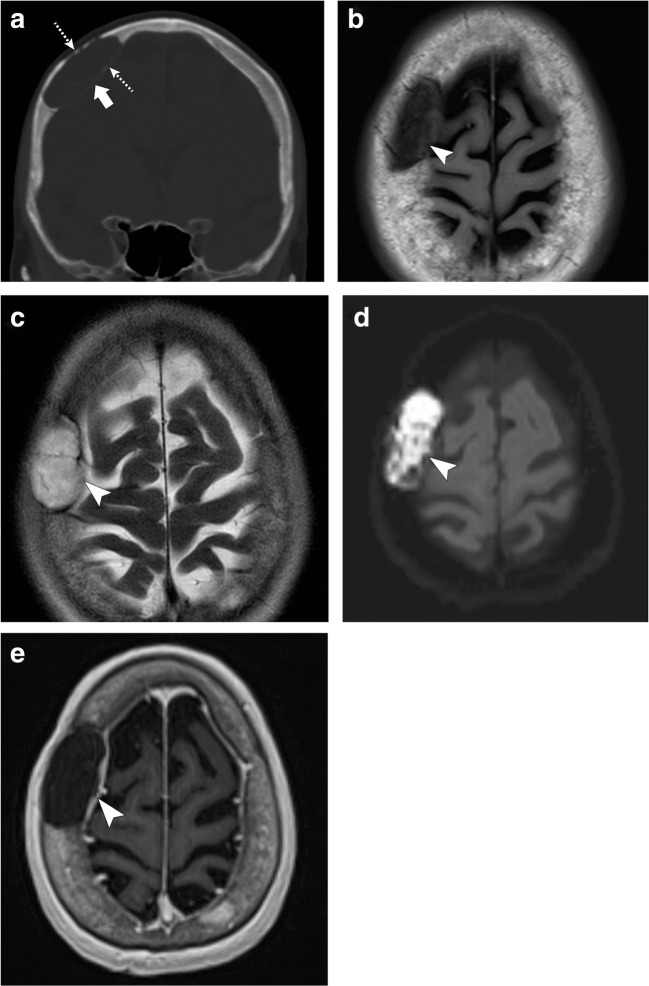
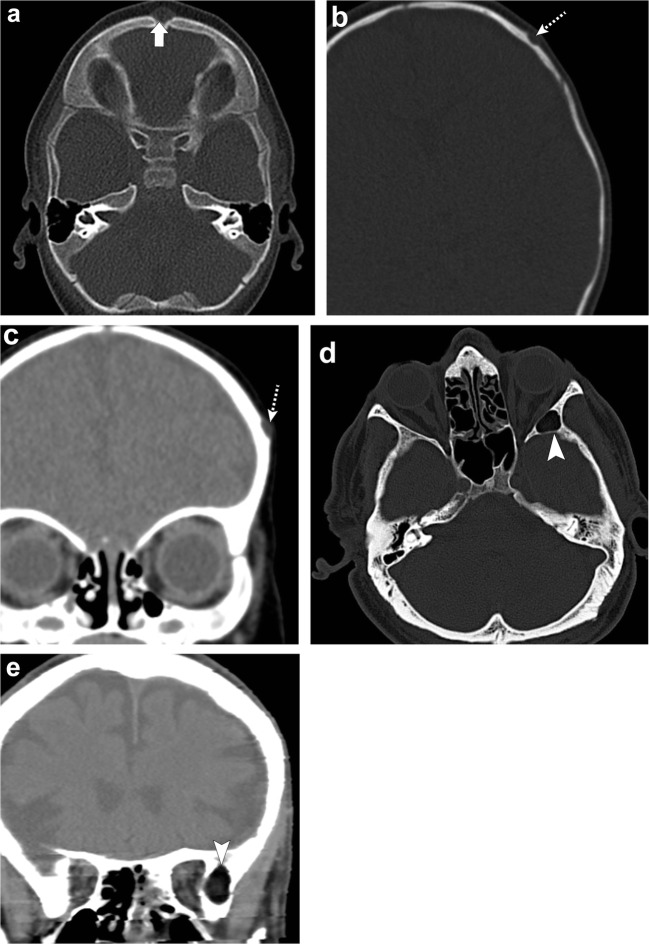
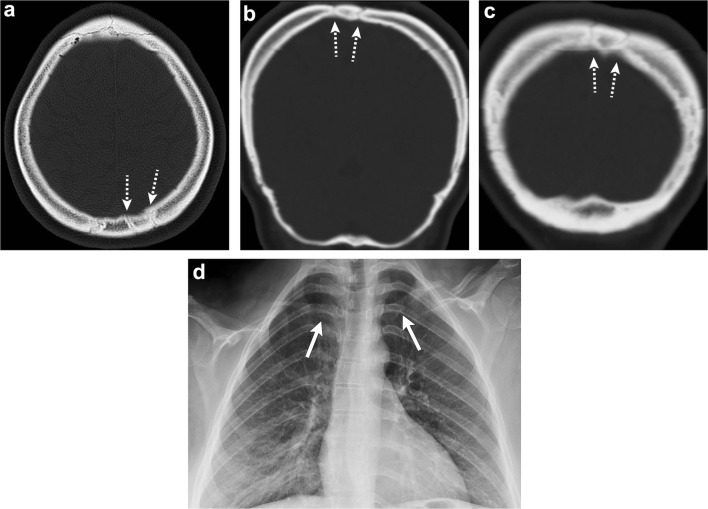
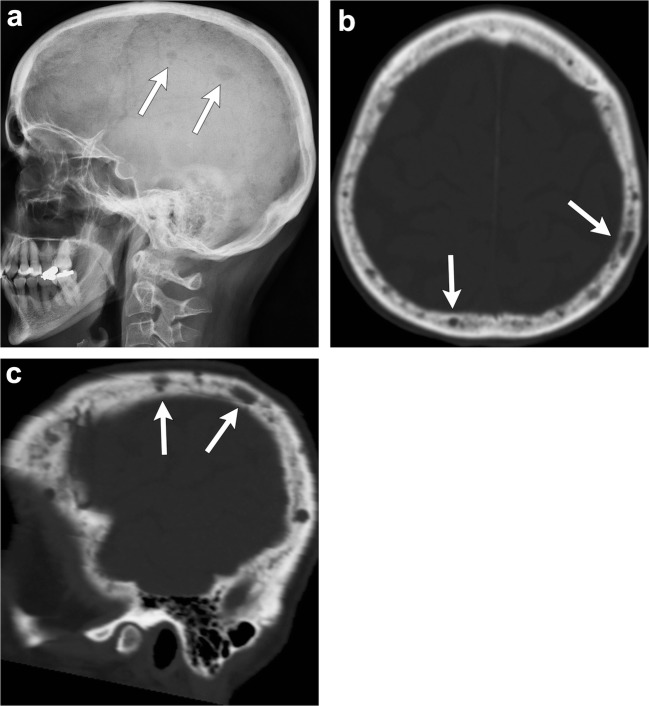
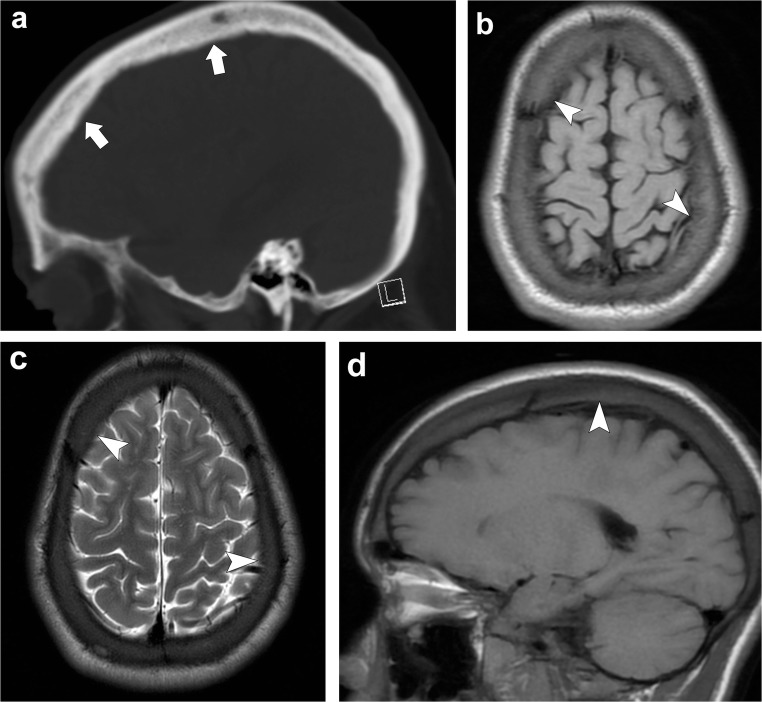
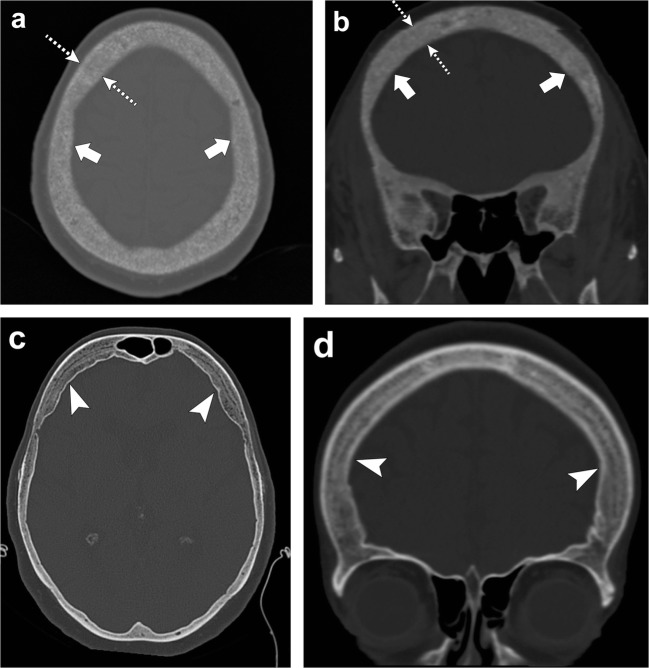
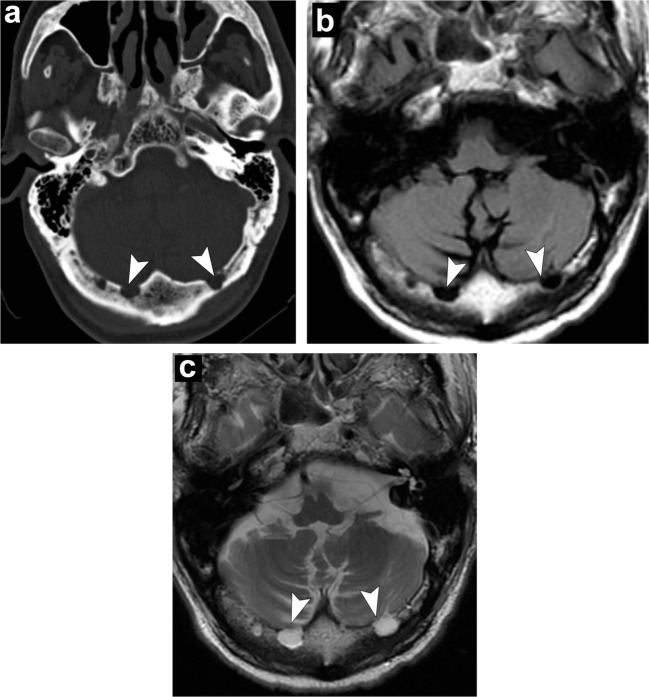
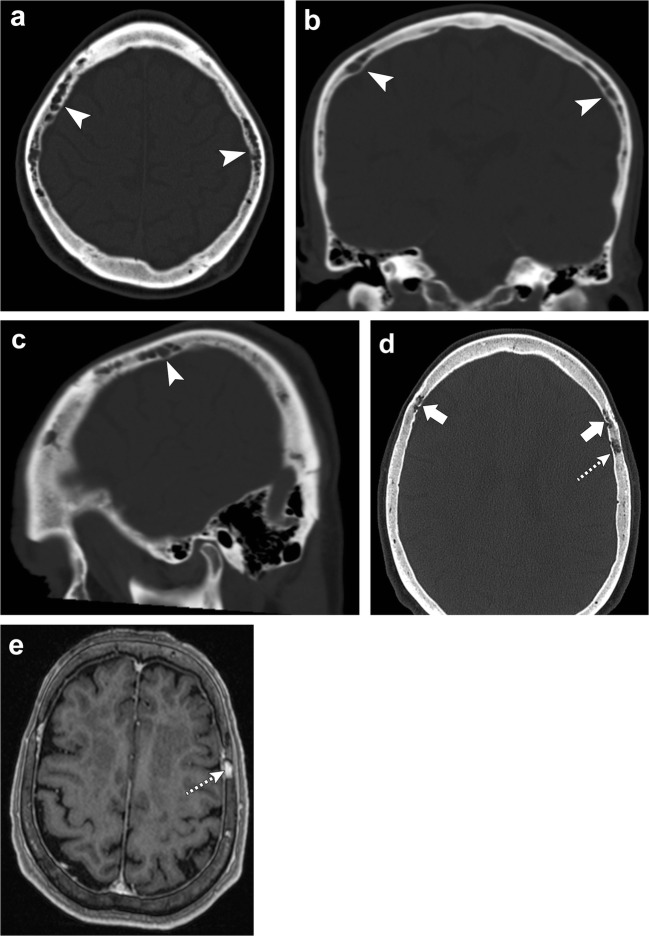
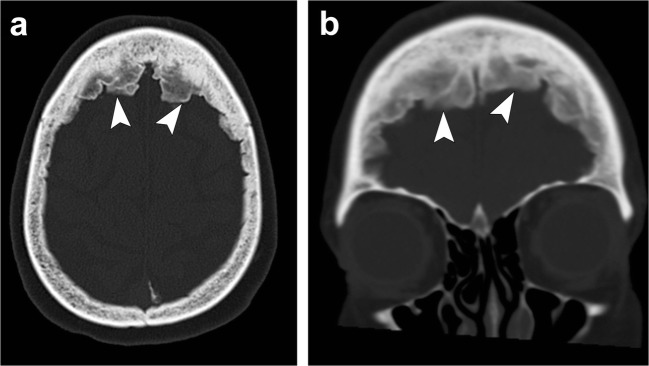
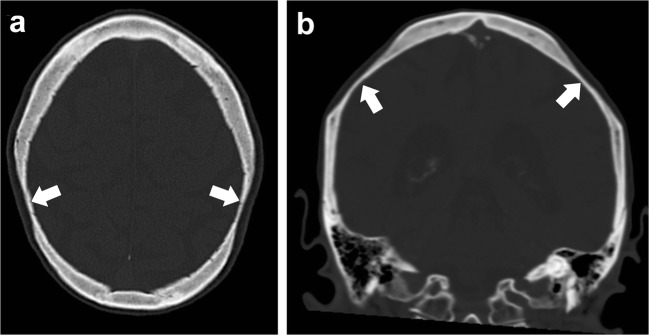
Calvarial lesions are often asymptomatic and are usually discovered incidentally during computed tomography or magnetic resonance imaging of the brain. Calvarial lesions can be benign or malignant. Although the majority of skull lesions are benign, it is important to be familiar with their imaging characteristics and to recognise those with malignant features where more aggressive management is needed. Clinical information such as the age of the patient, as well as the patient's history is fundamental in making the correct diagnosis. In this article, we will review the imaging features of both common and uncommon calvarial lesions, as well as mimics of these lesions found in clinical practice. TEACHING POINTS: • Skull lesions are usually discovered incidentally; they can be benign or malignant. • Metastases are the most frequent cause of skull lesions. • Metastatic lesions are most commonly due to breast cancer in adults and neuroblastoma in children. • Multiple myeloma presents as the classic "punched out" lytic lesions on radiographs. • Eosinophilic granuloma is an osteolytic lesion with bevelled edges.

Keywords: Benign; Calvarial; Lesions; Malignant; Skull.


Conflict of interest statement

The authors of this manuscript declare no relationships with any companies whose products or services may be related to the subject matter of the article.

Figures

Fig. 1
Fig. 1
Image depicting the calvarium anatomy (a). The skull is composed of the marrow space (diploe), inner and outer tables. Covering the skull is the scalp which consists of the skin, subcutaneous dense connective tissue, galea aponeurotica and loose connective tissue. The outer table is covered by periosteum. Underneath the calvarium are the meninges comprised of the dura mater, arachnoid mater and pia mater. Diagram of the skull depicts patterns of bone destruction in the skull (b)
Fig. 2
Fig. 2
Fibrous dysplasia. Axial (a) and coronal (b) head CT images demonstrate an expansile lesion with ground-glass matrix in the right greater wing of the sphenoid (arrows). Axial T1-weighted (c), axial T2-weighted (d) and axial post-contrast T1-weighted (e) images show that the lesion is hypointense with homogeneous enhancement (arrowheads)
Fig. 3
Fig. 3
Osteoma. Axial (a) and coronal (b) head CT images show a juxta-cortical lesion along the outer table of the left frontal bone (arrows). Axial T1-weighted (c), sagittal T1-weighted (d) and coronal post-contrast T1-weighted (e) images depict the sclerotic/osteoblastic nature of this lesion (arrowheads). Note the well-defined margins and lack of enhancement
Fig. 4
Fig. 4
Gardner Syndrome (multiple osteomas). Axial head CT images (ac) show multiple osteomas in the ethmoid air cells (dashed arrows), left ramus of the mandible (arrowhead) and right anterior wall of the maxillary sinus (thin arrow). This patient was also found to have a mesenteric desmoid tumour (thick arrow, d)
Fig. 5
Fig. 5
Langerhans cell histiocytosis. Sagittal skull radiograph (a) shows two lytic lesions (arrowheads) in the parietal skull, the largest one with an associated soft tissue component (thin arrow). Axial head CT images (b, c) in the bone and soft tissue windows in the same patient demonstrate an osseous destructive lesion in the left frontal calvarium with bevelled edges (dashed arrows) and a soft tissue component (thick arrows); pathology proven eosinophilic granuloma in a 4-year-old boy
Fig. 6
Fig. 6
Osseous venous vascular malformation. Sagittal T1-weighted imaging (a), axial T2-weighted imaging (b) and sagittal contrast-enhanced venogram (c) show a hypointense T1, hyperintense T2 and enhancing lesion in the occipital bone (arrows)
Fig. 7
Fig. 7
Osseous venous vascular malformation. Axial head CT (a) shows osteolytic changes (trabecular appearance) of the clivus (dashed arrow) extending into the left occipital condyle (thin arrow). Sagittal T1-weighted (b), axial T2-weighted (c) and post-contrast sagittal T1-weighted images (d, e) show abnormal signal in the clivus (dashed arrows) and left occipital condyle (thin arrow) with enhancement
Fig. 8
Fig. 8
Intradural meningioma. Axial head CT images (a, b) show hyperostosis of the left sphenoid bone, clivus and petrous portion of the left temporal bone (arrowheads). Axial (c) and coronal (d) post-contrast T1-weighted images show a large enhancing lesion along the left sphenoid wing (thick arrows) extending along the clivus and sella (dashed arrows), as well as left middle cranial fossa (short, thick arrow); there is also extension outside of the calvarium (thin arrow)
Fig. 9
Fig. 9
Intraosseous meningioma. Axial (a) and coronal (b) CT images portray an intraosseous meningioma in the right sphenoid extending into the right lateral orbital wall (arrows). Note the expansion of bone and “prickly” border of the lesion
Fig. 10
Fig. 10
Paget disease. Axial head CT (a, b) images demonstrate increased cortical density and trabecular thickening (arrows)
Fig. 11
Fig. 11
Calvaria sarcoidosis. Axial head CT (a, b) images show three lytic lesions in the diploic space of the frontal bones (arrows) with involvement and thinning of the cortex of the inner tables (dashed arrows). Axial T1-weighted imaging (c) depicts hypointense lesions (arrows). Post-contrast T1-weighted (d, e) images demonstrate enhancement of these lesions (arrowheads)
Fig. 12
Fig. 12
Ossifying fibroma. Water view skull radiograph (a), axial (b) and sagittal (c) head CT images show a lytic lesion in the frontal bone (arrowhead) with barely perceptible anterior and posterior cortical margins (dashed arrows)
Fig. 13
Fig. 13
Epidermoid cyst. Axial head CT portrays an expansile lesion in the right frontal bone (thick arrow) with thinning of the inner and outer tables (dashed arrows). Axial T1-weighted imaging (b), axial T2-weighted imaging (c), axial DWI (d) and axial post contrast T1-weighted imaging (e) show that the lesion is hypointense on T1, hyperintense on T2 with restricted diffusion and absent internal enhancement (arrowheads). Note that there may be some enhancement along the peripheral margins
Fig. 14
Fig. 14
Dermoid cysts. Patient 1: Axial head CT (a) depicts a midline fat-containing lesion in the frontal region (thick arrow). Patient 2: Axial bone window (b) and coronal soft tissue window head CT (c) show a dermoid cyst in the left frontal bone involving the outer table (dashed arrows). Patient 3: Axial CT (d) and coronal head CT portray a fat-containing lesion in the left grater wing of the sphenoid (arrowheads)
Fig. 15
Fig. 15
Cleidocranial dysostosis. Axial (a) and coronal (b, c) head CT images show islands of intra-sutural bones (dashed arrows) in the lambdoid and sagittal sutures representing wormian bones. Chest radiograph (d) in the same patient depicts hypoplasia of the bilateral clavicles (arrows), confirming cleidocranial dysostosis
Fig. 16
Fig. 16
Multiple myeloma. Skull radiograph (a), axial (b) and sagittal (c) head CT show multiple “punched out” lytic lesions in the calvarium (arrows), “salt and pepper” appearance
Fig. 17
Fig. 17
Parosteal osteosarcoma. Axial CT (a, b) images show a lobulated exophytic mass (arrowheads) with central dense ossification in the left temporo-occipital region. Axial T1-weighted (c), axial T2-weighted (d) and axial post-contrast T1-weighted (e) images re-demonstrate a juxta-cortical enhancing lesion abutting the outer table of the left temporo-occipital bones (arrows) with a small component extending into the medullary cavity with associated cortical disruption (dashed arrows)
Fig. 18
Fig. 18
Skull metastasis. Patient 1: Axial (a) and sagittal (b) head CT images show an expansile destructive lesion in the frontal skull (arrowheads), pathology proven metastatic renal cell carcinoma. Patient 2: Sagittal T1-weighted (c) and sagittal post-contrast T1-weighted (d) images demonstrate an enhancing lesion in the clivus (arrowheads) with soft tissue component extending into the sphenoid sinus (arrows) and anterior to the midbrain (dashed arrow). This lesion was proven to be metastatic from breast primary
Fig. 19
Fig. 19
Chordoma. Axial head CT (a) shows an osteolytic destructive lesion involving the clivus (thick arrows) with extension into the posterior sphenoid sinus (arrowhead) and impression on the pons (curved arrow). Axial T1-weighted (b), axial T2-weighted (c) and sagittal post-contrast T1-weighted (d) images demonstrate an expansile mass centred at the clivus extending into the sphenoid sinus (arrowhead), left cavernous region (short, thick arrows) and partially encasing the left internal carotid artery. This mass enhances and displaces the pituitary gland (thin, long arrow) and has mass effect on the left aspect of the pons (curved arrow)
Fig. 20
Fig. 20
Chondrosarcoma. Axial non-contrast CT (a) shows an osteolytic destructive lesion involving the right petro-occipital junction and clivus (arrowhead). Axial contrast-enhanced CT (b) demonstrates this lesion to have a soft-tissue component extending anteriorly into the sphenoid sinus (thick arrow) and posteriorly into the prepontine cistern with mass effect on the pons (dashed arrow). Axial (c) and coronal (d) CT angiogram images demonstrate involvement of the right petrous carotid canal (arrowheads) with the lesion surrounding the right internal carotid artery (thin arrow). Note the punctate calcifications (chondroid matrix) within the mass (curved arrow). Axial T1-weighted (e) and axial T2-weighted (f) images show a lobulated lesion involving the right petro-occipital junction and clivus (arrowhead). Note the extension of the lesion anteriorly into the sphenoid sinus (thick arrow) and posteriorly into the prepontine cistern with mass effect on the pons (dashed arrow). Axial SWAN (g) shows internal foci of low signal, consistent with calcifications (curved arrow). Post-contrast axial T1-weighted imaging (h) demonstrates heterogeneous (“whorls” of) enhancement (arrowhead)
Fig. 21
Fig. 21
Chronic anaemia. Sagittal head CT (a) depicts widening of the diploic space (thick arrows). Axial T1-weighted (b), axial T2-weighted (c) and sagittal T1-weighted (d) images portray widening of the diploic space with generalised T1 and T2 marrow hypointensity (arrowheads) consistent with red marrow hyperplasia in this patient with sickle-cell anaemia
Fig. 22
Fig. 22
Renal osteodystrophy and osteopenia. Patient 1: Axial (a) and coronal (b) head CT images depict granular de-ossification with a “pepper pot” appearance (thick arrows) and loss of distinction of the inner and outer tables (dashed arrows) in this patient with renal osteodystrophy. Patient 2: Axial (c) and coronal (d) head CT images show demineralisation of the skull (arrowheads) in this patient with osteopenia. Note the relative preservation of the distinction of the inner and outer tables in osteopenia
Fig. 23
Fig. 23
Arachnoid granulations. Axial head CT (a) shows well-defined structures along the inner table in the region of the transverse sinus (arrowheads). Axial T1-weighted (b) and axial T2-weighted (c) images demonstrate fluid signal of these structures following CSF along the transverse sinus extending into the occipital bone (arrowheads)
Fig. 24
Fig. 24
Venous channels and lakes. Axial (a), coronal (b) and sagittal (c) head CT images depict serpiginous structures in the frontal and parietal bones (arrowheads) representing prominent venous channels. Axial head CT (d) and axial post-contrast T1-weighted (e) images show a lucent focus along the left parietal bone with enhancement consistent with a venous lake (dashed arrows). There are also mildly prominent serpiginous venous channels in the frontal bones (thick arrows)
Fig. 25
Fig. 25
Hyperostosis frontalis. Axial (a) and coronal (b) head CT images portray irregular thickening of the inner table of the frontal bone consistent with hyperostosis frontalis (arrowheads)
Fig. 26
Fig. 26
Parietal thinning. Axial (a) and coronal (b) head CT images shows thinning of the parietal bones (thick arrows)

References

    1. Lloret I, Server A, Taksdal I. Calvarial lesions: a radiological approach to diagnosis. Acta Radiol. 2009;50:531–542. doi: 10.1080/02841850902795274. - DOI - PubMed
    1. Colas L, Caron S, Cotton A. Skull vault lesions: a review. AJR Am J Roentgenol. 2015;205:840–847. doi: 10.2214/AJR.14.13415. - DOI - PubMed
    1. Garfinkle J, Melançon D, Cortes M, Tampieri D. Imaging pattern of calvarial lesions in adults. Skeletal Radiol. 2011;40(10):1261–1273. doi: 10.1007/s00256-010-0971-8. - DOI - PubMed
    1. Arana E, Martí-Bonmati L. CT and MR imaging of focal calvarial lesions. AJR Am J Roentgenol. 1999;172:1683–1688. doi: 10.2214/ajr.172.6.10350315. - DOI - PubMed
    1. Younghee Y, Woon-Jin M, Hyeong SA, Joon C, Myung HR. Imaging findings of various calvarial bone lesions with a focus on osteolytic lesions. J Korean Soc Radiol. 2016;74(1):43–54. doi: 10.3348/jksr.2016.74.1.43. - DOI

LinkOut - more resources