

In vitro cellular localization and efficient accumulation of fluorescently tagged biomaterials from monodispersed chitosan nanoparticles for elucidation of controlled release pathways for drug delivery systems
- PMID: 30233174
- PMCID: PMC6130301
- DOI: 10.2147/IJN.S164843
In vitro cellular localization and efficient accumulation of fluorescently tagged biomaterials from monodispersed chitosan nanoparticles for elucidation of controlled release pathways for drug delivery systems
Abstract
Background: Inefficient cellular delivery and poor intracellular accumulation are major drawbacks towards achieving favorable therapeutic responses from many therapeutic drugs and biomolecules. To tackle this issue, nanoparticle-mediated delivery vectors have been aptly explored as a promising delivery strategy capable of enhancing the cellular localization of biomolecules and improve their therapeutic efficacies. However, the dynamics of intracellular biomolecule release and accumulation from such nanoparticle systems has currently remained scarcely studied.
Objectives: The objective of this study was to utilize a chitosan-based nanoparticle system as the delivery carrier for glutamic acid, a model for encapsulated biomolecules to visualize the in vitro release and accumulation of the encapsulated glutamic acid from chitosan nanoparticle (CNP) systems.
Methods: CNP was synthesized via ionic gelation routes utilizing tripolyphosphate (TPP) as a cross-linker. In order to track glutamic acid release, the glutamic acid was fluorescently-labeled with fluorescein isothiocyanate prior encapsulation into CNP.
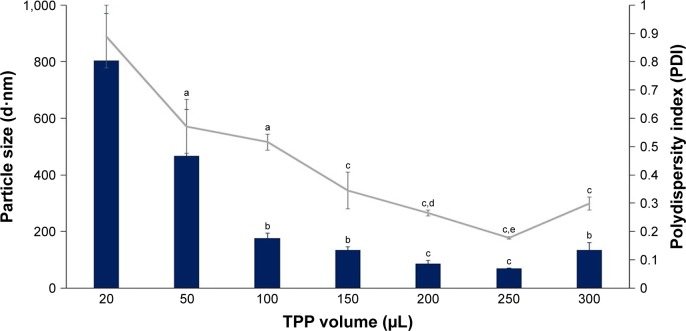
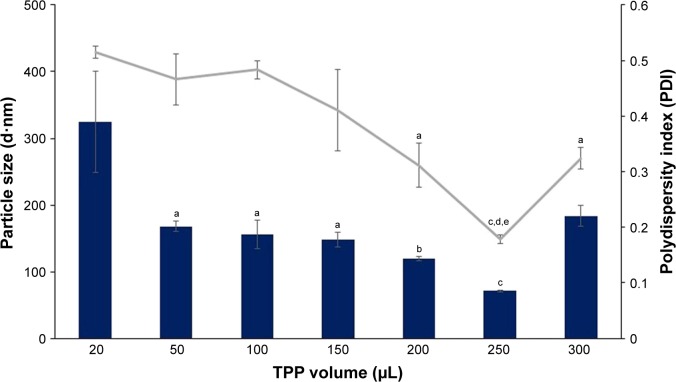
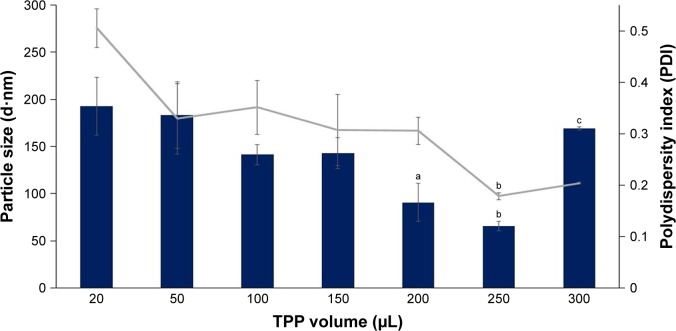
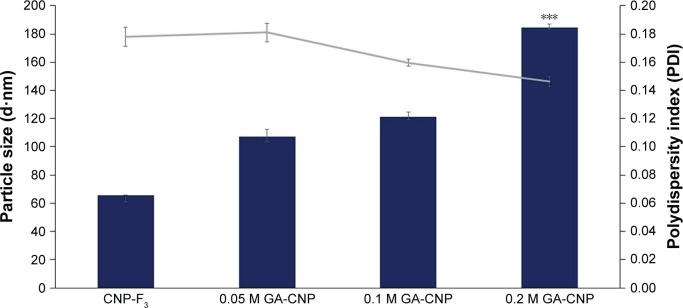
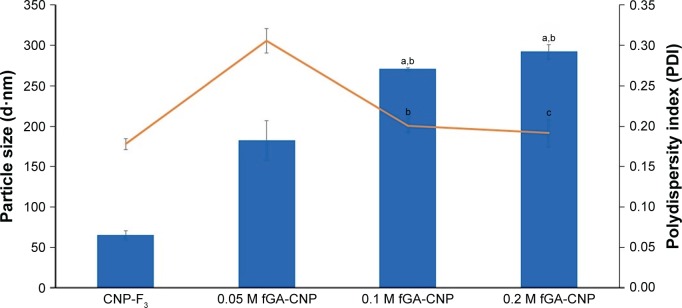
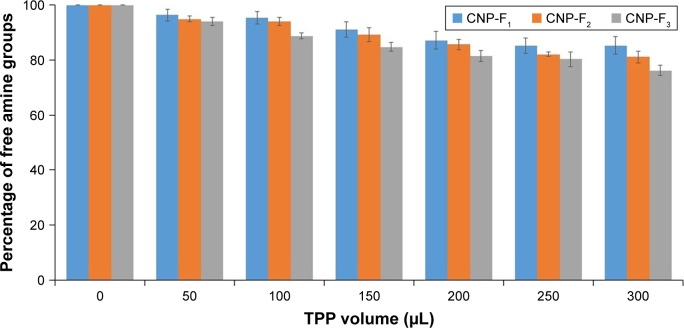
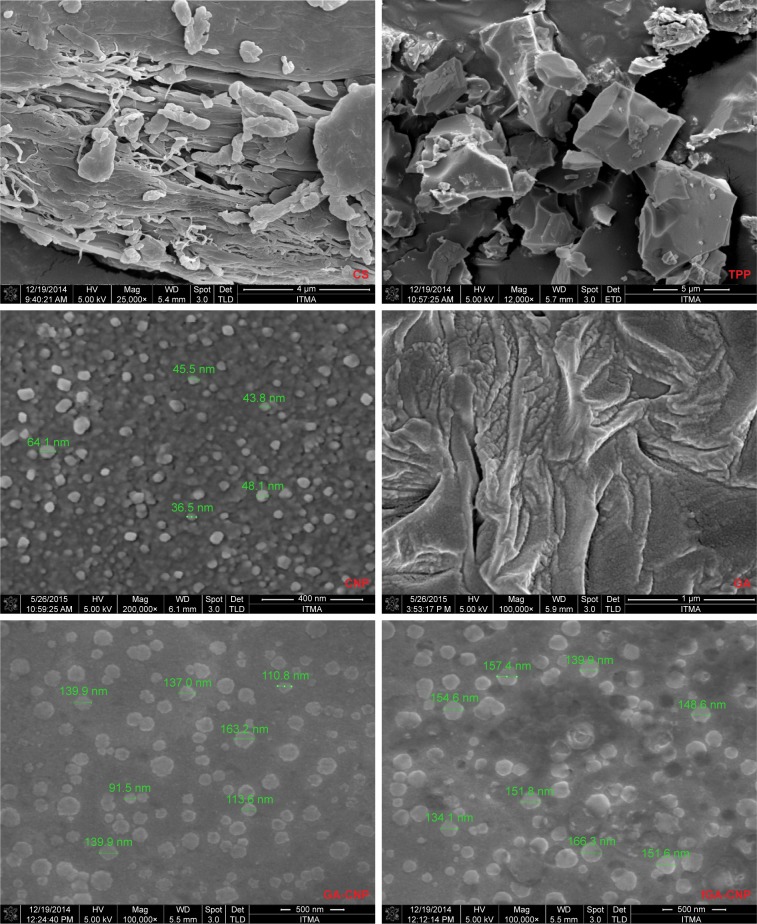
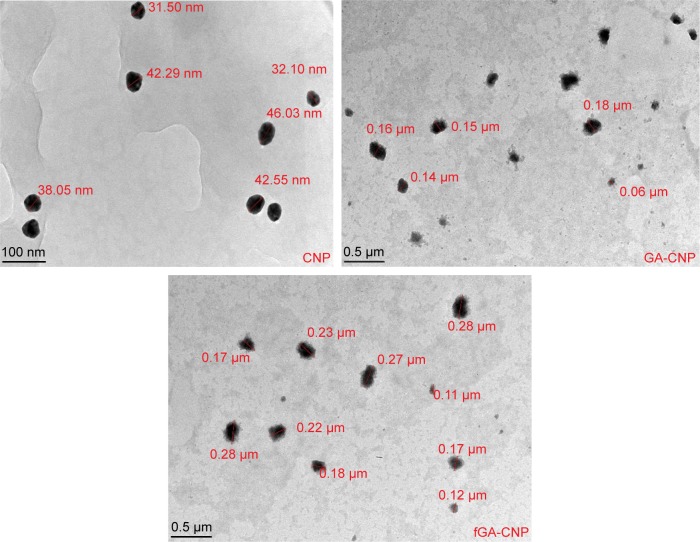
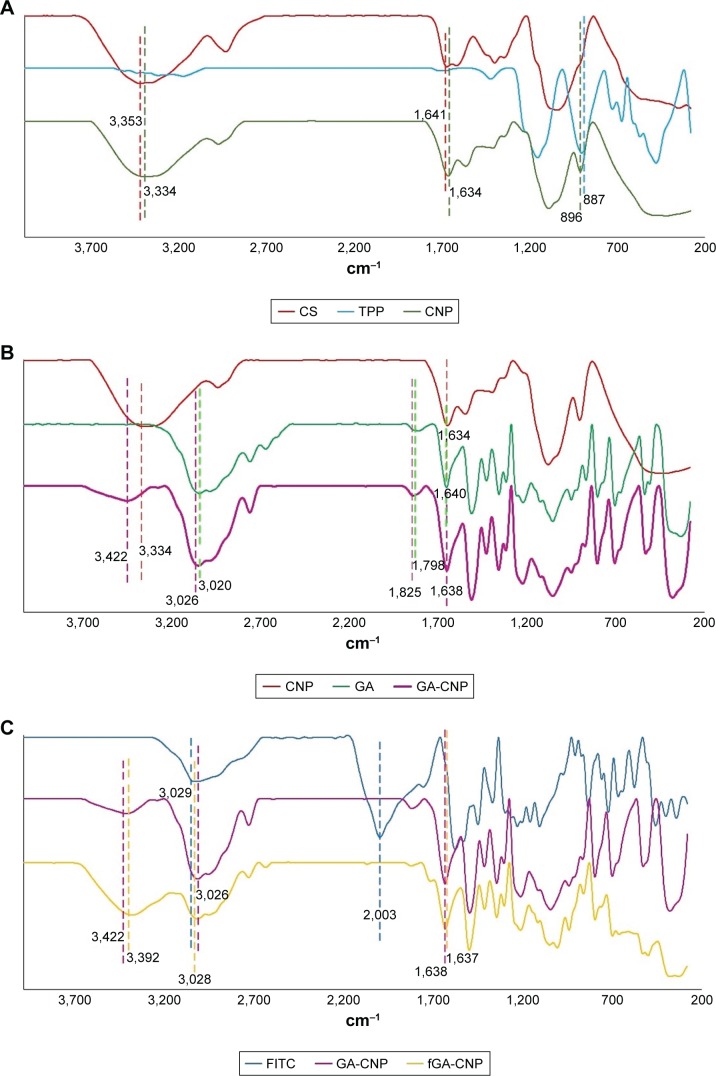
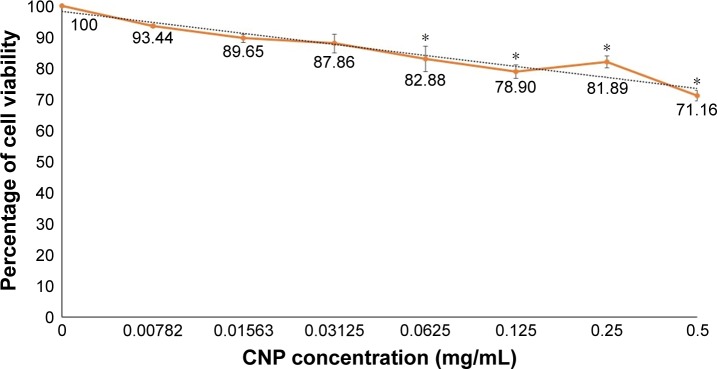
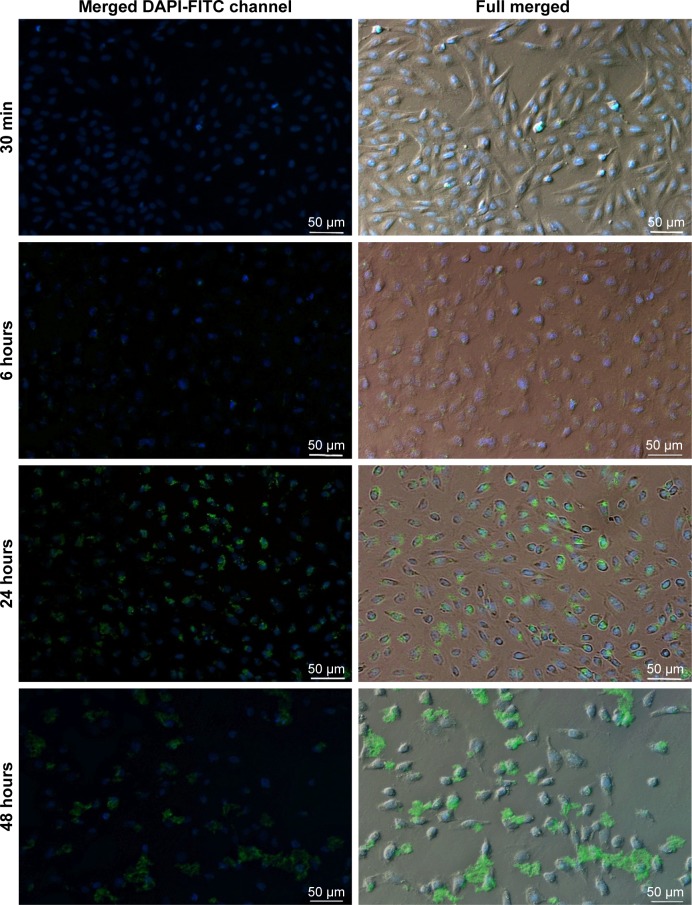
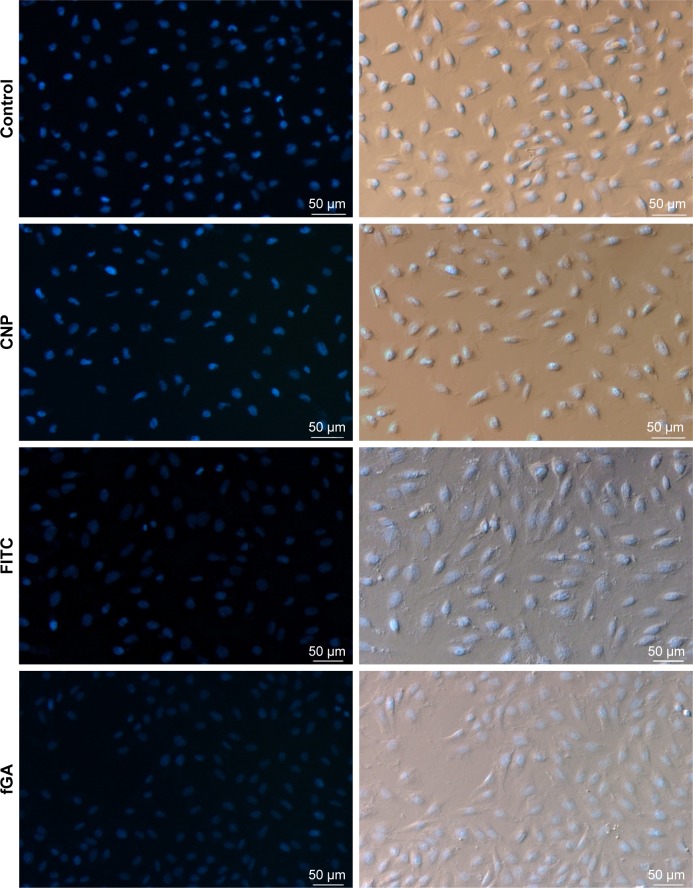
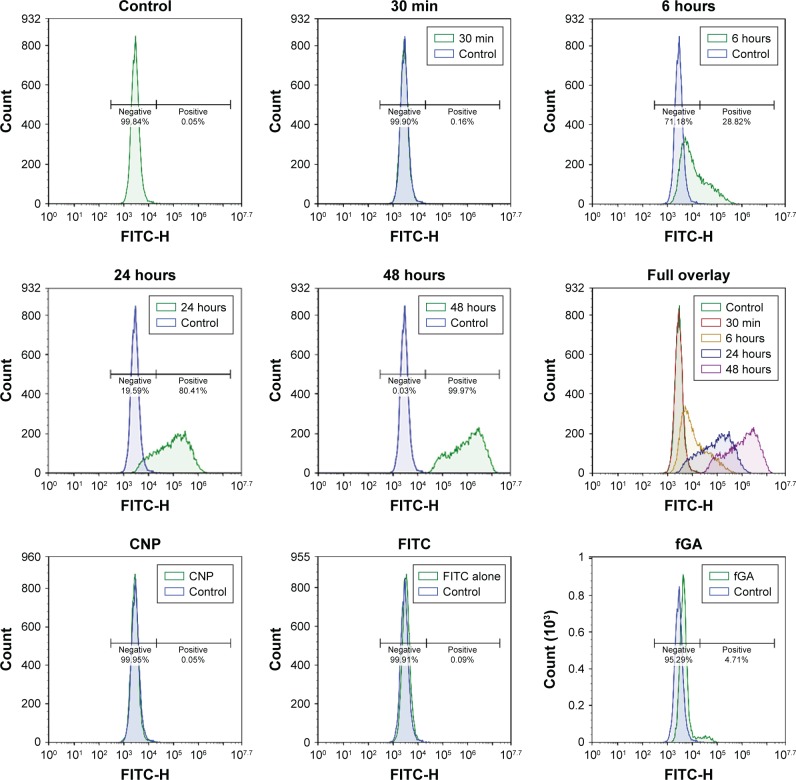
Results: Light Scattering data concluded the successful formation of small-sized and mono-dispersed CNP at a specific volume ratio of chitosan to TPP. Encapsulation of glutamic acid as a model cargo into CNP led to an increase in particle size to >100 nm. The synthesized CNP exhibited spherical shape under Electron Microscopy. The formation of CNP was reflected by the reduction in free amine groups of chitosan following ionic crosslinking reactions. The encapsulation of glutamic acid was further confirmed by Fourier Transform Infrared (FTIR) analysis. Cell viability assay showed 70% cell viability at the maximum concentration of 0.5 mg/mL CS and 0.7 mg/mL TPP used, indicating the low inherent toxicity property of this system. In vitro release study using fluorescently-tagged glutamic acids demonstrated the release and accumulation of the encapsulated glutamic acids at 6 hours post treatment. A significant accumulation was observed at 24 hours and 48 hours later. Flow cytometry data demonstrated a gradual increase in intracellular fluorescence signal from 30 minutes to 48 hours post treatment with fluorescently-labeled glutamic acids encapsulated CNP.
Conclusion: These results therefore suggested the potential of CNP system towards enhancing the intracellular delivery and release of the encapsulated glutamic acids. This CNP system thus may serves as a potential candidate vector capable to improve the therapeutic efficacy for drugs and biomolecules in medical as well as pharmaceutical applications through the enhanced intracellular release and accumulation of the encapsulated cargo.
Keywords: FITC; chitosan; drug delivery; glutamic acid; nanotechnology.
Conflict of interest statement
Disclosure The authors report no conflicts of interest in this work.
Figures
Similar articles
-
Increased ROS Scavenging and Antioxidant Efficiency of Chlorogenic Acid Compound Delivered via a Chitosan Nanoparticulate System for Efficient In Vitro Visualization and Accumulation in Human Renal Adenocarcinoma Cells.Int J Mol Sci. 2019 Sep 20;20(19):4667. doi: 10.3390/ijms20194667. Int J Mol Sci. 2019. PMID: 31547100 Free PMC article.
-
PLGA Microparticles Entrapping Chitosan-Based Nanoparticles for the Ocular Delivery of Ranibizumab.Mol Pharm. 2016 Sep 6;13(9):2923-40. doi: 10.1021/acs.molpharmaceut.6b00335. Epub 2016 Jun 22. Mol Pharm. 2016. PMID: 27286558
-
Stability, Intracellular Delivery, and Release of siRNA from Chitosan Nanoparticles Using Different Cross-Linkers.PLoS One. 2015 Jun 11;10(6):e0128963. doi: 10.1371/journal.pone.0128963. eCollection 2015. PLoS One. 2015. PMID: 26068222 Free PMC article.
-
Chitosan Nanoparticles Prepared by Ionotropic Gelation: An Overview of Recent Advances.Crit Rev Ther Drug Carrier Syst. 2016;33(2):107-58. doi: 10.1615/CritRevTherDrugCarrierSyst.2016014850. Crit Rev Ther Drug Carrier Syst. 2016. PMID: 27651100 Review.
-
Hydrophobic amino acids grafted onto chitosan: a novel amphiphilic chitosan nanocarrier for hydrophobic drugs.Drug Dev Ind Pharm. 2017 Jan;43(1):1-11. doi: 10.1080/03639045.2016.1254240. Epub 2016 Nov 14. Drug Dev Ind Pharm. 2017. PMID: 27802776 Review.
Cited by
-
Novel Pseudomonas putida-derived nanoliposomes enhance the inhibition of MCF-7 breast cancer cells by superb intracellular uptake of doxorubicin.Heliyon. 2024 Sep 26;10(19):e38337. doi: 10.1016/j.heliyon.2024.e38337. eCollection 2024 Oct 15. Heliyon. 2024. PMID: 39403495 Free PMC article.
-
Graphene Oxide Loaded with Protocatechuic Acid and Chlorogenic Acid Dual Drug Nanodelivery System for Human Hepatocellular Carcinoma Therapeutic Application.Int J Mol Sci. 2021 May 28;22(11):5786. doi: 10.3390/ijms22115786. Int J Mol Sci. 2021. PMID: 34071389 Free PMC article.
-
Docetaxel-Loaded Chitosan-Cholesterol Conjugate-Based Self-Assembled Nanoparticles for Overcoming Multidrug Resistance in Cancer Cells.Pharmaceutics. 2020 Aug 19;12(9):783. doi: 10.3390/pharmaceutics12090783. Pharmaceutics. 2020. PMID: 32825000 Free PMC article.
-
Simultaneous Intramuscular And Intranasal Administration Of Chitosan Nanoparticles-Adjuvanted Chlamydia Vaccine Elicits Elevated Protective Responses In The Lung.Int J Nanomedicine. 2019 Oct 8;14:8179-8193. doi: 10.2147/IJN.S218456. eCollection 2019. Int J Nanomedicine. 2019. PMID: 31632026 Free PMC article.
-
Imaging-Guided Delivery of a Hydrophilic Drug to Eukaryotic Cells Based on Its Hydrophobic Ion Pairing with Poly(hexamethylene guanidine) in a Maleated Chitosan Carrier.Molecules. 2021 Dec 7;26(24):7426. doi: 10.3390/molecules26247426. Molecules. 2021. PMID: 34946504 Free PMC article.
References
-
- Farokhzad OC, Langer R. Impact of nanotechnology on drug delivery. ACS Nano. 2009;3(1):16–20. - PubMed
-
- Allen TM, Cullis PR. Drug delivery systems: entering the mainstream. Science. 2004;303(5665):1818–1822. - PubMed
-
- Aungst BJ, Saitoh H, Burcham DL, Huang SM, Mousa SA, Hussain MA. Enhancement of the intestinal absorption of peptides and nonpeptides. J Control Release. 1996;41(1–2):19–31.
-
- Wang S, Zhao J, Yang H, et al. Bottom-up synthesis of WS22 nanosheets with synchronous surface modification for imaging guided tumor regression. Acta Biomater. 2017;58:442–454. - PubMed
MeSH terms
Substances
LinkOut - more resources
Full Text Sources
Other Literature Sources
