. 2018 Sep 4:9:1229.
doi: 10.3389/fphys.2018.01229. eCollection 2018.

N6-(2-Hydroxyethyl) Adenosine From Cordyceps cicadae Ameliorates Renal Interstitial Fibrosis and Prevents Inflammation via TGF-β1/Smad and NF-κB Signaling Pathway

Affiliations

N6-(2-Hydroxyethyl) Adenosine From Cordyceps cicadae Ameliorates Renal Interstitial Fibrosis and Prevents Inflammation via TGF-β1/Smad and NF-κB Signaling Pathway

Rong Zheng et al. Front Physiol. .

Abstract

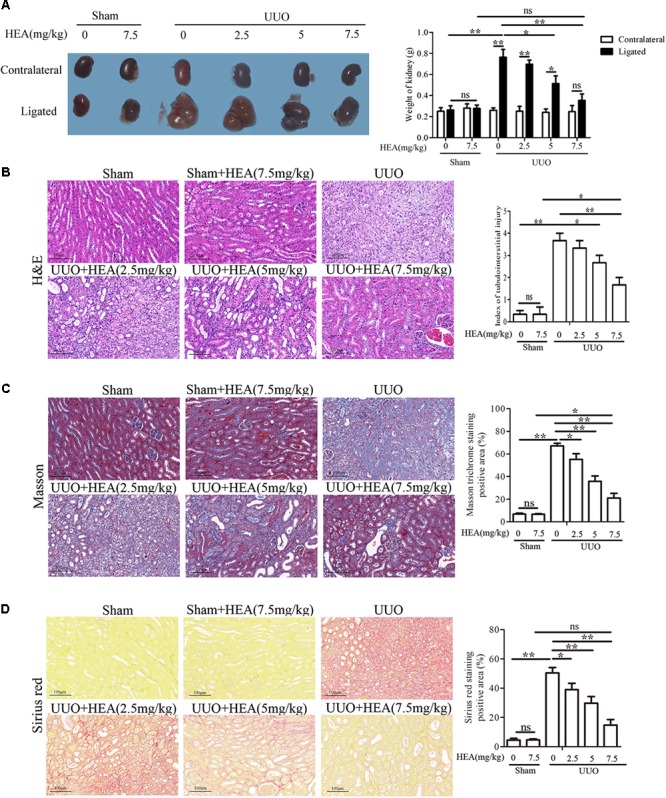
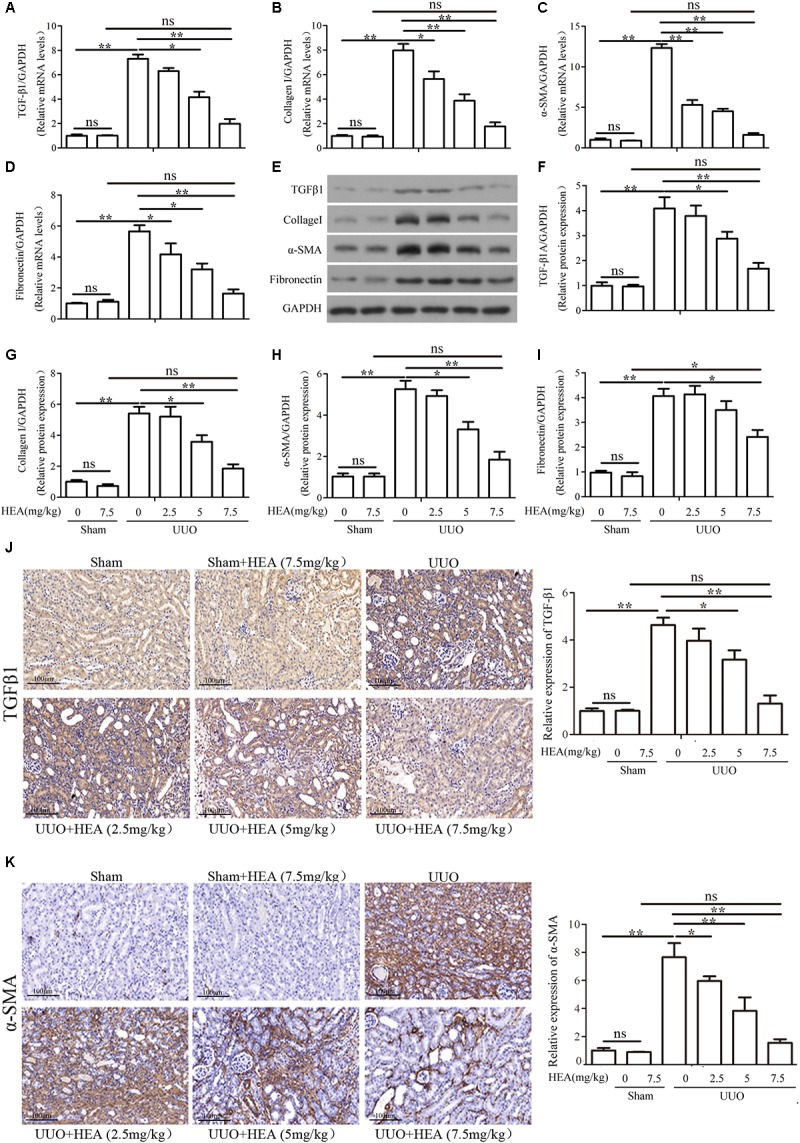
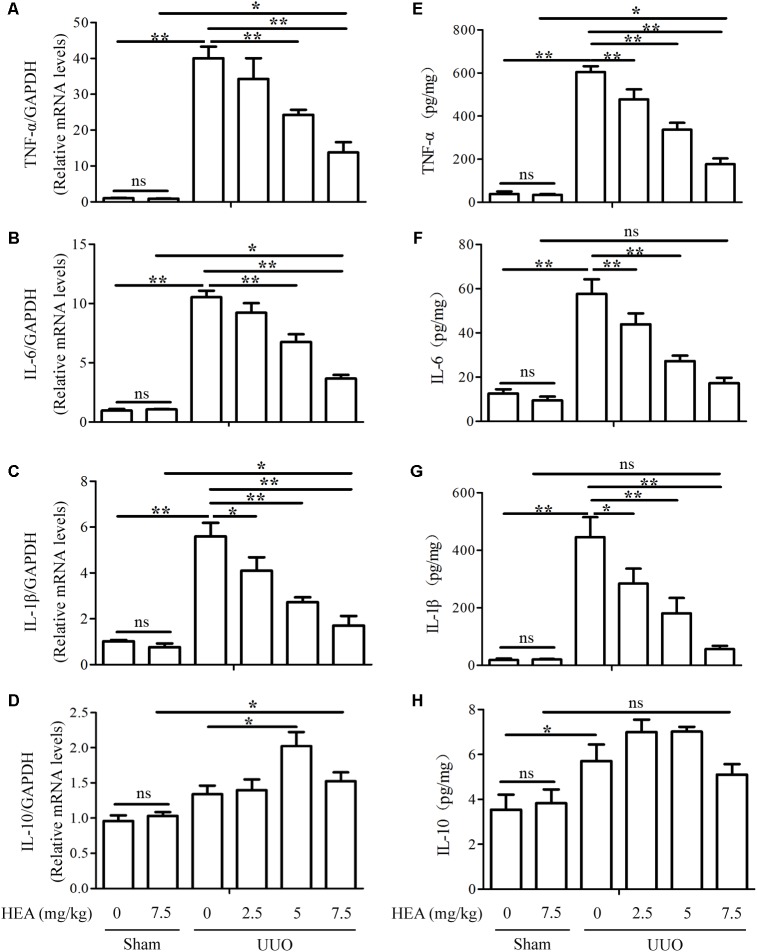
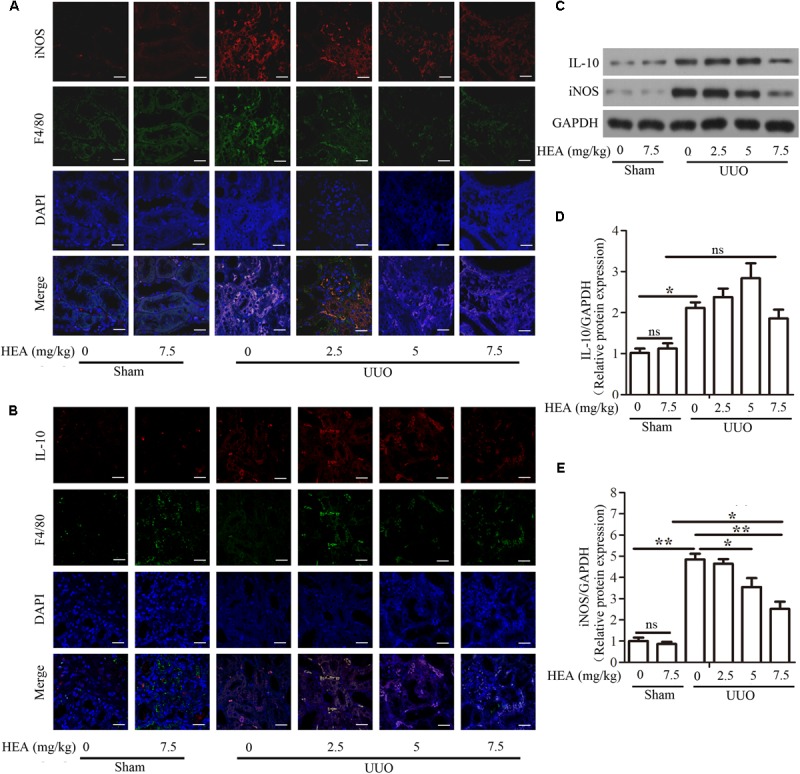
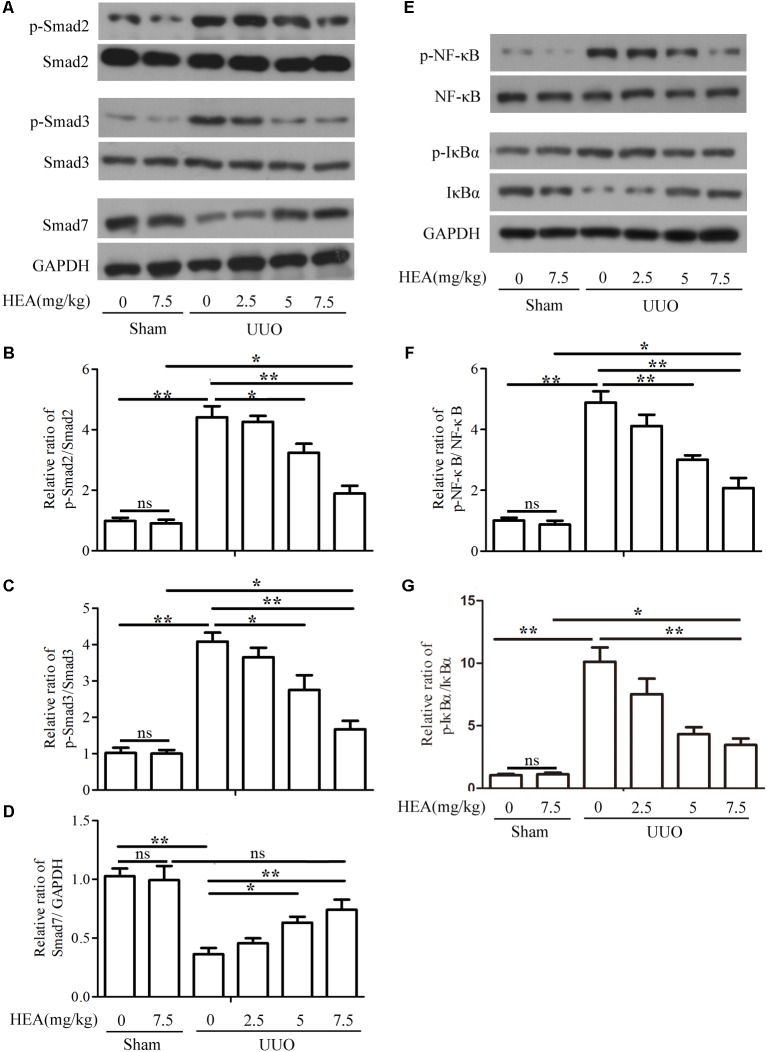
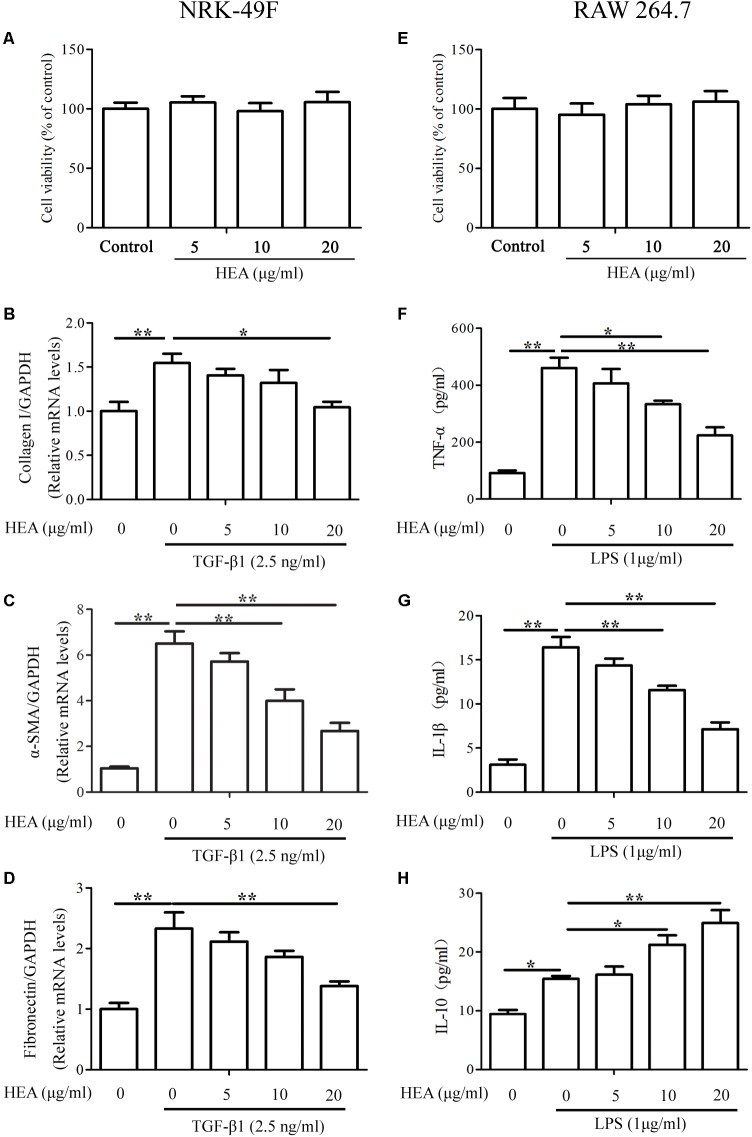
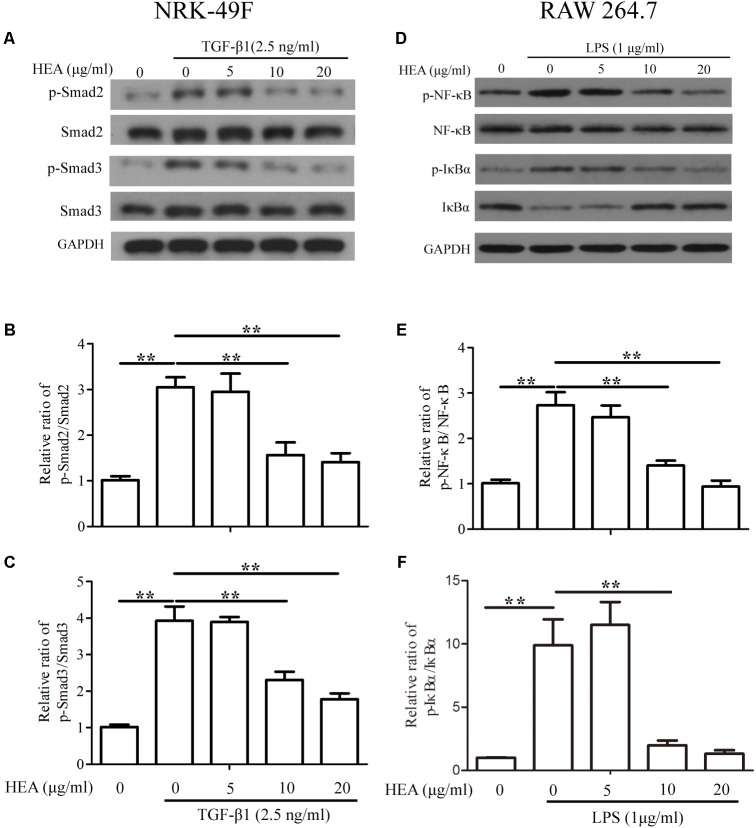
Renal interstitial fibrosis is characterized by inflammation and an excessive accumulation of extracellular matrix, which leads to end-stage renal failure. Our previous studies have shown that a natural product from Cordyceps cicadae can ameliorate chronic kidney diseases. N6-(2-Hydroxyethyl) adenosine (HEA), a physiologically active compound in C. cicadae, has been identified as a Ca2+ antagonist and an anti-inflammatory agent in pharmacological tests. However, its role in renal interstitial fibrosis and the underlying mechanism remains unclear. Here, unilateral ureteral obstruction (UUO) was used to induce renal interstitial fibrosis in male C57BL/6 mice. Different doses of HEA (2.5, 5, and 7.5 mg/kg) were given by intraperitoneal injection 24 h before UUO, and the treatment was continued for 14 days post-operatively. Histologic changes were examined by hematoxylin & eosin, Masson's trichrome, and picrosirius red stain. Quantitative real-time PCR analysis, enzyme-linked immunosorbent assays, immunohistochemistry, and western blot analysis were used to evaluate proteins levels. And the results showed that HEA significantly decreased UUO-induced renal tubular injury and fibrosis. In vivo, HEA apparently decreased UUO-induced inflammation and renal fibroblast activation by suppression of the NF-κB and TGF-β1/Smad signaling pathway. In vitro, HEA also obviously decreased lipopolysaccharide-induced inflammatory cytokine level in RAW 264.7 cells and TGF-β1-induced fibroblast activation in NRK-49F cells by modulating NF-κB and TGF-β1/Smad signaling. In general, our findings indicate that HEA has a beneficial effect on UUO-induced tubulointerstitial fibrosis by suppression of inflammatory and renal fibroblast activation, which may be a potential therapy in chronic conditions such as renal interstitial fibrosis.

Keywords: Cordyceps cicadae; N6-(2-hydroxyethyl) adenosine; inflammation; renal interstitial fibrosis; unilateral ureteral obstruction.


Figures

FIGURE 1
FIGURE 1
Effect of intraperitoneal administration of HEA on kidney tissue in UUO mice. (A) Two weeks after the operation, the kidneys were weighed; the enlargement of kidneys was improved after HEA treatment. (B) H&E staining revealed improved integrity of the renal parenchymal cells in the ligated kidneys from UUO mice after different doses of HEA treatment, the stained slides were scored by the semi-quantitative percentage of damaged area as follows: 0, none; 0.5, <10%; 1, 10–25%; 2, 25–50%; 3, 50–70%; and 4, >75%. (C) Masson staining showed massive collagen deposition (blue) in the ligated kidneys from UUO mice, and less collagen was observed after HEA treatment. (D) Sirius red-stained kidney sections also indicated that HEA treatment could strikingly decrease collagen deposition (red) in UUO (Original magnification ×200). The area of connective tissue was assessed and quantified by Image J. HEA (2.5 mg/kg), HEA (5 mg/kg), and HEA (7.5 mg/kg): different dose of HEA treatment (2.5, 5, and 7.5 mg/kg, respectively). The data are presented as the means ± SEM. P < 0.05 and ∗∗P < 0.01. Scale bar = 100 μM.
FIGURE 2
FIGURE 2
Effect of HEA treatment on fibrosis-related gene and protein expression in ligated kidneys. (A–D) Relative mRNA levels of TGF-β1, α-SMA, collagen I, and Fibronectin expression in kidneys detected by PCR. (E) Representative photographs showing protein expression of TGF-β1, α-SMA, collagen I and Fibronectin in the ligated kidney by western blot analysis. (F–I) Semi-quantitative analyses versus (E). (J,K) The expression of TGF-β1 and α-SMA in ligated kidneys detected by immunohistochemistry. The relative results showed that HEA treatment reduced TGF-β1, α-SMA, collagen I and Fibronectin levels in the left ligated kidney. The data are presented as the means ± SEM. P < 0.05 and ∗∗P < 0.01. Scale bar = 100 μM.
FIGURE 3
FIGURE 3
Effect of HEA on inflammatory cytokines in ligated kidneys. (A–D) HEA treatment significantly reduced the mRNA levels of the inflammatory cytokines TNF-α, IL-6, and IL-1β, while increasing IL-10. (E–H) Representative ELISA for inflammatory markers (TNF-α, IL-6, IL-1β, and IL-10) in ligated kidney tissue. The data are presented as the means ± SEM. P < 0.05 and ∗∗P < 0.01.
FIGURE 4
FIGURE 4
Effect of HEA on macrophage phenotype in UUO mice. Representative immunofluorescence images of F4/80-labeled macrophages (green) from the sham and UUO groups. M1 macrophages were immunostained with inducible nitric oxide synthase (iNOS) and M2 macrophages were immunostained with IL-10. DAPI labels in the nucleus (blue) (Magnification ×600). (A) HEA blocked the accumulation of M1 macrophages and induced the accumulation of M2 macrophages in UUO kidneys (B) iNOS and IL-10 expression were examined by western blot (C) and semi-quantified by normalization to GAPDH (D,E). The data are presented as the means ± SEM. P < 0.05 and ∗∗P < 0.01. Scale bar = 20 μM.
FIGURE 5
FIGURE 5
Effect of HEA on UUO-induced TGF-β1/Smad and NF-κB signaling pathways. (A) Phospho-Smad2/Smad2, phospho-Smad3/Smad3, and Smad7 expression in kidney tissue from sham- and UUO-operated mice treated with vehicle (Veh) or HEA were evaluated by western blotting. (B–D) Data from densitometric analysis of phospho-Smad2, phospho-Smad3, and Smad7 are presented as the relative ratio of each protein to Smad2, Smad3, and GAPDH. The relative ratio measured in the kidneys from sham-operated mice treated with Veh is arbitrarily presented as 1. (E) Representative western blot for p-NF-κB, NF-κB, p-IκBα, IκBα, and GAPDH. (F,G) The ratio of p-NF-κB normalized to NF-κB protein levels, and the ratio of p-IκBα normalized with IκBα. The data are presented as the means ± SEM. P < 0.05 and ∗∗P < 0.01.
FIGURE 6
FIGURE 6
Effect of HEA on cell viability, fibrosis, and inflammation in the in vitro assay. (A,E) Cell viability was assessed with a MTT assay after NRK-49F and RAW 264.7 cells were incubated with 5, 10, and 20 μg/ml HEA for 24 h; 0 μg/ml HEA was used as the control group. NRK-49F and RAW 264.7 cells were pretreated with HEA for 1 h and then stimulated by transforming growth factor-β (TGF-β; 2.5 ng/ml) and lipopolysaccharide (LPS; 1 μg/ml) 24 h. After a 24 h incubation, the NRK-49F cells were analyzed by PCR for collagen I (B), α-SMA (C), and Fibronectin (D). RAW 264.7 cells were analyzed by ELISA for TNF-α (F), IL-1β (G), and IL-10 (H), respectively. The data are presented as the means ± SEM. P < 0.05 and ∗∗P < 0.01.
FIGURE 7
FIGURE 7
Effect of HEA on transforming growth factor (TGF)-β1 or lipopolysaccharide (LPS)-induced TGF-β1/Smad and NF-κB signaling pathway in vitro. NRK-49F and RAW 264.7 cells were pretreated with HEA for 1hn and then stimulated by TGF-β1 (2.5 ng/ml) and LPS (1 μg/ml). After 24 h incubation, both cell lines were subjected to western blot analysis for P-Smad2/Smad2, P-Smad3/Smad3 (A) and p-NF-κB/NF-κB, p-IκBα/IκBα (D). (B,C) Data from densitometric analysis of P-Smad2 and P-Smad3 are presented as the relative ratio of each protein to Smad2 and Smad3. (E–F) The ratio of p-NF-κB normalized to NF-κB protein levels, and the ratio of p-IκBα normalized to IκBα. The data are presented as the means ± SEM. P < 0.05 and ∗∗P < 0.01.

Similar articles

Cited by

References

    1. Anders H. J., Ryu M. (2011). Renal microenvironments and macrophage phenotypes determine progression or resolution of renal inflammation and fibrosis. Kidney Int. 80 915–925. 10.1038/ki.2011.217 - DOI - PubMed
    1. Cao Q., Wang Y., Niu Z., Wang C., Wang R., Zhang Z., et al. (2018). Potentiating tissue-resident type 2 innate lymphoid cells by IL-33 to prevent renal ischemia-reperfusion injury. J. Am. Soc. Nephrol. 29 961–976. 10.1681/ASN.2017070774 - DOI - PMC - PubMed
    1. Chen J. B., Liu W. J., Che H., Liu J., Sun H. Y., Li G. R. (2012). Adenosine-5′-triphosphate up-regulates proliferation of human cardiac fibroblasts. Br. J. Pharmacol. 166 1140–1150. 10.1111/j.1476-5381.2012.01831.x - DOI - PMC - PubMed
    1. Eddy A. A., Lopez-Guisa J. M., Okamura D. M., Yamaguchi I. (2012). Investigating mechanisms of chronic kidney disease in mouse models. Pediatr. Nephrol. 27 1233–1247. 10.1007/s00467-011-1938-2 - DOI - PMC - PubMed
    1. Fang M., Chai Y., Chen G., Wang H., Huang B. (2016). N6-(2-Hydroxyethyl)-adenosine exhibits insecticidal activity against plutella xylostella via adenosine receptors. PLoS One 11:e0162859. 10.1371/journal.pone.0162859 - DOI - PMC - PubMed