Review
. 2018 Sep 4:9:1243.
doi: 10.3389/fphys.2018.01243. eCollection 2018.

The Peripheral Stalk of Rotary ATPases

Affiliations
Review

The Peripheral Stalk of Rotary ATPases

Lilia Colina-Tenorio et al. Front Physiol. .

Abstract

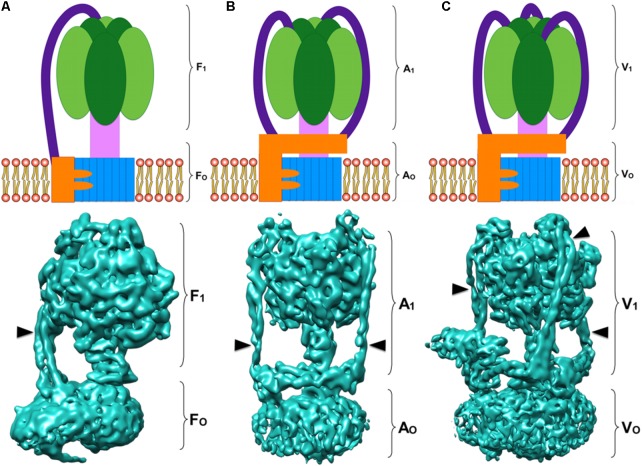
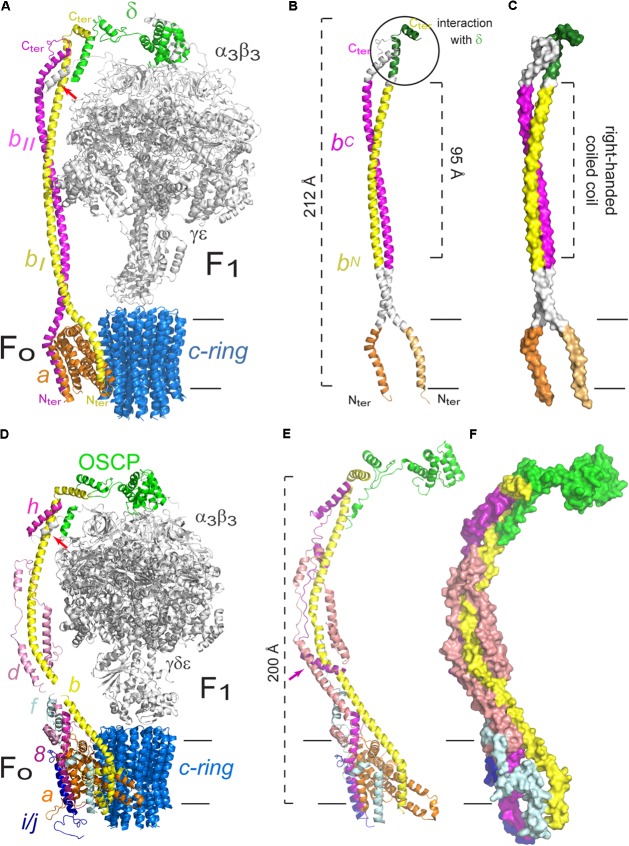
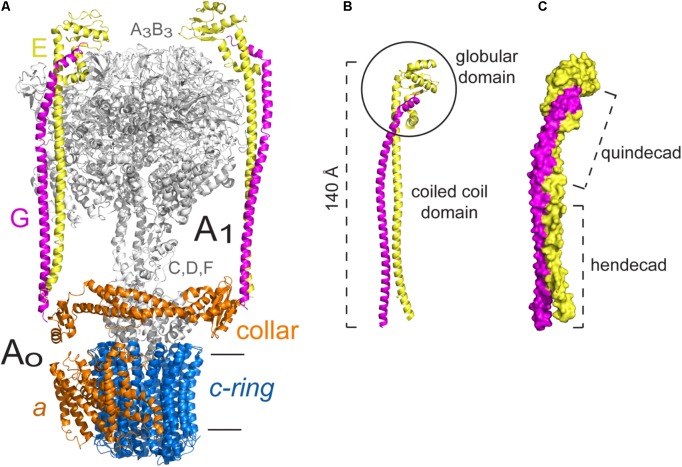
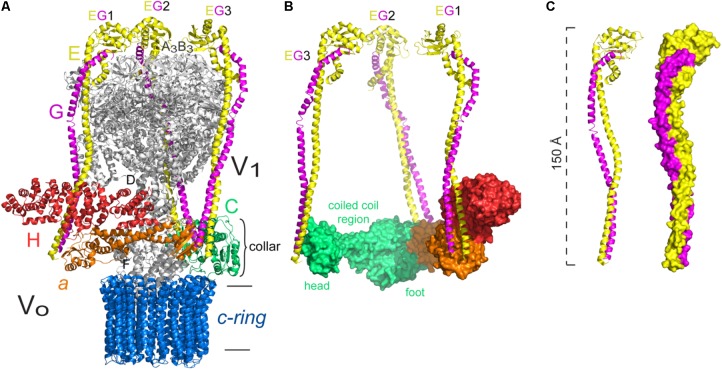
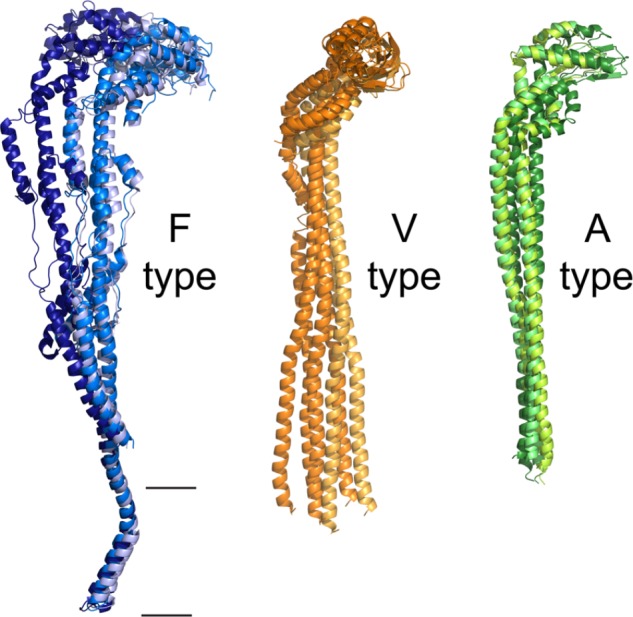
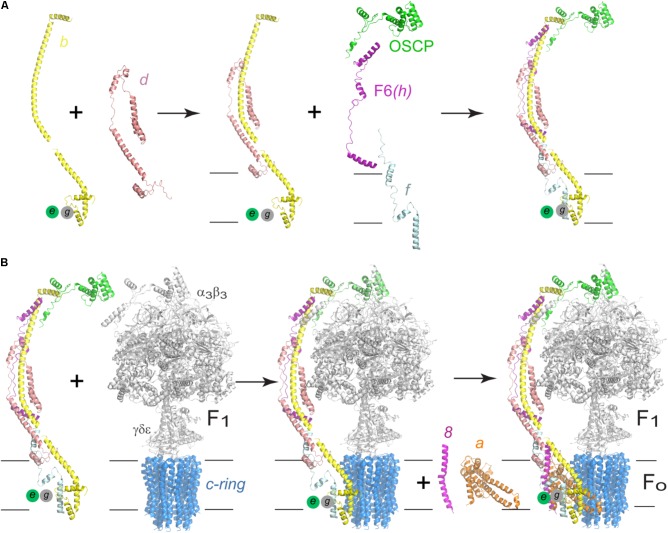
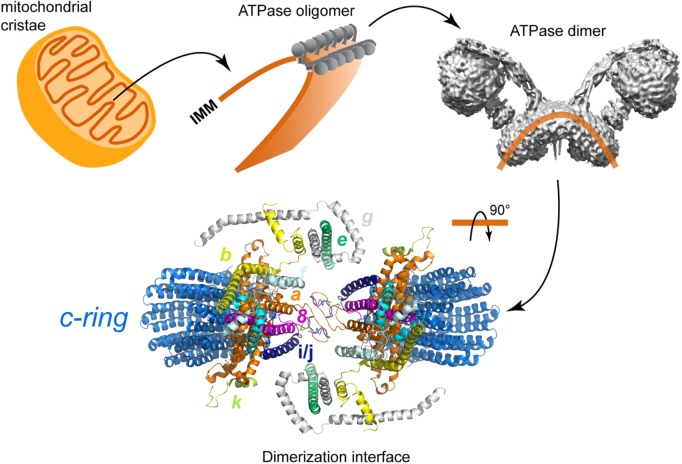
Rotary ATPases are a family of enzymes that are thought of as molecular nanomotors and are classified in three types: F, A, and V-type ATPases. Two members (F and A-type) can synthesize and hydrolyze ATP, depending on the energetic needs of the cell, while the V-type enzyme exhibits only a hydrolytic activity. The overall architecture of all these enzymes is conserved and three main sectors are distinguished: a catalytic core, a rotor and a stator or peripheral stalk. The peripheral stalks of the A and V-types are highly conserved in both structure and function, however, the F-type peripheral stalks have divergent structures. Furthermore, the peripheral stalk has other roles beyond its stator function, as evidenced by several biochemical and recent structural studies. This review describes the information regarding the organization of the peripheral stalk components of F, A, and V-ATPases, highlighting the key differences between the studied enzymes, as well as the different processes in which the structure is involved.

Keywords: ATP synthase; archaea; bacteria; chloroplast; coiled-coils; mitochondria; peripheral stalk.


Figures

FIGURE 1
FIGURE 1
Rotary ATPases. (A) Schematic representation of an F-ATPase (Top) and three dimensional structure of the bovine heart mitochondria F-ATPase (Bottom) (Zhou et al., 2015) EMD 3164. (B) Schematic representation of an A-ATPase (Top) and three dimensional structure of the Thermus thermophilus A-ATPase (Bottom) (Schep et al., 2016) EMD 5335. (C) Schematic representation of a V-ATPase (Top) and three dimensional structure of the Saccharomyces cerevisiae V-ATPase (Bottom) (Zhao et al., 2015) EMD 6285. All the three dimensional maps were generated from electron cryo-microscopy images. The colors in the schematizations represent: catalytic core in dark and light green, central rotor in light pink, c-ring oligomer in blue, subunit a in orange, and peripheral stalks in dark purple. The arrowheads point to the peripheral stalk(s).
FIGURE 2
FIGURE 2
Peripheral stalk of prokaryotic and eukaryotic F-ATPases. (A) Three dimensional model of the enzyme of Escherichia coli in which the peripheral stalk and the FO sector are colored. (B) Model that highlights the different domains of the b2 dimer. The C-terminus (C-ter) and N-terminus (N-ter) of subunit b are indicated. (C) Model to illustrate the right-handed coiled coil domain of the b2 dimer. The model used in A–C corresponds to the structural data deposited with the PDB 5T4O (Sobti et al., 2016). (D) Three dimensional model of the enzyme of Saccharomyces cerevisiae in which the peripheral stalk and the FO sector are colored. The helix of subunit α that contacts b, d and F6 is indicated with a red arrow. (E) Peripheral stalk of the yeast ATPase highlighting its components. The additional helix of subunit h is indicated with a purple arrow. (F) Surface representation to illustrate the coiled coil interactions in the extrinsic part of the yeast peripheral stalk. The model used in D–F corresponds to the structural data deposited with the PDB 6CP6 (Srivastava et al., 2018). The black horizontal lines indicate the mitochondrial inner membrane.
FIGURE 3
FIGURE 3
Working model of the dimeric mitochondrial ATPase of Polytomella sp. The image shows the working model of the 3D structure of the enzyme fitted in the EMD-2852 map contoured at 6 sigma (Allegretti et al., 2015). Color scheme: F1 sector in pink; OSCP in violet; Asa2 in cyan; Asa4 in deep purple; Asa7 in sky blue; Asa1 in yellow; Asa3 in brown (dirty violet); Asa5 in salmon; Asa6 in gray; Asa8 in orange; Asa9 in leaf green; subunit a in deep teal and c-ring in pale cyan.
FIGURE 4
FIGURE 4
Protozoan and metazoan type dimers. Three dimensional maps of dimeric ATP synthases from (A) Saccharomyces cerevisiae (EMD 7067) (Guo et al., 2017) representing a metazoan-type dimer, (B) Polytomella sp. (EMD 2852) (Allegretti et al., 2015), (C) Paramecium tetraurelia (EMD 3441) (Mühleip et al., 2016), and (D) Euglena gracilis (EMD 3559) (Mühleip et al., 2017) representing the protozoan-type dimers. The colors in the schematizations represent: peripheral stalks in dark purple and the inter membrane space density below the c-ring in deep red (C,D).
FIGURE 5
FIGURE 5
Peripheral stalk of the Thermus thermophilus A-ATPase. (A) Three dimensional model of the archaeal enzyme (Schep et al., 2016) PDB 5GAR, in which the peripheral stalks, the collar-like structure made by subunit a and the c-ring are colored. (B) Model of the EG heterodimer in which the coiled coil domain and the globular domain are indicated. (C) Model of the EG heterodimer that illustrates the right handed coiling of the helices and the two types of coiling that result from the hendecad motifs in both subunits, and quindecad repeat motifs in subunit G. The model used in B,C corresponds to the structural data deposited with the PDB 3V6I (Stewart et al., 2012). The black horizontal lines indicate the mitochondrial inner membrane.
FIGURE 6
FIGURE 6
Peripheral stalk of the Saccharomyces cerevisiae V-ATPase. (A) Three dimensional model of the yeast enzyme in which the peripheral stalks and the subunits of the collar-like structure are colored. (B) Model that illustrates the interaction of each peripheral stalk (EG1, EG2, EG3) with the subunits of the collar. The different sections of subunit C are indicated. (C) Models of the EG heterodimer to illustrate the right handed coiling of the helices. The model used in A–C corresponds to structural data deposited with the PDB 3J9V (Zhao et al., 2015). The black horizontal lines indicate the mitochondrial inner membrane.
FIGURE 7
FIGURE 7
Flexibility of the peripheral stalk of rotary ATPases. Flexibility of the peripheral stalk illustrated with the transitions it goes through during the process of rotational catalysis. (A) Models that correspond to the transitions of an F-ATPase peripheral stalk; PDBs 5ARI, 5ARA, 5FIL from Zhou et al. (2015). The membrane section in these models is not accurately represented due to the resolution of the maps. Higher resolution maps have been obtained but only in one rotational state and thus are not useful to illustrate the flexibility of the peripheral stalk. (B) Models that correspond to three rotational states of one of the peripheral stalks of the V-ATPase of S. cerevisiae; PDBs 3J9T, 3J9U, 3J9V from Zhao et al. (2015). (C) Models that correspond to three rotational states of one of the peripheral stalks of the A-ATPase of T. thermophilus; PDBs 5Y5X, 5Y5Z, 5Y60 from Nakanishi et al. (2018). The black horizontal lines indicate the mitochondrial inner membrane.
FIGURE 8
FIGURE 8
Assembly process of the human F-ATPase. (A) A possible assembly pathway of the peripheral stalk based on the data of Fujikawa et al. (2015) and He et al. (2018). (B) One of the possible assembly pathways of the complete enzyme. According to the branched model proposed by He et al. (2018) and Song et al. (2018), another possibility involves an initial b-d-F6-OSCP subcomplex that first joins F1-c-ring after which subunits f, e, and g recruited. The model used in A,B corresponds to the yeast enzyme, PDB 6CP6 from He et al. (2018). The black horizontal lines indicate the mitochondrial inner membrane.
FIGURE 9
FIGURE 9
Schematic representation of the dimerization of the yeast F-ATPase. Model of the FO section in which all the subunits involved in the dimerization are colored: subunit a in hot pink, subunit b in cyan, subunit e in brown, subunit g in pale blue, subunit j in dark blue, and subunit k in lemon. The dimerization interface includes the subunits proposed by Habersetzer et al. (2013) and Guo et al. (2017). The model corresponds to the structural data deposited with the PDB 6B2Z (Guo et al., 2017).

Similar articles

Cited by

References

    1. Allegretti M., Klusch N., Mills D. J., Vonck J., Kühlbrandt W., Davies K. M. (2015). Horizontal membrane-intrinsic α-helices in the stator a-subunit of an F-type ATP synthase. Nature 521 237–240. 10.1038/nature14185 - DOI - PubMed
    1. Anselmi C., Davies K. M., Faraldo-Gómez J. D. (2018). Mitochondrial ATP synthase dimers spontaneously associate due to a long-range membrane-induced force. J. Gen. Physiol. 150 763–770. 10.1085/jgp.201812033 - DOI - PMC - PubMed
    1. Arnold I., Pfeiffer K., Neupert W., Stuart R. A., Scha H. (1998). Yeast mitochondrial F 1 F 0 -ATP synthase exists as a dimer: identi cation of three dimer-speci c subunits. EMBO J. 17 7170–7178. 10.1093/emboj/17.24.7170 - DOI - PMC - PubMed
    1. Arnold I., Pfeiffer K., Neupert W., Stuart R. A., Schägger H. (1999). ATP synthase of yeast mitochondria. J. Biol. Chem. 274 36–40. 10.1074/jbc.274.1.36 - DOI - PubMed
    1. Baker L. A., Watt I. N., Runswick M. J., Walker J. E., Rubinstein J. L. (2012). Arrangement of subunits in intact mammalian mitochondrial ATP synthase determined by cryo-EM. Proc. Natl. Acad. Sci. U.S.A. 109 11675–11680. 10.1073/pnas.1204935109 - DOI - PMC - PubMed

LinkOut - more resources