. 2018 Sep 3:9:1850.
doi: 10.3389/fmicb.2018.01850. eCollection 2018.

The Effect of Strain Level Diversity on Robust Inference of Virus-Induced Mortality of Phytoplankton

Affiliations

The Effect of Strain Level Diversity on Robust Inference of Virus-Induced Mortality of Phytoplankton

Stephen J Beckett et al. Front Microbiol. .

Abstract

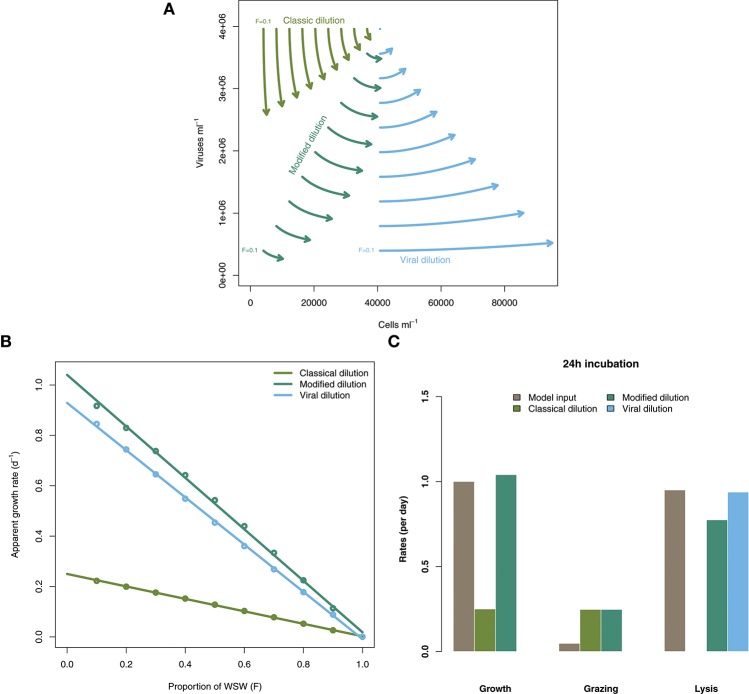
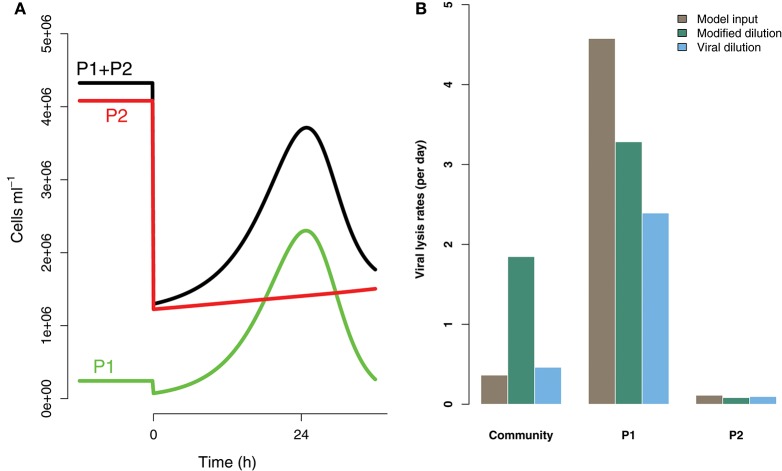
Infection and lysis of phytoplankton by viruses affects population dynamics and nutrient cycles within oceanic microbial communities. However, estimating the quantitative rates of viral-induced lysis remains challenging in situ. The modified dilution method is the most commonly utilized empirical approach to estimate virus-induced killing rates of phytoplankton. The lysis rate estimates of the modified dilution method are based on models which assume virus-host interactions can be represented by a single virus and a single host population with homogeneous life-history traits. Here, using modeling approaches, we examine the robustness of the modified dilution method in multi-strain, complex communities. We assume that strains differ in their life history traits, including growth rates (of hosts) and lysis rates (by viruses). We show that trait differences affect resulting experimental dynamics such that lysis rates measured using the modified dilution method may be driven by the fastest replicating strains; which are not necessarily the most abundant in situ. We discuss the implications of using the modified dilution method and alternative dilution-based approaches for estimating viral-induced lysis rates in marine microbial communities.

Keywords: dilution method; diversity; trait-based models; viral lysis; viruses.


Figures

Figure 1
Figure 1
Schematic representing the modified dilution method. (A) Scheme to generate the classical dilution series (top), by mixing WSW with a diluent that filters out phytoplankton and grazers; and the modified dilution series (bottom) by mixing WSW with a diluent that filters out viruses (V), phytoplankton (P) and grazers (G). (B) A diagram showing growth and mortality processes of phytoplankton P. (C) Idealized apparent growth curves from the classical and modified dilution series. Viral lysis rates are estimated based on the differences between slopes of the classic and modified dilution curves.
Figure 2
Figure 2
Schematic representing mortality processes affecting the phytoplankton. The sum of three mortality processes: grazing, viral-induced lysis, and niche competition must add to 100%. Grazing and lysis are indicated on the axes, whilst niche competition is indicated by shading. 5, 50, and 95% isoclines of niche competition are labeled.
Figure 3
Figure 3
Inference of ecological rates using dilution methods. (A) Population dynamics of phytoplankton cells and viruses within individual incubation bottles from the classical, modified and virus dilution series between 0 and 24 h. The intital sampled concentrations of cells and viruses (F = 1) are shown as the single point. (B) Dilution curves constructed from calculations of apparent growth rates within each of the incubation bottles at 24 h. (C) Comparing model rate inputs to dilution-based rate estimates of growth, grazing, and viral induced lysis derived from the dilution curves.
Figure 4
Figure 4
Rate estimates (Left) and bias (Right) of viral lysis rate in the baseline model following 24 h incubation. Each row shows a different level of niche competition as indicated by the lines across Figure 2 (top: 5%, middle: 50%, bottom: 95% niche competition).
Figure 5
Figure 5
Rate estimates (Left) and bias (Right) of viral lysis rate in the baseline model following 2 h incubation. Each row shows a different level of niche competition as indicated by the lines across Figure 2 (top: 5%, middle: 50%, bottom: 95% niche competition).
Figure 6
Figure 6
Density of estimation bias in the baseline model made by the MDiM and VDiM for incubations of 2 h (Left) and 24 h (Right). Density plots are from N simulations (out of 500) from random latin hypercube sampled parameter choices.
Figure 7
Figure 7
Density of estimation bias in the infected class model, with (A) 15 min latent period (B) 4 h latent period (C) 24 h latent period, made by the MDiM and VDiM for incubations of 2 h (left) and 24 h (right). Density plots are from N simulations (out of 500) from random latin hypercube sampled parameter choices.
Figure 8
Figure 8
Differences between strains may hinder efforts to estimate lysis rates. (A) Phytoplankton population dynamics during an incubation experiment in the modified dilution series with F = 0.3. Here phytoplankton type P1 grows much faster than type P2, but has a lower steady state abundance (population level before t = 0 h). (B) The viral lysis rate model input and estimated rates for the system shown in (A). Viral lysis rates are measured at the community- and type-level.
Figure 9
Figure 9
Estimation bias in viral lysis rates by the modified dilution method (Left) and viral dilution method (Right) following a 2 h incubation. Rows show community-wide estimates (Top), P1 estimates (Middle), and P2 estimates (Bottom). White contours indicate an estimation bias equal to one, where the estimated rate is equal to the model input.
Figure 10
Figure 10
Estimation bias in viral lysis rates by the modified dilution method (Left) and viral dilution method (Right) following a 24 h incubation. Rows show community-wide estimates (Top), P1 estimates (Middle), and P2 estimates (Bottom). White contours indicate an estimation bias equal to one, where the estimated rate is equal to the model input. Red contours indicate an estimation bias of zero. This shows where dilution slopes go from negative to positive such that estimates of viral lysis rates take negative values.

References

    1. Arias A., Saiz E., Calbet A. (2017). Diel feeding rhythms in marine microzooplankton: effects of prey concentration, prey condition, and grazer nutritional history. Mar. Biol. 164:205 10.1007/s00227-017-3233-7 - DOI
    1. Aylward F. O., Boeuf D., Mende D. R., Wood-Charlson E. M., Vislova A., Eppley J. M., et al. . (2017). Diel cycling and long-term persistence of viruses in the ocean's euphotic zone. Proc. Natl. Acad. Sci. U.S.A. 114, 11446–11451. 10.1073/pnas.1714821114 - DOI - PMC - PubMed
    1. Beckett S. J., Weitz J. S. (2017). Disentangling niche competition from grazing mortality in phytoplankton dilution experiments. PLoS ONE 12:e0177517. 10.1371/journal.pone.0177517 - DOI - PMC - PubMed
    1. Beckett S. J., Weitz J. S. (2018). Code for: The effect of strain level diversity on robust inference of virus-induced mortality of phytoplankton. Zenodo. 10.5281/zenodo.1189793 - DOI - PMC - PubMed
    1. Breitbart M., Bonnain C., Malki K., Sawaya N. (2018). Phage puppet masters of the marine microbial realm. Nat. Microbiol. 3, 754–766. 10.1038/s41564-018-0166-y - DOI - PubMed

LinkOut - more resources