. 2018 Aug 31:9:1940.
doi: 10.3389/fmicb.2018.01940. eCollection 2018.

Comparison of Highly and Weakly Virulent Dickeya solani Strains, With a View on the Pangenome and Panregulon of This Species

Affiliations

Comparison of Highly and Weakly Virulent Dickeya solani Strains, With a View on the Pangenome and Panregulon of This Species

Malgorzata Golanowska et al. Front Microbiol. .

Abstract

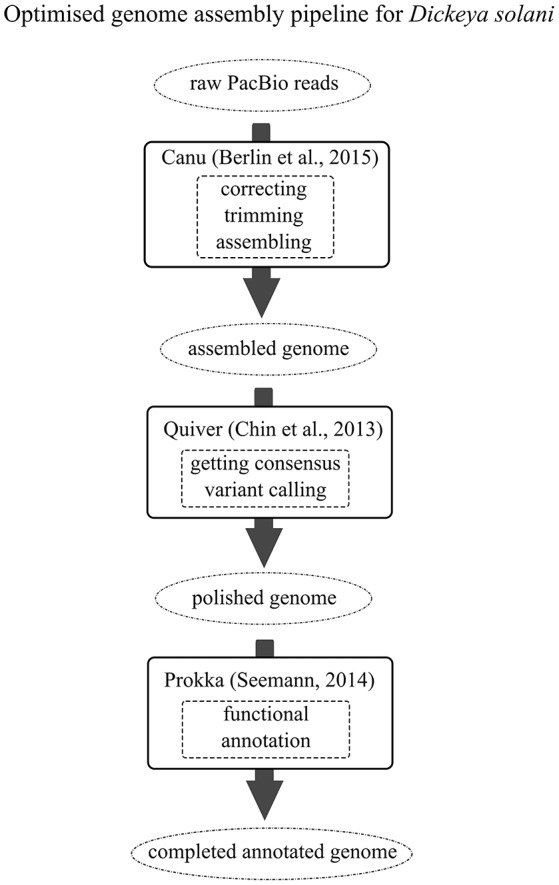
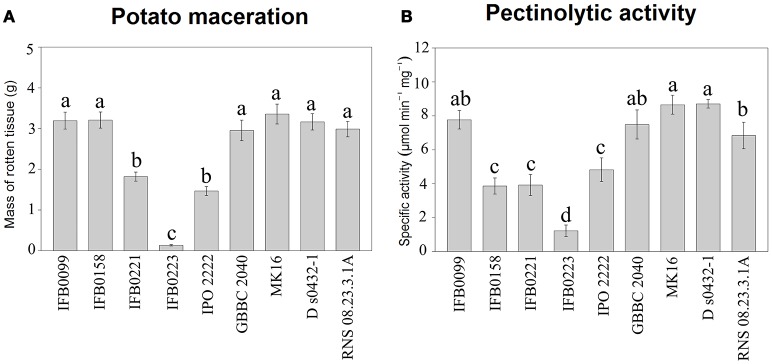
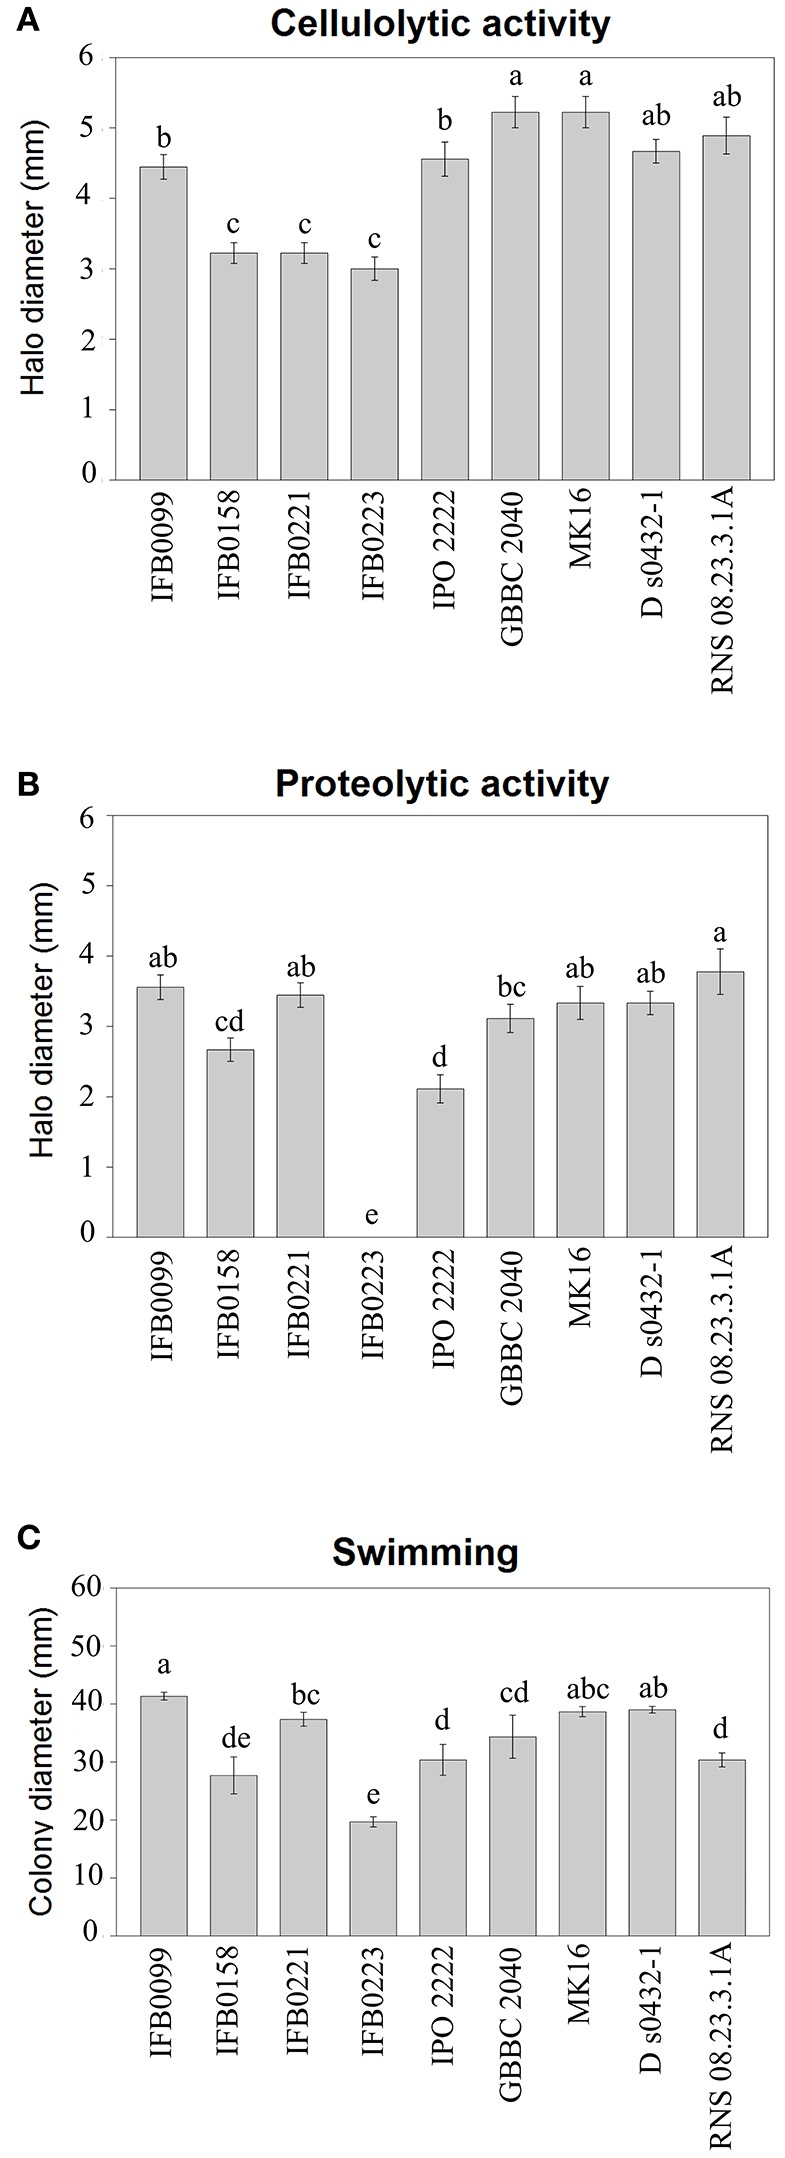
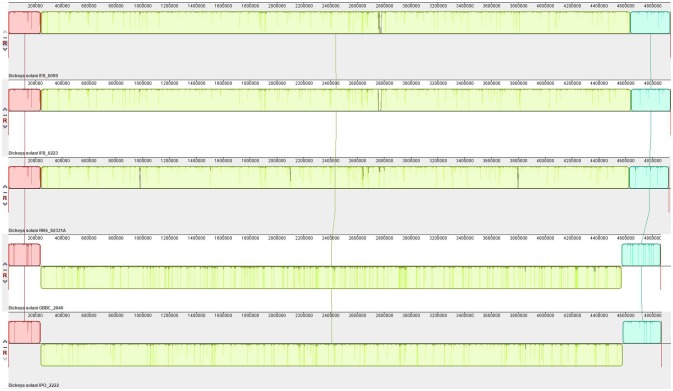
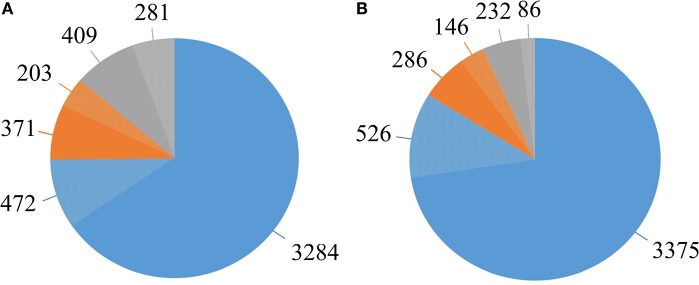
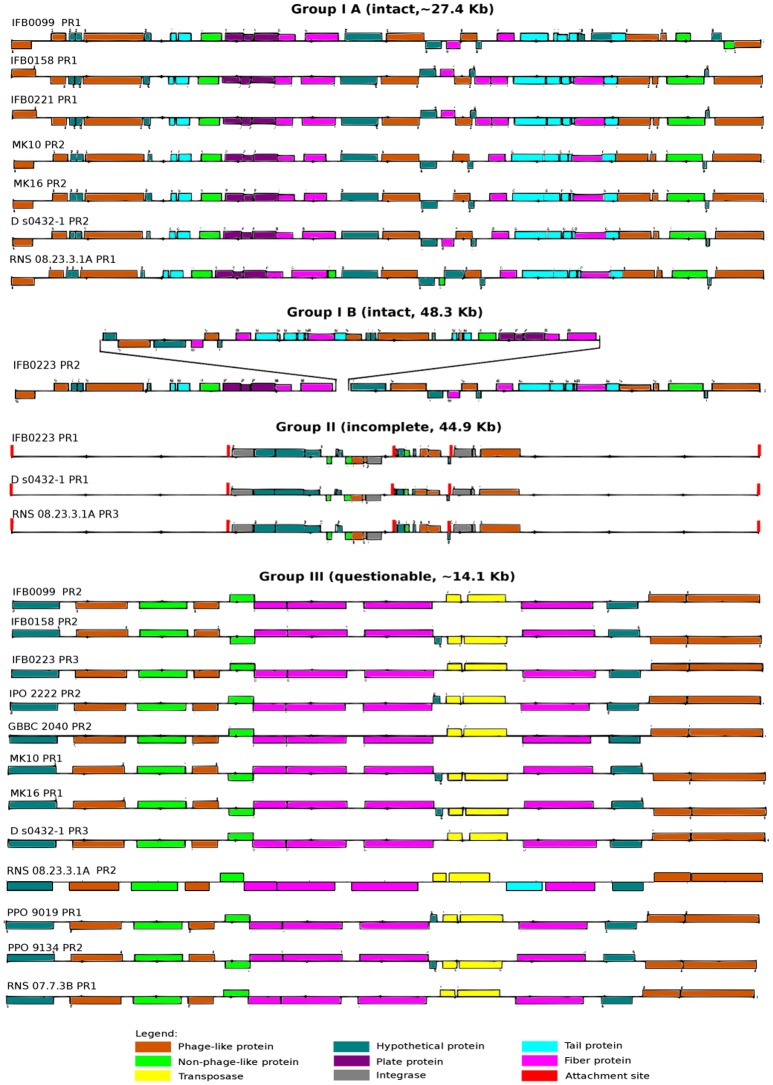
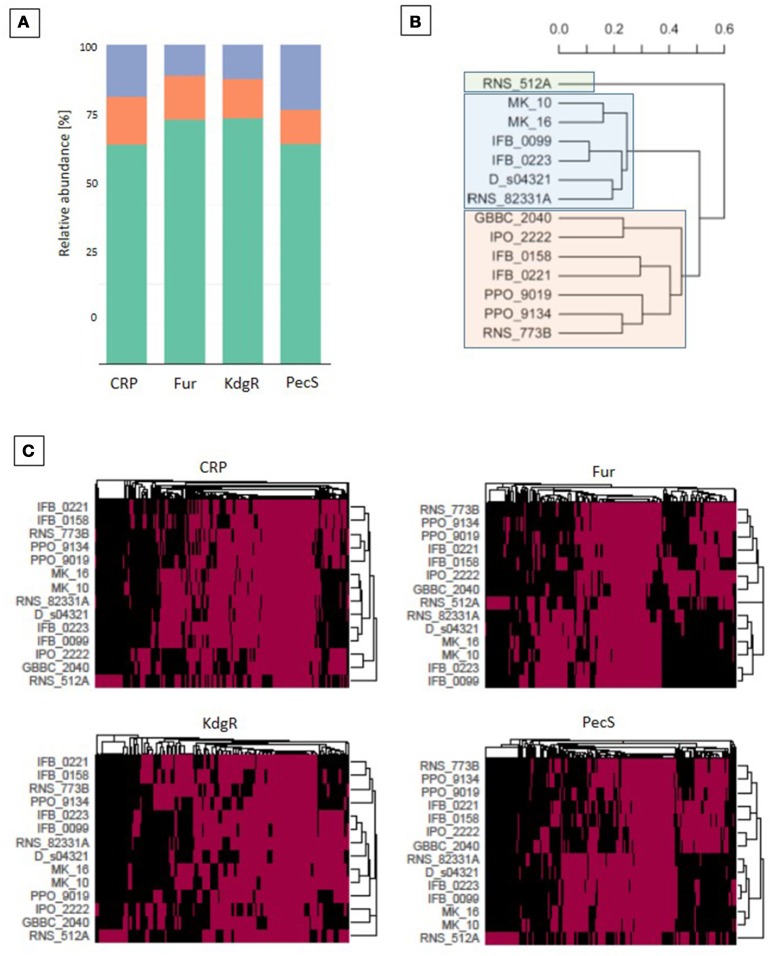
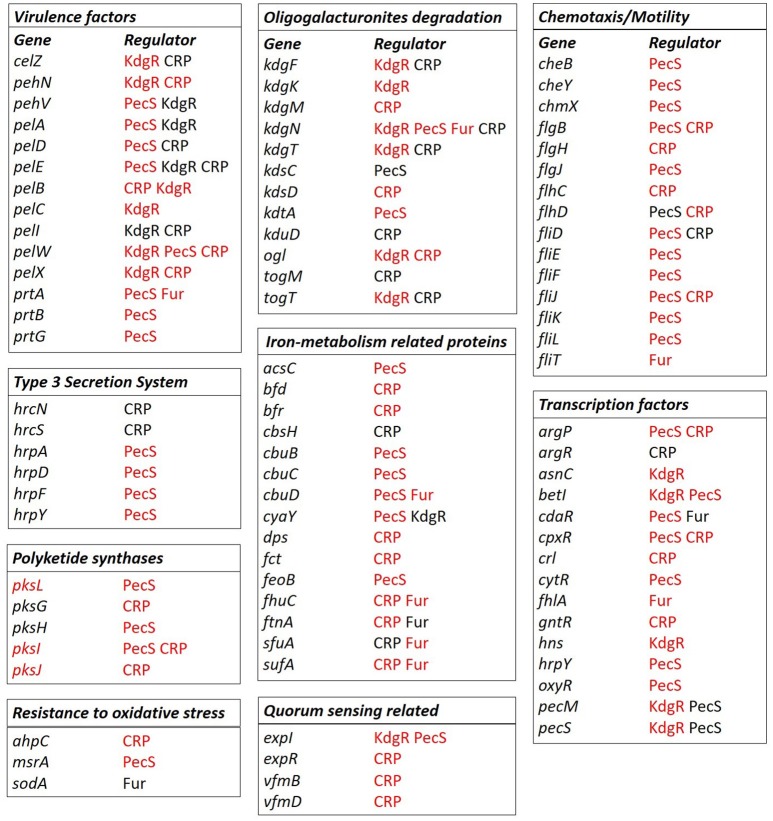
Bacteria belonging to the genera Dickeya and Pectobacterium are responsible for significant economic losses in a wide variety of crops and ornamentals. During last years, increasing losses in potato production have been attributed to the appearance of Dickeya solani. The D. solani strains investigated so far share genetic homogeneity, although different virulence levels were observed among strains of various origins. The purpose of this study was to investigate the genetic traits possibly related to the diverse virulence levels by means of comparative genomics. First, we developed a new genome assembly pipeline which allowed us to complete the D. solani genomes. Four de novo sequenced and ten publicly available genomes were used to identify the structure of the D. solani pangenome, in which 74.8 and 25.2% of genes were grouped into the core and dispensable genome, respectively. For D. solani panregulon analysis, we performed a binding site prediction for four transcription factors, namely CRP, KdgR, PecS and Fur, to detect the regulons of these virulence regulators. Most of the D. solani potential virulence factors were predicted to belong to the accessory regulons of CRP, KdgR, and PecS. Thus, some differences in gene expression could exist between D. solani strains. The comparison between a highly and a low virulent strain, IFB0099 and IFB0223, respectively, disclosed only small differences between their genomes but significant differences in the production of virulence factors like pectinases, cellulases and proteases, and in their mobility. The D. solani strains also diverge in the number and size of prophages present in their genomes. Another relevant difference is the disruption of the adhesin gene fhaB2 in the highly virulent strain. Strain IFB0223, which has a complete adhesin gene, is less mobile and less aggressive than IFB0099. This suggests that in this case, mobility rather than adherence is needed in order to trigger disease symptoms. This study highlights the utility of comparative genomics in predicting D. solani traits involved in the aggressiveness of this emerging plant pathogen.

Keywords: Pectobacteriaceae; adhesin; genome comparison; prophages; regulon comparison.


Figures

Figure 1
Figure 1
The optimized genome assembly pipeline for D. solani. Black arrows indicate the genomic assembly pipeline to follow. Different completeness stages of the constructed genome are presented within the dotted circles. Black boxes include data on the open source software and the corresponding literature references. Functions provided by certain software are enclosed within the dashed boxes.
Figure 2
Figure 2
Potato tuber tissue maceration ability and pectinolytic activity of the D. solani strains. (A) Maceration ability in grams of macerated tissue, 48 h post inoculation. (B) Total pectate lyase specific activity (μmol min−1 mg−1) in the presence of polygalacturonic acid. Means ± standard errors are depicted, n = 10 for (A) and n = 3 for (B). Within each panel mean values marked with different letters are significantly different by Kruskal–Wallis test followed by post hoc analysis using Fisher's least significant difference criterion (R agricolae package). All statistical hypotheses were tested at p < 0.05.
Figure 3
Figure 3
Phenotypic characterization of D. solani strains. (A) Cellulase production was estimated by the diameter (mm) of the haloes observed on the detection plates. (B) Protease production was estimated by the diameter (mm) of the haloes observed on the detection plates. (C) Motility was estimated by the diameter (mm) of the spread of the colonies in the low amount of agar (3 g l−1) medium. All the experiments were performed three times. Means ± standard errors are depicted, n = 3. Within each panel, mean values marked with different letters are significantly different by Kruskal–Wallis test followed by post hoc analysis using Fisher's least significant difference criterion (R agricolae package). All statistical hypotheses were tested at p < 0.05.
Figure 4
Figure 4
Synteny of the D. solani genomes. Pairwise alignments of genomes were generated by Mauve 2.4.0 (development snapshot Mauve_2015_02_26). Inside each block a similarity profile of the genomic sequence is presented. Height of the similarity profile corresponds to the average level of genomic conservation in that region. Areas that are completely white were not aligned and probably contain sequence elements specific to a particular genome. Height of the similarity profile is inversely proportional to the average alignment column entropy over a region of alignment.
Figure 5
Figure 5
The D. solani pangenome shape. (A) Pangenome shape based on the number of genes in all 14 strains. (B) Pangenome shape after exclusion of strain RNS 05.1.2A. Blue—represents the core genome. Orange—represents the accessory genome. Gray—represents the unique genome. Lighter shades of each color represent the fractions of genes annotated as hypothetical proteins.
Figure 6
Figure 6
Prophages present in the D. solani genomes. Prophages are divided into three groups: intact (IA and IB), incomplete (II) and questionable (III) on the basis of structural analysis based on data provided by PHAST on-line web server (http://phast.wishartlab.com/; Zhou et al., 2011).
Figure 7
Figure 7
Regulon analysis based on binding sites predictions. Predictions of the transcription regulators (CRP, Fur, KdgR, and PecS) binding sites were made with the use of MAST version 4.10.1. (Bailey and Elkan, 1994) and the version 1.62b of the Bio.motifs package from the Biopython library (Cock et al., 2009). (A) The regulon representation for the 4 transcription regulators (TFs): in orange for core, green for accessory, violet for unique TF targets. (B) Phylogenetic tree based on the total regulons predicted for the 4 TFs. The UPGMA methods on Jaccard distance were utilized for phylogenetic analysis. (C) Heatmaps for CRP, Fur, KdgR and PecS TFs, which represent all predicted genes that are putatively regulated by the selected TF. A red box indicates the presence whereas a black one indicates the absence of a TF binding site in the upstream region of the gene.
Figure 8
Figure 8
Selected regulons of D. solani based on binding sites predictions. Predictions of the CRP, Fur, KdgR, and PecS (TFs) binding sites were conducted with the use of MAST version 4.10.1. (Bailey and Elkan, 1994) and Bio.motifs package from Biopython library (version 1.62b) (Cock et al., 2009) for the virulence factors: proteins involved in pectin and oligogalacturonide degradation, chemotaxis, and motility, iron metabolism, polyketide synthesis, resistance to oxidative stress, transcription factors, quorum sensing-related proteins and T3SS components. Gene names are marked in black when the genes belong to the core genome and in red when the genes belong to the accessory genome fractions. The TFs name is given in black to indicate the core regulon, and in red to indicate the accessory regulon.

References

    1. Adeolu M., Alnajar S., Naushad S., Gupta R. (2016). Genome-based phylogeny and taxonomy of the “Enterobacteriales”: proposal for Enterobacterales ord. nov. divided into the families Enterobacteriaceae, Erwiniaceae fam. nov., Pectobacteriaceae fam. nov., Yersiniaceae fam. nov., Hafniaceae fam. nov., Morganellaceae fam. nov., and Budviciaceae fam. nov. Int. J. Syst. Evol. Microbiol. 66, 5575–5599. 10.1099/ijsem.0.001485 - DOI - PubMed
    1. Bailey T. L., Elkan C. (1994). Fitting a Mixture Model by Expectation Maximization to Discover Motifs in Biopolymers. UCSD Technical Report CS94-351. Toronto, ON: University of California San Diego (UCSD). - PubMed
    1. Bankevich A., Nurk S., Antipov D., Gurevich A. A., Dvorkin M., Kulikov A. S., et al. (2012). SPAdes: a new genome assembly algorithm and its applications to single-cell sequencing. J. Comput. Biol. 19, 455–477. 10.1089/cmb.2012.0021 - DOI - PMC - PubMed
    1. Barras F., van Gijsegem F., Chatterjee A. K. (1994). Extracellular enzymes and pathogenesis of soft-rot Erwinia. Annu. Rev. Phytopathol. 32, 201–234. 10.1146/annurev.py.32.090194.001221 - DOI
    1. Berlin K., Koren S., Chin C. S., Drake J., Landolin J. M., Phillippy A. M. (2015). Assembling large genomes with single-molecule sequencing and locality sensitive hashing. Nat. Biotechnol. 33, 623–630. 10.1038/nbt.3238 - DOI - PubMed

LinkOut - more resources