. 2018 Sep 4:5:83.
doi: 10.3389/fmolb.2018.00083. eCollection 2018.

Quantification of Intrinsically Disordered Proteins: A Problem Not Fully Appreciated

Affiliations

Quantification of Intrinsically Disordered Proteins: A Problem Not Fully Appreciated

Sara Contreras-Martos et al. Front Mol Biosci. .

Abstract

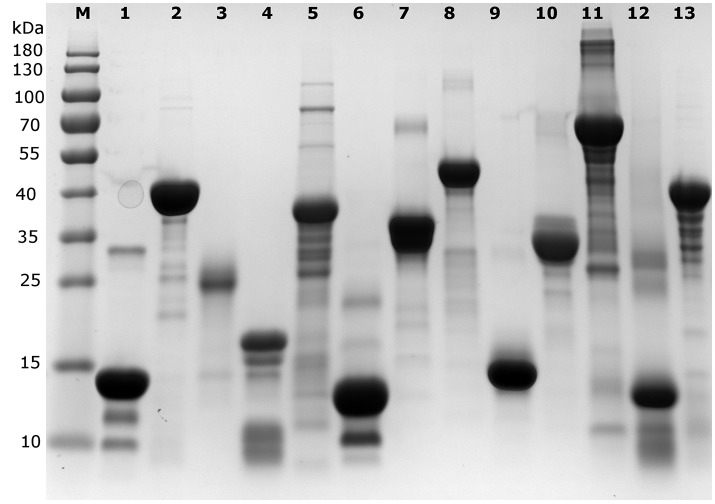
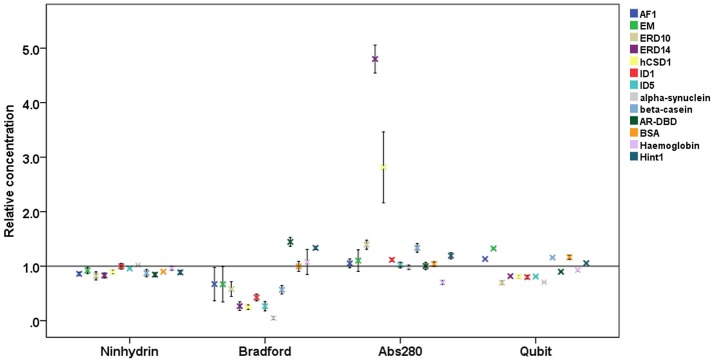
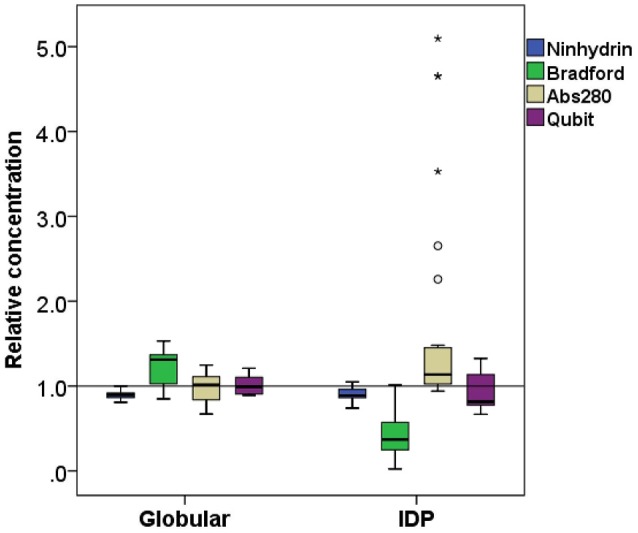
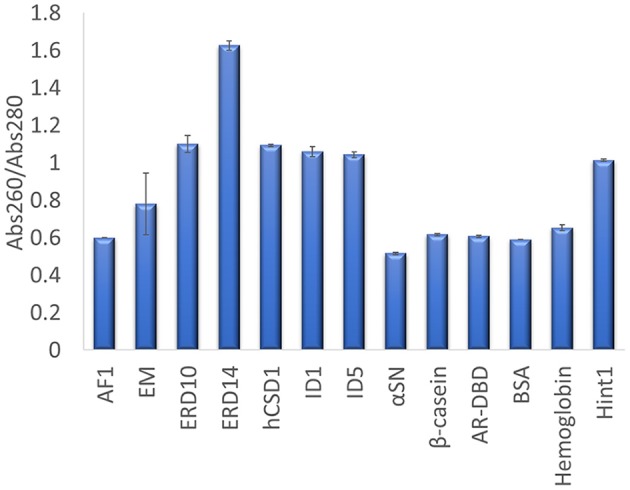
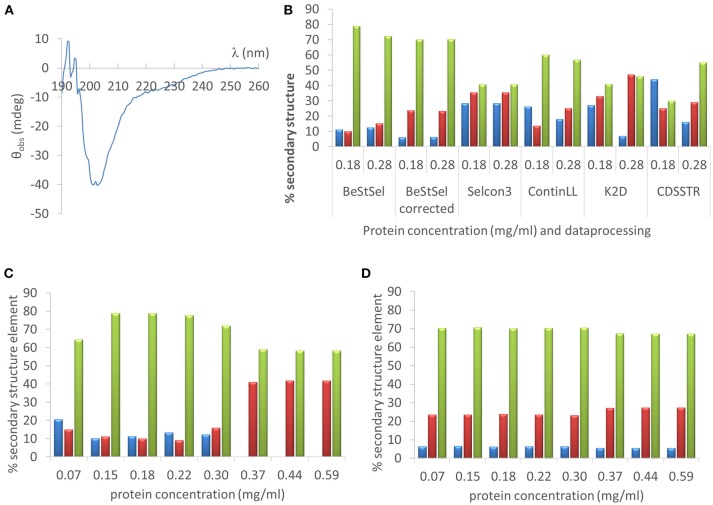
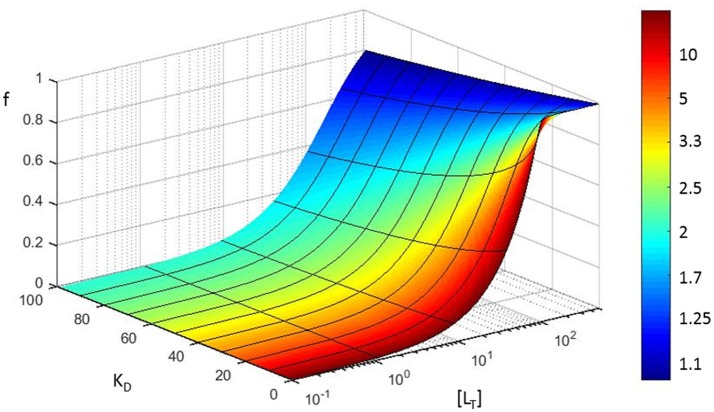
Protein quantification is essential in a great variety of biochemical assays, yet the inherent systematic errors associated with the concentration determination of intrinsically disordered proteins (IDPs) using classical methods are hardly appreciated. Routinely used assays for protein quantification, such as the Bradford assay or ultraviolet absorbance at 280 nm, usually seriously misestimate the concentrations of IDPs due to their distinct and variable amino acid composition. Therefore, dependable method(s) have to be worked out/adopted for this task. By comparison to elemental analysis as the gold standard, we show through the example of four globular proteins and nine IDPs that the ninhydrin assay and the commercial QubitTM Protein Assay provide reliable data on IDP quantity. However, as IDPs can show extreme variation in amino acid composition and physical features not necessarily covered by our examples, even these techniques should only be used for IDPs following standardization. The far-reaching implications of these simple observations are demonstrated through two examples: (i) circular dichroism spectrum deconvolution, and (ii) receptor-ligand affinity determination. These actual comparative examples illustrate the potential errors that can be incorporated into the biophysical parameters of IDPs, due to systematic misestimation of their concentration. This leads to inaccurate description of IDP functions.

Keywords: UV absorbance; circular dichroism; coomassie brilliant blue; elemental analysis; error propagation; nanoorange; ninhydrin; protein concentration.


Figures

Figure 1
Figure 1
SDS-PAGE analysis of the proteins used in the different quantification assays. An overloaded gel shows only minor impurities in the proteins obtained from a commercial source or purified in house (cf. Table 1). M indicates the lane with marker proteins and their corresponding apparent molecular weight is indicated on the left (in kDa). The protein samples per lane are as follows: 1: Hint1, 2: ID5, 3: hCSD1, 4: α-synuclein, 5: AF1, 6: DBD, 7: ERD14, 8: ERD10, 9: EM, 10: β-casein, 11: BSA, 12: hemoglobin, 13: ID1.
Figure 2
Figure 2
Relative protein concentrations measured by different assays. Results of the concentration measurements by four different methods of 13 proteins (4 globular proteins and 9 IDPs, cf. Table 1), normalized to the absolute concentration measured by elemental analysis. Plots show mean ± SD for the four different quantification methods.
Figure 3
Figure 3
Comparison of relative concentration measurements of folded and disordered proteins. Box plots of the relative concentration of globular and disordered proteins measured by the four methods ninhydrin, Bradford, Abs280, and Qubit.
Figure 4
Figure 4
Abs260/Abs280 ratio for each protein determined on a Nanodrop. UV absorbance of each protein was measured in triplicate at 260 and 280 nm, to derive their Abs260/Abs280 ratio. The average value is shown and the error bars represent the standard deviation for each protein sample. A high ratio of ERD14 suggests an inherent nucleic acid contamination.
Figure 5
Figure 5
Far UV CD analysis of hCSD1 (A) The far UV CD spectrum of hCSD1 corresponds to a prototypical spectrum of a random coil. (B) Deconvolution of the CD spectrum of hCSD1 by DichroWeb and BeStSel. The CD spectrum was deconvoluted by assuming two different hCSD1 concentrations (0.18 and 0.28 mg/ml) by either BestSel or through the DichroWeb server. BeStSel was run by two different options (without and with concentration correction), whereas on DichroWeb four different algorithms were used (Selcon3, ContinLL, K2D and CDSSTR). (C,D) Deconvolution of the CD spectrum of hCSD1 with BeStSel. The CD spectrum was deconvoluted to yield the % secondary structure composition (α-helix, β-strand and coil) of hCSD1 by BeStSel. The program was run both without (C) and with (D) the application of “Best” factor correction at a broad, but not unrealistic, range of measured concentrations.
Figure 6
Figure 6
Error propagation in fitting a saturation curve to determine the KD of a protein-protein interaction. Based on a simple model (see section Error propagation in the affinity constant), fractional receptor saturation (f) is shown as a function of the total concentration of ligand ([LT]), for different values of the equilibrium dissociation constant (KD). The color coding refers to the increase in fractional error on the calculated equilibrium constant (assuming [Rt] = 100 nM, all concentrations in nM).

References

    1. Abdul-Gader A., Miles A. J., Wallace B. A. (2011). A reference dataset for the analyses of membrane protein secondary structures and transmembrane residues using circular dichroism spectroscopy. Bioinformatics 27, 1630–1636. 10.1093/bioinformatics/btr234 - DOI - PubMed
    1. Andrade M. A., Chacon P., Merelo J. J., Moran F. (1993). Evaluation of secondary structure of proteins from UV circular dichroism spectra using an unsupervised learning neural network. Protein Eng. 6, 383–390. 10.1093/protein/6.4.383 - DOI - PubMed
    1. Bradford M. M. (1976). A rapid and sensitive method for the quantitation of microgram quantities of protein utilizing the principle of protein-dye binding. Anal. Biochem. 72, 248–254. 10.1016/0003-2697(76)90527-3 - DOI - PubMed
    1. Calderon-Celis F., Diez-Fernandez S., Costa-Fernandez J. M., Encinar J. R., Calvete J. J., Sanz-Medel A. (2016). Elemental mass spectrometry for absolute intact protein quantification without protein-specific standards: application to snake venomics. Anal. Chem. 88, 9699–9706. 10.1021/acs.analchem.6b02585 - DOI - PubMed
    1. Contreras-Martos S., Piai A., Kosol S., Varadi M., Bekesi A., Lebrun P., et al. . (2017). Linking functions: an additional role for an intrinsically disordered linker domain in the transcriptional coactivator CBP. Sci. Rep. 7:4676. 10.1038/s41598-017-04611-x - DOI - PMC - PubMed

LinkOut - more resources