. 2018 Sep 20:7:e40958.
doi: 10.7554/eLife.40958.

UBE2G1 governs the destruction of cereblon neomorphic substrates

Affiliations

UBE2G1 governs the destruction of cereblon neomorphic substrates

Gang Lu et al. Elife. .

Abstract

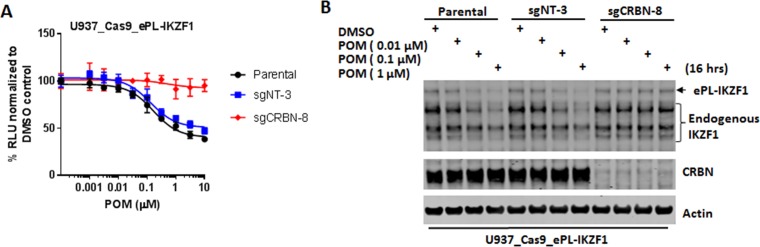
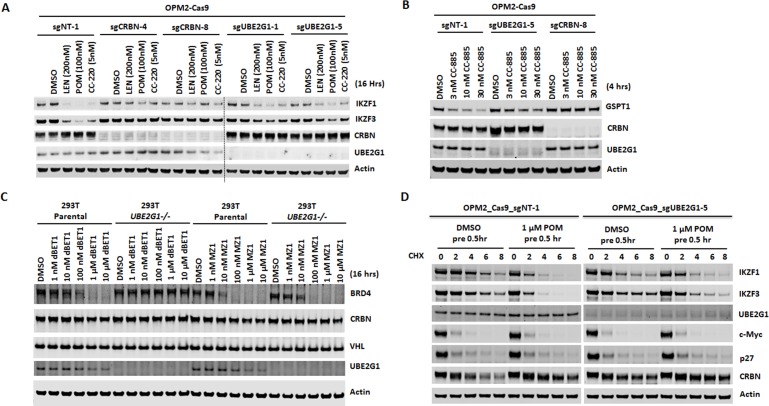
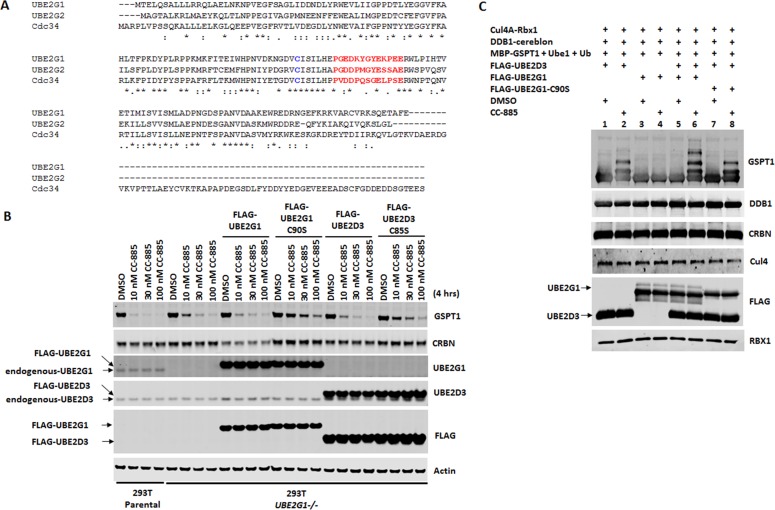
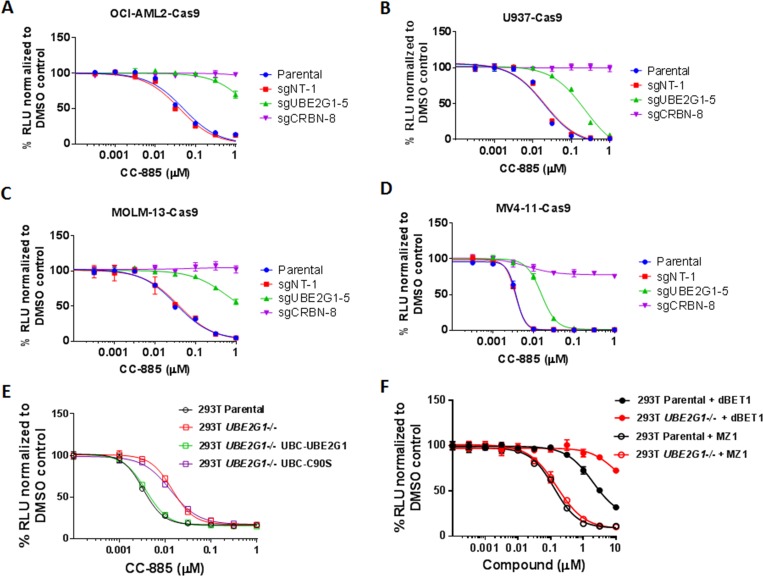
The cereblon modulating agents (CMs) including lenalidomide, pomalidomide and CC-220 repurpose the Cul4-RBX1-DDB1-CRBN (CRL4CRBN) E3 ubiquitin ligase complex to induce the degradation of specific neomorphic substrates via polyubiquitination in conjunction with E2 ubiquitin-conjugating enzymes, which have until now remained elusive. Here we show that the ubiquitin-conjugating enzymes UBE2G1 and UBE2D3 cooperatively promote the K48-linked polyubiquitination of CRL4CRBN neomorphic substrates via a sequential ubiquitination mechanism. Blockade of UBE2G1 diminishes the ubiquitination and degradation of neomorphic substrates, and consequent antitumor activities elicited by all tested CMs. For example, UBE2G1 inactivation significantly attenuated the degradation of myeloma survival factors IKZF1 and IKZF3 induced by lenalidomide and pomalidomide, hence conferring drug resistance. UBE2G1-deficient myeloma cells, however, remained sensitive to a more potent IKZF1/3 degrader CC-220. Collectively, it will be of fundamental interest to explore if loss of UBE2G1 activity is linked to clinical resistance to drugs that hijack the CRL4CRBN to eliminate disease-driving proteins.

Keywords: PROTAC; biochemistry; cancer biology; cereblon; cereblon modulating agents; chemical biology; human; immunomodulatory drugs; ubiquitination.


Conflict of interest statement

GL Employee of Celgene, SW Stephanie Weng: Employee of Celgene, MM Mary Matyskiela: Employee of Celgene, XZ Xinde Zheng: Employee of Celgene, WF Wei Fang: Employee of Celgene, SW Scott Wood: Employee of Celgene, CS Christine Surka: Employee of Celgene, RM Reina Mizukoshi: Employee of Celgene, CL Chin-Chun Lu: Employee of Celgene, DM Derek Mendy: Employee of Celgene, IJ In Sock Jang: Employee of Celgene, KW Kai Wang: Employee of Celgene, MM Mathieu Marella: Employee of Celgene, SC Suzana Couto: Employee of Celgene, BC Brian Cathers: Employee of Celgene, JC James Carmichael: Employee of Celgene, PC Philip Chamberlain: Employee of Celgene, MR Mark Rolfe: Employee of Celgene

Figures

Figure 1.
Figure 1.. Identification of UBE2G1 as the most critical ubiquitin E2 enzyme that mediates the pomalidomide-induced degradation of IKZF1.
(A) Schematic showing the design of the CRISPR screen to identify E2 enzyme(s) regulating the CM-induced degradation of ePL-tagged IKZF1 in 384-well array format. (B) Chemiluminescent measurement of ePL-IKZF1 protein expression level in U937_Cas9_ePL-IKZF1 parental cells or cells expressing non-targeting or UBE2G1-specific sgRNAs. Cells were treated with POM at the indicated concentrations for 16 hr. Data are presented as mean ± SD, n = 4 technical replicates. (C) Immunoblot analysis of U937_Cas9 parental or UBE2G1-/- cells with or without stable expression of UBE2G1 wild-type or C90S mutant. Cells were treated with POM at the indicated concentrations for 16 hr. Result is representative of three independent experiments.
Figure 1—figure supplement 1.
Figure 1—figure supplement 1.. Pomalidomide-induced destruction of IKZF1 requires CRL4CRBN.
(A and B) Chemiluminescent measurement (A) or immunoblot analysis (B) of ePL-IKZF1 protein expression level in U937_Cas9_ePL-IKZF1 parental cells or cells expressing non-targeting or CRBN-specific sgRNA. Cells were treated with DMSO or an increasing concentrations of POM for 16 hr. In (A), data are presented as mean ± SD, n = 4 technical replicates. In (B), note that the degradation efficiency of ePL-tagged and endogenous IKZF1 is comparable. Data are presented as mean ± SD, n = 4 technical replicates. All results shown in this figure are representative of three independent experiments.
Figure 1—figure supplement 2.
Figure 1—figure supplement 2.. The effect of individual knockout of each of the 41 annotated E2 enzymes or inactivation of cullin neddylation with MLN4924 on pomalidomide-induced destruction of IKZF1.
(A–U) Chemiluminescent measurement of ePL-IKZF1 protein expression level in U937_Cas9_ePL-IKZF1 parental cells or cells expressing non-targeting or E2-specific sgRNA. Cells were treated with DMSO or an increasing concentrations of POM for 16 hr. (V) Chemiluminescent measurement of ePL-IKZF1 protein expression level in U937_Cas9_ePL-IKZF1 cells treated with DMSO or an increasing concentrations of POM in the presence or absence or MLN4924 at the indicated concentrations for 16 hr. Data are presented as mean ± SD, n = 4 technical replicates. (W) Cell proliferation of U937_Cas9_ePL-IKZF1 cells treated with DMSO or MLN4924 at the indicated concentrations for 48 hr. Cell proliferation was determined by CTG. Data are presented as mean ± SD, n = 4 technical replicates. Results shown in V and W are representative of three independent experiments.
Figure 2.
Figure 2.. UBE2G1 and UBE2D3 redundantly regulate the pomalidomide-induced degradation of IKZF1.
(A) Schematic showing the design of dual-gRNA directed CRISPR screen of E2s regulating the CM-induced degradation of ePL-tagged IKZF1 in 384-well array format. (B) Chemiluminescent measurement of ePL-IKZF1 protein expression level in U937_Cas9_ePL-IKZF1 parental cells or cells expressing UBE2G1-specfic sgRNA alone or in combination with non-targeting or UBE2D3-specific sgRNA. Cells were treated with POM at the indicated concentrations for 16 hr. Data are presented as mean ± SD, n = 4 technical replicates. (C) Immunoblot analysis of U937-Cas9 parental cells or cells expressing non-targeting sgRNA, UBE2G1-specific sgRNA, UBE2D3-specfic sgRNA, or both UBE2G1 and UBE2D3 sgRNAs. Cells were treated with POM at the indicated concentrations for 16 hr. SE, short exposure; LE, long exposure. Result is representative of three independent experiments.
Figure 2—figure supplement 1.
Figure 2—figure supplement 1.. The effect of double knockout of UBE2G1 and one of the 41 E2 enzymes on pomalidomide-induced destruction of IKZF1.
(A–U) Chemiluminescent measurement of ePL-IKZF1 protein expression level in U937_Cas9_ePL-IKZF1 parental cells or cells expressing both UBE2G1-specific and non-targeting or E2-specific sgRNA. Cells were treated with DMSO or an increasing concentrations of POM for 16 hr. Data are presented as mean ± SD, n = 4 technical replicates.
Figure 3.
Figure 3.. Loss of UBE2G1 blocked the degradation of cereblon neomorphic substrates induced by cereblon-modulating agents.
(A and B) Immunoblot analysis of OPM2-Cas9 cells expressing non-targeting, UBE2G1-specific or CRBN-specific sgRNA. Cells were treated with LEN, POM or CC-220 for 16 hr (A) or CC-885 for 4 hr (B) at the indicated concentrations. (C) Immunoblot analysis of 293T parental or UBE2G1-/- cells treated with BRD4 PROTACs dBET1 or MZ1 at the indicated concentrations for 16 hr. (D) Immunoblot analysis of OPM2 parental or UBE2G1-/- cells treated with 100 µg/ml cycloheximide with or without 1 µM POM pretreatment for half an hour. Cells were harvested at the indicated time points. All results shown in this figure are representative of three independent experiments.
Figure 3—figure supplement 1.
Figure 3—figure supplement 1.. Elimination of UBE2G1 blocks the degradation of cereblon neomorphic substrates recruited by lenalidomide and CC-885.
(A–F) Immunoblot analysis of DF15-Cas9 cells (A and C), MM1S-Cas9 cells (B and D), OCI-AML2-Cas9 cells (E), U937-Cas9 cells (F), MOLM-13-Cas9 cells (G) and MV4-11-Cas9 cells (H) transduced with lentiviral vectors expressing non-targeting, UBE2G1-specific or CRBN-specific sgRNAs. Cells were treated with lenalidomide for 16 hr (A and B), or CC-885 for 4 hr (C–H) at the indicated concentrations. (I) Immunoblot analysis of 293T parental or UBE2G1-/- cells stably expressing UBE2G1 wild-type or C90S mutant. Cells were treated with CC-885 at the indicated concentrations for 4 hr. All results shown in this figure are representative of three independent experiments.
Figure 3—figure supplement 2.
Figure 3—figure supplement 2.. Depletion of UBE2G1 attenuated the degradation of p21 and RMB39 induced by UV irradiation and sulfonamide treatment, respectively.
(A and B) Immunoblot analysis of 293T parental and UBE2G1-/- (clone 13) cells treated with UV irradiation (A) or E7070 (B). In (A), cells were UV irradiated at 50 J/m2 using a Stratalinker, and collected at the indicated time points thereafter. In (B), cells were treated with DMSO or an increasing concentration of E7070 for 16 hr. All results shown in this figure are representative of three independent experiments.
Figure 4.
Figure 4.. UBE2G1 and UBE2D3 sequentially catalyze the in vitro ubiquitination of IKZF1 and GSPT1 in the presence of pomalidomide and CC-885, respectively.
(A– D) In vitro ubiquitination of IKZF1 (A and C) and GSPT1 (B and D) MBP fusion proteins by recombinant CRL4CRBN complex. Recombinant protein products as indicated were incubated with or without 80 µM POM (A and C) or 80 µM CC-885 (B and D) in the ubiquitination assay buffer containing 80 mM ATP at 30°C for 2 hr, and then analyzed by immunoblotting. (E) Sequential in vitro ubiquitination of GSPT1 by recombinant CRL4CRBN complex. MBP-GSPT1 recombination protein was incubated with Ube1, UBE2D3, Cul4-Rbx1, DDB1-cereblon, Ubiquitin, ATP and CC-885 in the ubiquitination assay at 30°C for 4 hr. After purification over size-exclusion chromatography, pre-ubiquitinated MBP-GSPT1 protein was then incubated with Ube1, DDB1-cereblon, Ubiquitin, ATP and UBE2G1 with or without CC-885 or Cul4A-Rbx1 in the ubiquitination assay at 30°C for 2 hr, followed by immunoblot analysis. (F) Schematic showing the sequential ubiquitination of CRBN neomorphic substrates by UBE2D3 and UBE2G1. Results shown in (A–E) are representative of three independent experiments.
Figure 4—figure supplement 1.
Figure 4—figure supplement 1.. UBE2G1 catalyzes the ubiquitin chain assembly on GSPT1 pre-conjugated with ubiquitin.
(A) Sequence alignment of human UBE2G1, human UBE2G2 and human CDC34 using Clustal W 2.1. The acidic loops indispensable for the assembly of K48-linked ubiquitin chains are highlighted with red, and the catalytic cysteines are highlighted with blue. (B) Immunoblot analysis of 293T parental or UBE2G1-/- cells transduced with lentiviral vectors expressing FLAG-tagged UBE2G1 wild-type or C90S mutant, or FLAG-tagged UBE2D3 wild-type or C85S mutant. Cells were treated with CC-885 at the indicated concentrations for 4 hr. Note that overexpression of wild-type FLAG-UBE2G1 or FLAG-UBE2D3 partially rescued the GSPT1 degradation defect caused by UBE2G1 deficiency, while overexpression of catalytically-dead mutant FLAG-UBE2G1-C90S or FLAG-UBE2D3-C85S further blocked the degradation of GSPT1. (C) In vitro ubiquitination of GSPT1 by CRL4CRBN with or without CC-885 and indicated E2 variants. Consistent with results observed with bacterial recombinant UBE2G1 and UBE2D3 proteins, FLAG-UBE2G1 and FLAG-UBE2D3 proteins purified from human cells acted in concert to promote the ubiquitination of GSPT1. Results shown in (B) and (C) are representative of three independent experiments.
Figure 4—figure supplement 2.
Figure 4—figure supplement 2.. UBE2D family proteins redundantly promote the ubiquitination of GSPT1.
(A) Sequence alignment of human UBE2D family proteins using Clustal W 2.1. Note that the amino acid sequence identity among all four family proteins is close to 90%. (B) In vitro ubiquitination of GSPT1 MBP fusion protein by recombinant CRL4CRBN complex in the presence of UBE2G1, UBE2D1, UBE2D2, or UBE2D3, alone or in combination. Recombinant protein products as indicated were incubated with or without 80 µM CC-885 in the ubiquitination assay buffer at 30°C for 2 hr, and then analyzed by immunoblotting. SE, short exposure; LE, long exposure. Result is representative of three independent experiments.
Figure 5.
Figure 5.. UBE2G1 and UBE2D3 cooperatively promote the in vivo ubiquitination of IKZF1.
(A and B) 293T parental and UBE2G1-/-;UBE2D3-/- (clone 4) cells were transiently transfected with plasmids expressing cereblon, V5-tagged IKZF1 and 8xHis-Ub with or without UBE2G1, UBE2D3 or both. (C) 293T parental and UBE2G1-/- (clone 13) cells were transiently transfected with plasmids expressing cereblon, IKZF1-V5, 8xHis-Ub with or without UBE2G1 wild-type or C90S mutant. In (A), (B) and (C), 48 hr after transfection, cells were treated with MG-132 (10 µM) and POM at the indicated concentrations for additional 8 hr. Ubiquitinated protein products enriched with magnetic nickel sepharose were subjected to immunoblot analysis. Immunoblot analysis of whole cell extracts showing equal input proteins is shown in Figure 5—figure supplement 1A-C. All results shown in this figure are representative of three independent experiments.
Figure 5—figure supplement 1.
Figure 5—figure supplement 1.. Input protein levels for the in vivo ubiquitination studies corresponding to Figure 5.
(A) Total input for Figure 5A. Immunoblot analysis of 293T parental and UBE2G1-/-;UBE2D3-/- (Clone 4) cells transfected to produce 8xHis-Ubiquitin, cereblon and IKZF1-V5. (B) Total input for Figure 5B. Immunoblot analysis of 293T parental and UBE2G1-/-;UBE2D3-/- (Clone 4) cells transfected to produce 8xHis-Ubiquitin, CRBN, IKZF1-V5 with or without UBE2G1 and/or UBE2D3. (C) Total input for Figure 5C. Immunoblot analysis of 293T parental and UBE2G1-/- (Clone 13) cells transfected to produce 8xHis-Ubiquitin, CRBN, IKZF1-V5 with or without UBE2G1 wildtype or C90S mutant. In (A), (B) or (C), 48 hr after transfection, cells were treated with 10 µM MG-132 and POM at the indicated concentrations for additional 8 hr. All results shown in this figure are representative of three independent experiments.
Figure 6.
Figure 6.. UBE2G1 loss confers resistance to lenalidomide and pomalidomide in myeloma cell lines.
(A) Effect of LEN (top panel) and POM (bottom panel) on proliferation of myeloma cell lines. Cell proliferation was determined by CTG. Data are presented as mean ± SD, n = 3 technical replicates. (B) Immunoblot analysis of myeloma cell lines used in (A). (C and D) Proliferation (C) and immunoblot analysis (D) of SKMM2 cells transduced with lentiviral vectors encoding GFP, UBE2G1 and UBE2G1-C90S. Cells were treated with DMSO vehicle control, LEN or POM at the indicated concentrations for 5 days (C) or 16 hr (D). In (C), cell proliferation was determined by CTG, and data are presented as mean ± SD, n = 3 technical replicates. All results shown in this figure are representative of three independent experiments.
Figure 6—figure supplement 1.
Figure 6—figure supplement 1.. The growth-inhibitory effect of CC-885 and BRD4 PROTACs in AML cell lines and 293 T cells.
(A–D) Cell proliferation of AML cell lines OCI-AML2 (A), U937 (B), MOLM-13 (C) and MV4-11 (D) treated with DMSO or CC-885 at the indicated concentrations for 72 hr. Cell proliferation was determined by CTG. Data are presented as mean ± SD, n = 4 technical replicates. (E and F) Cell proliferation of 293T parental and UBE2G1-/- (clone 13) cells with or without ectopic overexpression of UBE2G1 wild-type or C90S mutant. Cells were treated with CC-885 (E), dBET1 (F) or MZ-1 (F). Cell proliferation was determined by CTG. Data are presented as mean ± SD, n = 4 technical replicates. All results shown in this figure are representative of three independent experiments.
Figure 7.
Figure 7.. UBE2G1-deficient OPM2 myeloma cells are resistant to lenalidomide and pomalidomide but remain sensitive to CC-220 at clinical relevant concentrations.
(A and B) Cell proliferation (A) and immunoblot analysis (B) of OPM2-Cas9 cells transduced with lentiviral vectors expressing non-targeting, UBE2G1-specific or CRBN-specific sgRNAs. Cells were treated DMSO vehicle control, LEN, POM or CC-220 at the indicated concentrations for 5 days (A) or 16 hr (B). In (A), cell proliferation was determined by CTG, and data are presented as mean ± SD, n = 3 technical replicates. All results shown in this figure are representative of three independent experiments.
Figure 7—figure supplement 1.
Figure 7—figure supplement 1.. UBE2G1 knockout diminished the responses to lenalidomide, pomalidomide and CC-220 in myeloma cell lines DF15 and MM1S.
(A–D) Cell proliferation (A and C) and immunoblot analysis (B and D) of MM1S-Cas9 (A and B) and DF15-Cas9 (C and D) cells infected with lentiviral vectors expressing non-targeting, UBE2G1-specific or CRBN-specific sgRNAs. Cells were treated DMSO vehicle control, LEN, POM or CC-220 at the indicated concentrations for 5 days (A and C) or 16 hr (B and D). In (A) and (C), cell proliferation was determined by CTG, and data are presented as mean ± SD, n = 3 technical replicates. All results shown in this figure are representative of three independent experiments.

References

    1. Blondel M, Galan JM, Chi Y, Lafourcade C, Longaretti C, Deshaies RJ, Peter M. Nuclear-specific degradation of Far1 is controlled by the localization of the F-box protein Cdc4. The EMBO Journal. 2000;19:6085–6097. doi: 10.1093/emboj/19.22.6085. - DOI - PMC - PubMed
    1. Bondeson DP, Crews CM. Targeted protein degradation by small molecules. Annual Review of Pharmacology and Toxicology. 2017;57:107–123. doi: 10.1146/annurev-pharmtox-010715-103507. - DOI - PMC - PubMed
    1. Chamberlain PP, Lopez-Girona A, Miller K, Carmel G, Pagarigan B, Chie-Leon B, Rychak E, Corral LG, Ren YJ, Wang M, Riley M, Delker SL, Ito T, Ando H, Mori T, Hirano Y, Handa H, Hakoshima T, Daniel TO, Cathers BE. Structure of the human Cereblon-DDB1-lenalidomide complex reveals basis for responsiveness to thalidomide analogs. Nature Structural & Molecular Biology. 2014;21:803–809. doi: 10.1038/nsmb.2874. - DOI - PubMed
    1. Choi YS, Lee YJ, Lee SY, Shi L, Ha JH, Cheong HK, Cheong C, Cohen RE, Ryu KS. Differential ubiquitin binding by the acidic loops of Ube2g1 and Ube2r1 enzymes distinguishes their Lys-48-ubiquitylation activities. Journal of Biological Chemistry. 2015;290:2251–2263. doi: 10.1074/jbc.M114.624809. - DOI - PMC - PubMed
    1. Deshaies RJ. Protein degradation: Prime time for PROTACs. Nature chemical biology. 2015;11:634–635. doi: 10.1038/nchembio.1887. - DOI - PubMed

MeSH terms

LinkOut - more resources