. 2019 May;66(5):1231-1241.
doi: 10.1109/TBME.2018.2871415. Epub 2018 Sep 19.

Epilepsy-on-a-Chip System for Antiepileptic Drug Discovery

Epilepsy-on-a-Chip System for Antiepileptic Drug Discovery

Jing Liu et al. IEEE Trans Biomed Eng. 2019 May.

Abstract

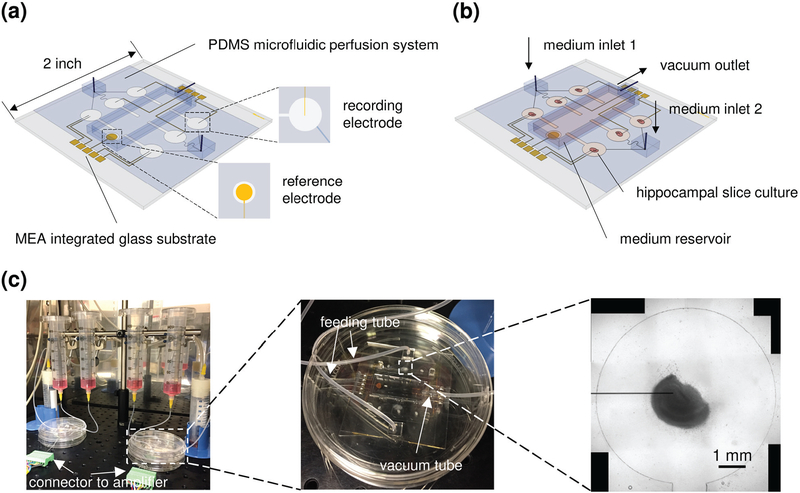
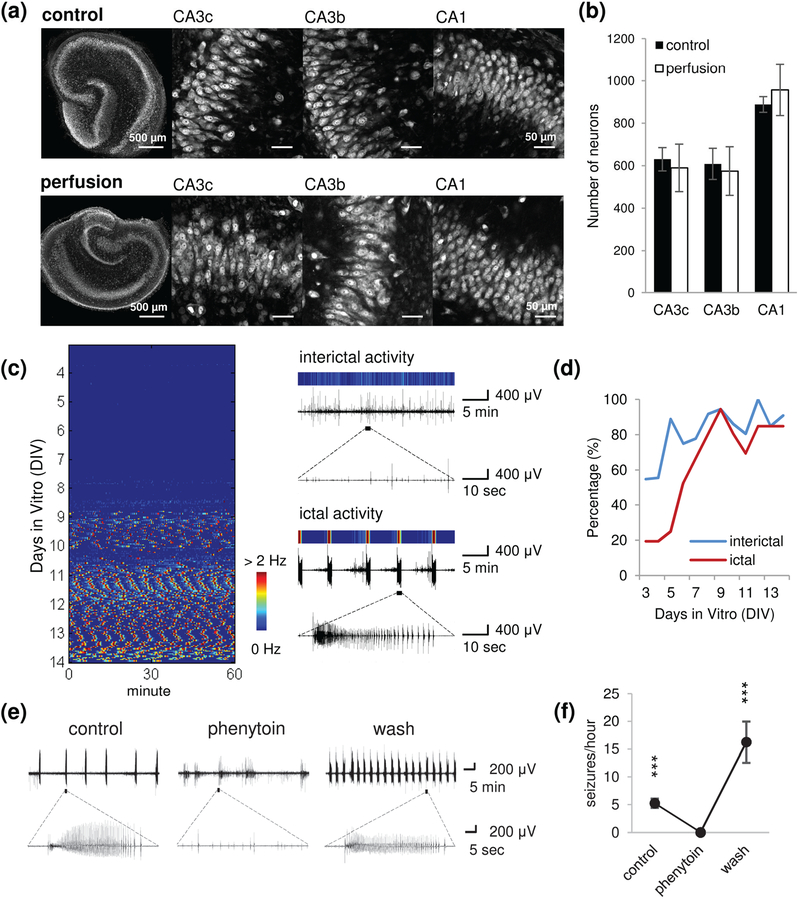
Objective: Hippocampal slice cultures spontaneously develop chronic epilepsy several days after slicing and are used as an in vitro model of post-traumatic epilepsy. Here, we describe a hybrid microfluidic-microelectrode array (μflow-MEA) technology that incorporates a microfluidic perfusion network and electrodes into a miniaturized device for hippocampal slice culture based antiepileptic drug discovery.

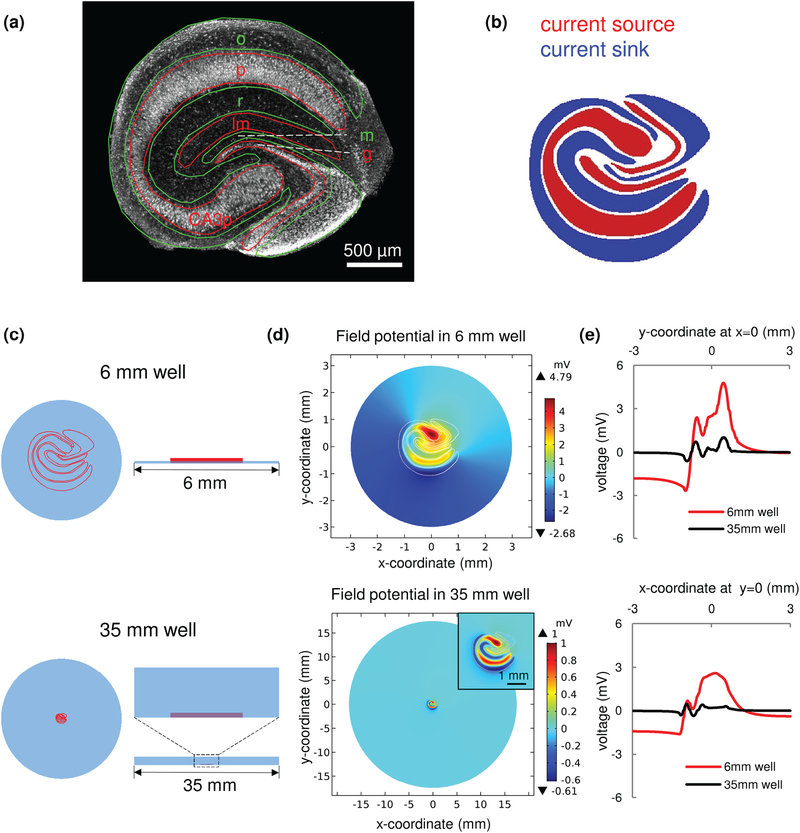
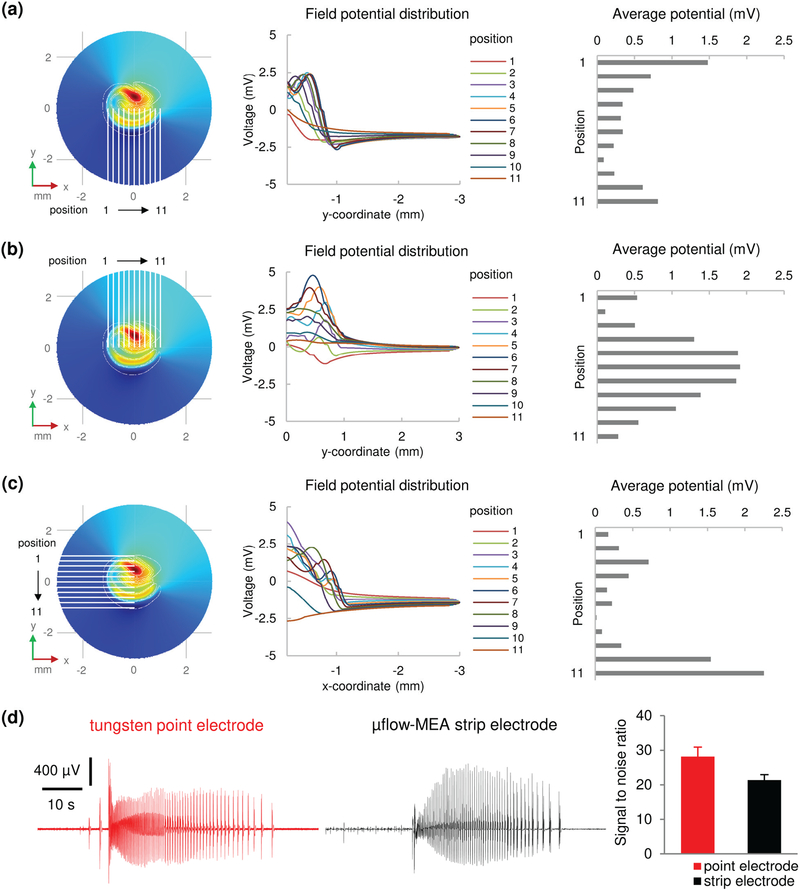
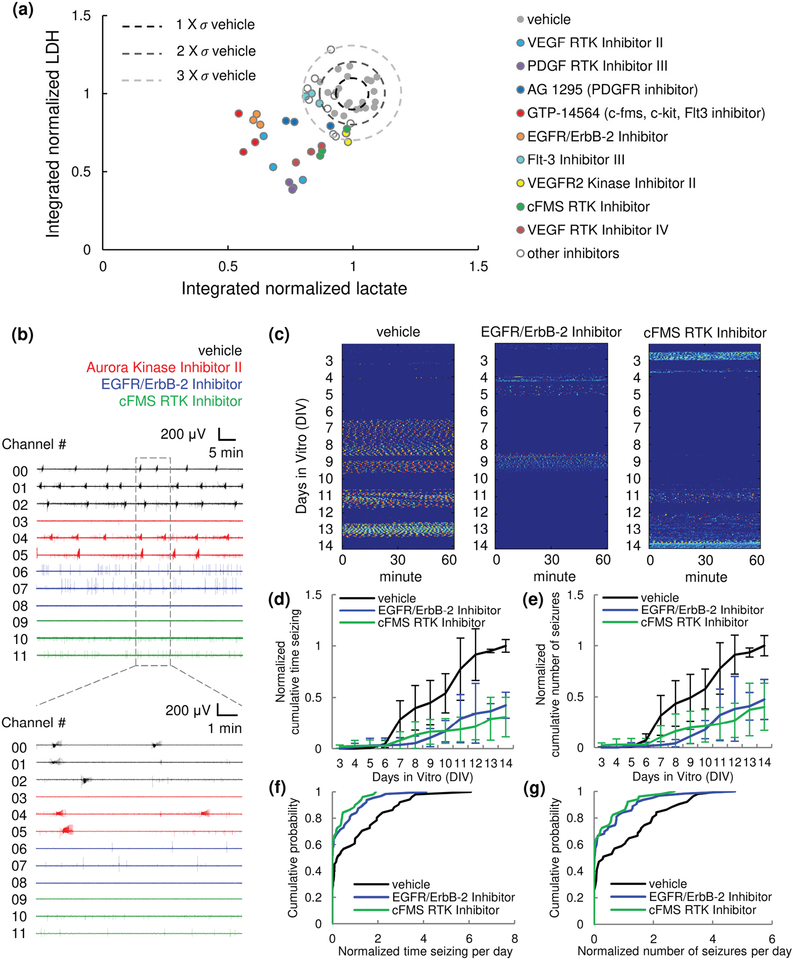
Methods: Field potential simulation was conducted to help optimize the electrode design to detect a seizure-like population activity. Epilepsy-on-a-chip model was validated by chronic electrical recording, neuronal survival quantification, and anticonvulsant test. To demonstrate the application of μflow-MEA in drug discovery, we utilized a two-stage screening platform to identify potential targets for antiepileptic drugs. In Stage I, lactate and lactate dehydrogenase biomarker assays were performed to identify potential drug candidates. In Stage II, candidate compounds were retested with μflow-MEA-based chronic electrical assay to provide electrophysiological confirmation of biomarker results.

Results and conclusion: We screened 12 receptor tyrosine kinases inhibitors, and EGFR/ErbB-2 and cFMS inhibitors were identified as novel antiepileptic compounds.

Significance: This epilepsy-on-a-chip system provides the means for rapid dissection of complex signaling pathways in epileptogenesis, paving the way for high-throughput antiepileptic drug discovery.


Figures

Fig. 1.
Fig. 1.
Integrated μflow-MEA system for chronic recording in multiple hippocampal slice cultures. (a) Schematic representation of the μflow-MEA chip. (b) Schematic of a device in operation, with hippocampal slices loaded and perfused by medium through microchannels, and the waste medium in the reservoir was removed via the vacuum outlet. (c) Fully assembled system prototype, with a photo of the device, and a brightfield image of a hippocampal culture maintained in the mini well with one substrate-integrated strip electrode. Scale bar, 1 mm.
Fig. 2.
Fig. 2.
Simulation of the field potential generated by seizure-like activity. (a) Hippocampal slice anatomy. Red and green lines represent opposite polarity of current flow in each neural layer during synchronized synaptic transmission (when dendrite layers are receiving excitatory synaptic inputs: green, sink; red, source). Micrograph image is an organotypic hippocampal culture stained with antibody to NeuN – protein predominantly expressed in neuronal nuclei. (b) Current source pattern during seizure-like activity with whole hippocampal circuit synchronized (blue, sink; red, source). (c) Slice culture maintained in an interface mini well (top; diameter = 6 mm, fluid depth = 100 μm – same dimensions as in μflow-MEA device), and in a standard submerged dish (bottom; diameter = 35 mm, fluid depth = 2 mm). (d) Simulated field potential in mini well (top; white lines show the outline of neural layers), and standard well (bottom). The insert shows hippocampal slice at higher magnification. Scale bar, 1 mm. (e) Field potential distribution along the x=0 (top) and y=0 (bottom) axis (red, mini well; black, standard well). The simulation results refer to the horizontal plane at the well floor. o, stratum oriens; p, pyramidal layer; r, stratum radiatum; lm, stratum lacunosum-moleculare; m, dentate molecular layer; g, granule cell layer; CA3p, pyramidal layer of CA3c subregion.
Fig. 3.
Fig. 3.
Field potentials due to seizure-like activity detected by large area strip electrodes. (a-c) Simulation results. (a) Left, electrodes recording from CA1 area (position 1 to 11 refers to x = −1 mm to x = 1 mm, with 0.2 mm interval). Middle, field potential distribution along each electrode. Right, average potential that is detected by each electrode. (b) Results of electrodes recording from CA3 and DG area. (c) Results of electrodes recording from CA3 and CA1 area (position 1 to 11 refers to y = 1 mm to y = −1 mm, with 0.2 mm interval). (d) Experimental recordings. Left: representative seizure-like events recorded by tungsten microelectrode (point electrode) and strip electrode. Scale bars as indicated in figure. Right: signal to noise ratio of point electrodes and strip electrodes. n = 6 electrodes for each type. Error bars indicate standard deviation (SD).
Fig. 4.
Fig. 4.
Epilepsy-on-a-chip model validation. (a) Representative confocal imaging of NeuN staining in control cultures (interface method) and perfused cultures (μflow-MEA) on 14 day in vitro (DIV), and high magnification images of CA3c, CA3b and CA1 regions. Scale bars as indicated in figure. (b) Neuron counts in CA3c, CA3b, and CA1. n = 9 each condition. (c) Left: representative raster plot of chronic recording from 4 to 14 DIV. Color corresponds to the frequency of paroxysmal events, with low frequency indicated by blue, and high frequency (seizures) indicated by red. Each horizontal line of the raster plot represents one hour of recording, with 24 lines per DIV. Right: the color map of interictal activity (top trace) and ictal activity (seizure, bottom trace). (d) Incidence of ictal and interictal activity as a percentage of cultures recorded on μflow-MEA, with age of culture. n = 36 cultures, from 10 animals. (e) Representative recordings for each time period (control, phenytoin treatment, wash). (f) Seizure frequency during each period. n = 3. Error bars indicate SD. Statistical significance is indicated as ***, representing p < 0.001.
Fig. 5.
Fig. 5.
Chronic screen of receptor tyrosine kinase (RTK) inhibitors. (a) Stage I screen by biomarker (lactate and LDH) assay. Integrated lactate production (DIV3–14) versus integrated LDH production (DIV3–14) is plotted for 12 RTK inhibitors. Data represents values from individual cultures and was normalized to controls from the same animal. = standard deviation of integrated lactate (horizontal axis) and LDH (vertical axis) of controls. Drugs that showed strong reducing effect are highlighted. (b-g) Stage II screen by chronic electrical assay. (b) Representative 1 hour recording, showing parallel monitoring of epileptogenesis in 12 organotypic hippocampal cultures (black, vehicle; red, Aurora inhibitor II; blue, EGFR/ErbB-2 inhibitor;ߪ green, cFMS inhibitor). n = 3 cultures each condition, cultures are from the same animal. (c) Representative raster plots of chronic recordings of vehicle-treated control, EGFR/ErbB-2 inhibitor-treated, and cFMS inhibitor-treated cultures. (d, e) Normalized cumulative time seizing and normalized cumulative number of seizures. Data was normalized to the total time seizing and total number of seizure of vehicle-treated controls from the same animal. For EGFR/ErbB-2 inhibitor, n = 6, from 2 animals. For cFMS inhibitor, n = 5, from 2 animals. Error bars indicate SD. (f, g) Cumulative distribution of normalized time seizing per day and normalized number of seizures per day. Data was normalized to the average time seizing per day and average number of seizure per day of vehicle-treated controls from the same animal.

References

    1. Pitkänen A et al., “Epileptogenesis,” Cold Spring Harb. Perspect. Med, vol. 5, no. 10, p. a022822, Oct. 2015. - PMC - PubMed
    1. Dyhrfjeld-Johnsen J et al., “Interictal spikes precede ictal discharges in an organotypic hippocampal slice culture model of epileptogenesis,” J. Clin. Neurophysiol, vol. 27, no. 6, pp. 418–424, 2010. - PMC - PubMed
    1. Berdichevsky Y et al., “Interictal spikes, seizures and ictal cell death are not necessary for post-traumatic epileptogenesis in vitro,” Neurobiol. Dis, vol. 45, no. 2, pp. 774–785, 2012. - PMC - PubMed
    1. Liu J et al., “Epileptogenesis in organotypic hippocampal cultures has limited dependence on culture medium composition,” PLOS ONE, vol. 12, no. 2, p. e0172677, Feb. 2017. - PMC - PubMed
    1. Lillis KP et al., “Evolution of network synchronization during early epileptogenesis parallels synaptic circuit alterations,” J. Neurosci, vol. 35, no. 27, pp. 9920–9934, 2015. - PMC - PubMed

Publication types

MeSH terms

Substances