. 2018 Sep 20;13(9):e0198384.
doi: 10.1371/journal.pone.0198384. eCollection 2018.

Pseudomonas aeruginosa displays a dormancy phenotype during long-term survival in water

Affiliations

Pseudomonas aeruginosa displays a dormancy phenotype during long-term survival in water

Shawn Lewenza et al. PLoS One. .

Abstract

Pseudomonas aeruginosa is capable of long-term survival in water, which may serve as a reservoir for infection. Although viable cell counts of PAO1 incubated in water remain stable throughout 8 weeks, LIVE/DEAD staining indicated a high proportion of cells stained with propidium iodide (PI). The proportion of PI-stained cells increased by 4 weeks, then decreased again by 8 weeks, suggesting an adaptive response. This was also evident in an observed shift in cell morphology from a rod to a coccoid shape after 8 weeks. Fluorescence-activated cell sorting (FACS) was used to recover PI-stained cells, which were plated and shown to be viable, indicating that PI-stained cells were membrane-compromised but still cultivable. PAO1 mid-log cells in water were labeled with the dsDNA-binding dye PicoGreen to monitor viability as well as DNA integrity, which demonstrated that the population remains viable and transitions towards increased dsDNA staining. Metabolic activity was found to decrease significantly in water by 4 weeks. The PAO1 outer membrane became less permeable and more resistant to polymyxin B damage in water, and the profile of total membrane lipids changed over time. Among the ~1400 transcriptional lux fusions, gene expression in water revealed that the majority of genes were repressed, but subsets of genes were induced at particular time points. In summary, these results indicate that P. aeruginosa is dormant in water and this adaptation involves a complex pattern of gene regulation and changes to the cell to promote long-term survival and antibiotic tolerance. The approach of P. aeruginosa incubated in water may be useful to study antibiotic tolerance and the mechanisms of dormancy and survival in nutrient limiting conditions.


Conflict of interest statement

The authors have declared that no competing interests exist.

Figures

Fig 1
Fig 1. Survival of P. aeruginosa PAO1 incubated in water.
Overnight cultures of PAO1 and mutants were washed thoroughly and inoculated into sterile water at a concentration of 107 CFU/ml and incubated at room temperature without shaking. At each time point, aliquots were removed and plated on LB for direct bacterial counts. Each color represents one of four trials and each value is the average of at least triplicate samples.
Fig 2
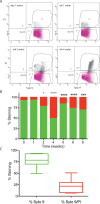
Fig 2. Scatter plots and bar graph representation of the populations of SYTO 9 and propidium iodide stained P. aeruginosa PAO1 in water.
Strains were inoculated into sterile water at a concentration of 107 CFU/ml and incubated at room temperature. A) Live and dead cell populations were subjected to LIVE/DEAD staining every week and quantitated by flow cytometry. The quadrant labelled S9 refers to the cells that were stained with SYTO 9 only, which are generally considered to be viable. The quadrant labelled S9PI refers to the cells that stained both with SYTO 9 and PI, which are possibly dead or membrane-compromised, dormant cells. The time points are from day 1, week 1, week 2 and week 4 in water. Each panel represents a population of 50,000 cells per experiment. B) The percentage of SYTO 9 (green bars) and SYTO 9/PI (red bars) stained cells is depicted over an 8-week time course. The values shown are the average S9 and S9PI counts recovered from triplicate flow cytometry samples. Significant differences were determined using one-way ANOVA with Bonferroni post-tests when compared to the zero time point (* P<0.05, ****P<0.0001) or to the 4 weeks time point (*** P<0.001, ****P<0.0001). C) The box and whiskers plot demonstrates the overall proportion of SYTO 9 (green) only staining, compared to SYTO 9 and PI (red) staining populations of cells in water for the 8-week time course.
Fig 3
Fig 3. Pico Green staining and flow cytometry analysis of P. aeruginosa PAO1 in water.
Log phase cultures of PAO1 were inoculated into water for incubation. Each sample was stained with Quant-iT PicoGreen and subjected to flow cytometry to analyze the dsDNA content in cells during long-term incubation in water. Cells from mid-log PAO1 cultures were compared to cells in water at day 0, 3 weeks and 4 weeks. Each panel represents a population of 50,000 cells per experiment. This figure shows a representation of one of the three trials performed and demonstrates the increased fluorescence and DNA staining observed over time in water.
Fig 4
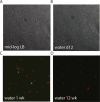
Fig 4. Phase-contrast and fluorescence microscopy of P. aeruginosa PAO1 in water.
A) Mid-log cells of P. aeruginosa under phase contrast. B) P. aeruginosa incubated in water for 12 days under phase contrast. C) LIVE/DEAD staining results of P. aeruginosa PAO1 following incubation in water for 1, and D) 12 weeks. Cells were grown to mid-log in LB, washed, and added to sdH2O at a concentration of 107 CFU/ml and incubated at room temperature. Cells were added to agarose beds on glass slides and visualized on a Leica microscope.
Fig 5
Fig 5. Outer membrane permeability and polymyxin B tolerance of P. aeruginosa PAO1 incubated in water.
The baseline of outer membrane permeability was measured as a function of 1-N-phenylnaphthylamine (NPN) uptake and subsequent fluorescence in relative light units (RLU). Log phase cultures of PAO1 were prepared and inoculated into water for incubation. After 1, 7, 21, and 28 days incubation, cells were treated with sodium azide, an active efflux inhibitor. After NPN addition, polymyxin B (time = 0) was added to disrupt the outer membrane and increase NPN uptake into the hydrophobic environment of the envelope. The tolerance to polymyxin B treatment was compared between mid-log LB cultures and cells incubated in water for up to 4 weeks. Values shown are the average and standard error of triplicate samples. Significant differences for the final time points were determined using one-way ANOVA with Bonferroni post-tests when compared to the LB control (* P<0.05, *** P<0/001, ****P<0.0001).
Fig 6
Fig 6. Cluster analysis of gene expression of P. aeruginosa genes in response to water.
The PAO1 mini-Tn5-luxCDABE mutant library containing 1369 transcriptional lux fusion strains was inoculated into water in black 96 well microplates and incubated at room temperature. At each time point the optical density (OD600) and luminescence (counts per second) was measured. Gene expression (CPS) readings were taken at day 0, 0.3, 1, 3, 5, 7, 13, 20, 26, and 34. Luminescence was divided by absorbance and fold changes were calculated based on the change in expression (CPS/OD600) compared to time 0. Cluster analysis was performed using Tree View and Cluster 3.0 software. Orange indicates repression, and blue indicates induced expression, relative to the time zero point. Genes with no change in expression are in white. Black bars highlight clusters of genes that are induced late (A, D), throughout (B) or early (C) in the 34 day time period of incubation in water.
Fig 7
Fig 7. Ninhydrin detection of amino group containing lipids of PAO1 cells following incubation in water.
Total lipids were extracted, separated by thin layer chromatography, and sprayed with ninhydrin to visualize the amino group-containing lipids. Lipid samples of water cultures at day 0, day 7 and day 14 were run on TLC plate, alongside controls of lipids extracted from cultures grown in BM2-defined media with limiting (400 μM) and high phosphate (1.6 mM) conditions. The positions of the primary membrane lipid phosphatidylethanolamine (PE) and the unique ornithine lipid (OL) species that is produced under phosphate limitation [15] are indicated.

References

    1. Jorgensen F, Bally M, Chapon-Herve V, Michel G, Lazdunski A, Williams P, et al. RpoS-dependant stress tolerance in Pseudomonas aeruginosa. Microbiol. 1999;145;835–844. 10.1099/13500872-145-4-835 - DOI - PubMed
    1. Wolfgang MC, Kulasekara BR, Liang X, Boyd D, Wu K, Yang Q, et al. Conservation of genome content and virulence determinants among clinical and environmental isolates of Pseudomonas aeruginosa. PNAS. 2003;100(14);8484–8489. 10.1073/pnas.0832438100 - DOI - PMC - PubMed
    1. Driscoll JA, Brody SL, Kollef MH. The epidemiology, pathogenesis and treatment of Pseudomonas aeruginosa infections. Drugs. 2007;67(3);351–368. - PubMed
    1. Kramer A, Schwebke I, Kampf G. How long do nosocomial pathogens persist on inanimate surfaces? A systematic review. BMC Infectious Dis. 2006;6;130 10.1186/1471-2334-6-130 - DOI - PMC - PubMed
    1. Moore RA, Tuanyok A, Woods DE. Survival of Burkholderia pseudomallei in water. BMC Res Notes. 2008;1;11 10.1186/1756-0500-1-11 - DOI - PMC - PubMed

Publication types

MeSH terms