. 2018 Sep 19;9(9):462.
doi: 10.3390/genes9090462.

The GIS2 Gene Is Repressed by a Zinc-Regulated Bicistronic RNA in Saccharomyces cerevisiae

Affiliations

The GIS2 Gene Is Repressed by a Zinc-Regulated Bicistronic RNA in Saccharomyces cerevisiae

Janet Taggart et al. Genes (Basel). .

Abstract

Zinc homeostasis is essential for all organisms. The Zap1 transcriptional activator regulates these processes in the yeast Saccharomyces cerevisiae. During zinc deficiency, Zap1 increases expression of zinc transporters and proteins involved in adapting to the stress of zinc deficiency. Transcriptional activation by Zap1 can also repress expression of some genes, e.g., RTC4. In zinc-replete cells, RTC4 mRNA is produced with a short transcript leader that is efficiently translated. During deficiency, Zap1-dependent expression of an RNA with a longer transcript leader represses the RTC4 promoter. This long leader transcript (LLT) is not translated due to the presence of small open reading frames upstream of the RTC4 coding region. In this study, we show that the RTC4 LLT RNA also plays a second function, i.e., repression of the adjacent GIS2 gene. In generating the LLT transcript, RNA polymerase II transcribes RTC4 through the GIS2 promoter. Production of the LLT RNA correlates with the decreased expression of GIS2 mRNA and mutations that prevent synthesis of the LLT RNA or terminate it before the GIS2 promoter renders GIS2 mRNA expression and Gis2 protein accumulation constitutive. Thus, we have discovered an unusual regulatory mechanism that uses a bicistronic RNA to control two genes simultaneously.

Keywords: RNA; bicistronic; gene expression; homeostasis; regulation; transcription; zinc.


Conflict of interest statement

The authors declare no conflict of interest.

Figures
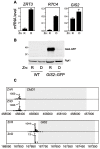
Figure 1
Figure 1
Effect of zinc status on GIS2 mRNA and protein levels. (A) real time polymerase chain reaction (RT-PCR) analysis of wild-type cells (BY4741) grown in either zinc-replete (R, low zinc medium (LZM) + 100 µM ZnCl2) or deficient (D, LZM + 1 µM ZnCl2) media. The data are the means of three biological replicates and the error bars indicate ± 1 SD. All changes in response to zinc status were found to be statistically significant with p-values of 0.004, 0.007, and 0.035 for ZRT3, RTC4, and GIS2, respectively. (B) Immunoblot analysis of wild-type (BY4741) and BY4741 GIS2::green flourecent protein (GFP) cells grown under the same conditions. Anti-GFP and anti-Pgk1 antibodies were used for protein detection. The location of size markers is indicated on the left side in kDa. (C) Transcription start sites mapped by Deep-RACE for CMD1 and GIS2 under zinc-replete (ZnR) and zinc-deficient (ZnD) growth conditions are shown relative to each gene’s protein-coding region (shaded in gray). Independent sequencing reads representing mRNA 5′ ends are plotted across each region. The x-axis coordinates represent the position on the corresponding chromosomes. Peak values of the number of sequence reads for each gene and growth condition are shown. The transcription start site mapping data are from Wu et al. [25].
Figure 2
Figure 2
Model of RTC4 and GIS2 co-regulation by a bicistronic regulatory RNA. Arrows indicate RNAs produced and the boxes denote open reading frames (ORFs). Several small ORFs located in the region between the RTC4 and GIS2 protein-coding regions are not shown. ZnR and ZnD denote zinc-replete and zinc-deficient growth conditions, respectively. SLT1/2 and LLT refer to short leader transcripts and long leader transcripts, respectively. The box labeled ZRE indicates the location of a zinc-responsive element.
Figure 3
Figure 3
Correlation Rtc4 and Gis2 protein expression in response to zinc status. Wild-type (BY4741) cells transformed with plasmid pRHGM were grown in LZM with the indicated zinc level for 16 h prior to immunoblot analysis. pRHGM expresses HA-tagged Rtc4 and myc-tagged Gis2. Pgk1 was used as a loading control and the asterisk marks a non-specific band. The location of size markers is indicated on the left side of the panel in kDa. The histograms show quantified results from three replicates compared to 100 µM zinc cultures as the replete (ZnR) condition. Error bars are ± 1 SD.
Figure 4
Figure 4
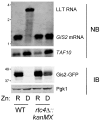
The rtc4::kanMX allele disrupts regulation of the adjacent GIS2 gene. Wild-type (BY4741) and isogenic rtc4::kanMX mutant cells bearing a GIS2::GFP allele were grown in zinc-replete (R, LZM + 100 µM ZnCl2) or deficient (D, LZM + 1 µM ZnCl2) media prior to immunoblot (IB) and Northern blot (NB) analysis. Pgk1 was used as a loading control for immunoblotting and TAF10 mRNA was used as the control for Northern blotting. The location of size markers is indicated on the left side of each panel in kb (top panel) or kDa (bottom panel).
Figure 5
Figure 5
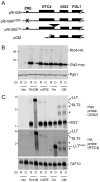
Mutagenesis analysis of RTC4 and GIS2 co-regulation. Wild-type (BY4741) cells were transformed with plasmids pRHGM, pRHGMmZRE, pRHGMTer, or pGM were grown in grown in zinc-replete (R, LZM + 100 µM ZnCl2) or deficient (D, LZM + 1 µM ZnCl2) media prior to analysis. (A) Diagram of the plasmids used in this experiment. (B) Immunoblot analysis of Rtc4-HA, Gis2-myc, and Pgk1. (C) Northern blot analysis of RNA expression using HA tag and myc tag-specific probes. TAF10 was used as a loading control. The locations of the GIS2 and RTC4 SLT2 mRNAs are marked as well as the LLT RNA and truncated LLT RNA produced in the pRHGMTer transformant. RTC4 SLT1 was not detectable in this experiment because of its low abundance. The asterisks mark two transcripts that arise from transcription initiation in the plasmid vector for pGM. The location of size markers is indicated on the left side of each panel in kDa (panel B) or kb (panel C).
Figure 6
Figure 6
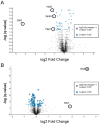
Proteomics analysis of cells with altered GIS2 expression. Mass spectrometry was used to analyze protein abundance in, (A) gis2∆ vs. wild-type zinc-replete cells (LZM + 100 µM ZnCl2) and (B) wild-type cells transformed with either the vector (pRS315) or pRGmZRE grown under zinc-deficient conditions (LZM + 6 µM ZnCl2). The volcano plots show the data plotted as −log (q-value) vs. log2 fold change. Data are based on four biological replicates for each strain/growth condition. Statistically significant effects were defined as those proteins with 2-fold (log2 = 1) or greater changes and a q-value of < 0.05 after Benjamini-Hochberg correction. The full data from this analysis are provided in Table S1.

References

    1. Johnston M., Davis R.W. Sequences that regulate the divergent GAL1-GAL10 promoter in Saccharomyces cerevisiae. Mol. Cell. Biol. 1984;4:1440–1448. doi: 10.1128/MCB.4.8.1440. - DOI - PMC - PubMed
    1. Xu Z., Wei W., Gagneur J., Perocchi F., Clauder-Munster S., Camblong J., Guffanti E., Stutz F., Huber W., Steinmetz L.M. Bidirectional promoters generate pervasive transcription in yeast. Nature. 2009;457:1033–1037. doi: 10.1038/nature07728. - DOI - PMC - PubMed
    1. Arnone J.T., Robbins-Pianka A., Arace J.R., Kass-Gergi S., McAlear M.A. The adjacent positioning of co-regulated gene pairs is widely conserved across eukaryotes. BMC Genom. 2012;13 doi: 10.1186/1471-2164-13-546. - DOI - PMC - PubMed
    1. Karginov T.A., Pastor D.P.H., Semler B.L., Gomez C.M. Mammalian polycistronic mRNAs and disease. Trends Genet. 2017;33:129–142. doi: 10.1016/j.tig.2016.11.007. - DOI - PMC - PubMed
    1. Merchant S.S., Helmann J.D. Elemental economy: Microbial strategies for optimizing growth in the face of nutrient limitation. Adv. Microb. Phys. 2012;60:91–210. - PMC - PubMed

LinkOut - more resources