

A randomized comparison of three data collection models for the measurement of parent experiences with diabetes outpatient care
- PMID: 30236067
- PMCID: PMC6149010
- DOI: 10.1186/s12874-018-0557-z
A randomized comparison of three data collection models for the measurement of parent experiences with diabetes outpatient care
Abstract
Background: The objective of this study was to compare three data collection methods for the measurement of parent experiences with hospital outpatient care for child and adolescent diabetes, based on a randomised national trial in Norway involving both pen-and-paper and electronic response options.
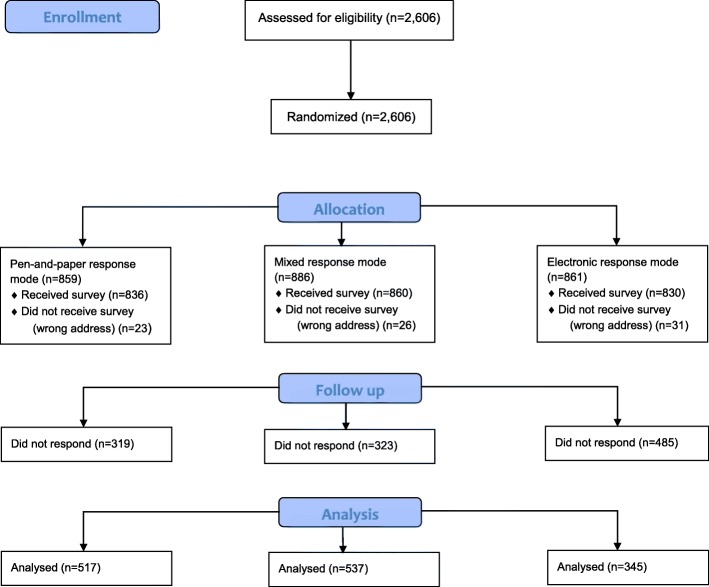
Methods: The sample frame was patients registered in the Norwegian Childhood Diabetes Registry. Parents of patients were randomised into the following groups (n = 2606): group A, who were posted questionnaires with only a pen-and-paper response option (n = 859); group B, who were posted questionnaires with both an electronic and a pen-and-paper response option (n = 886); and group C, who were posted questionnaires with only an electronic response option (n = 861). The three groups were compared on response rate, background variables about respondents, main study results and survey costs. Statistical analysis included logistic regression to test group differences in response probabilities and multilevel linear regression to test differences in parent experiences.
Results: The response rate was 61.8% for group A, 62.4% for group B and 41.6% for group C. The probability of answering was significantly higher for group A (OR = 2.3, p < 0.001) and B (OR = 2.3, p < 0.001) compared to group C. Respondent age, gender, education, living with the child and the degree of participation in consultations did not differ significantly between the three groups. Group differences in parent-reported experiences were small, varying from 1.0 (equipment and doctor contact) to 2.4 (outcome), on a scale from 0 to 100. Only one of 18 group differences was significant: the mixed group had significantly higher score than the electronic group on the organization scale (p < 0.05). The total cost of the electronic model was less than half the cost of the other models, and cost per response was 5.1 euros for the electronic model compared to 8.2 euros for group A and 7.6 euros for group B.
Conclusions: The models with pen-and paper questionnaire included had more than 20% higher response rate than the model with an electronic-only response option. Background variables and parent-reported experiences were similar between the three groups, and the electronic model was the more cost-effective model.
Conflict of interest statement
Ethics approval and consent to participate
The Norwegian Childhood Diabetes Registry has a concession from the Norwegian Data Protection Authority. Furthermore, the register is based on a signed patient / parent consent, including consent to receive questionnaires on patient experiences. The study was approved by the Data Protection Authority at Oslo University Hospital. Return of the questionnaire represented patient consent in the study, which is the standard procedure in all patient experience surveys conducted by the Norwegian Institute of Public Health.
Consent for publication
Not applicable.
Competing interests
The authors declare that they have no competing interests.
Publisher’s Note
Springer Nature remains neutral with regard to jurisdictional claims in published maps and institutional affiliations.
References
Publication types
MeSH terms
LinkOut - more resources
Full Text Sources
Other Literature Sources
Medical
