

Frailty trajectories to identify end of life: a longitudinal population-based study
- PMID: 30236103
- PMCID: PMC6148780
- DOI: 10.1186/s12916-018-1148-x
Frailty trajectories to identify end of life: a longitudinal population-based study
Abstract
Background: Timely recognition of the end of life allows patients to discuss preferences and make advance plans, and clinicians to introduce appropriate care. We examined changes in frailty over 1 year, with the aim of identifying trajectories that could indicate where an individual is at increased risk of all-cause mortality and may require palliative care.
Methods: Electronic health records from 13,149 adults (cases) age 75 and over who died during a 1-year period (1 January 2015 to 1 January 2016) were age, sex and general practice matched to 13,149 individuals with no record of death over the same period (controls). Monthly frailty scores were obtained for 1 year prior to death for cases, and from 1 January 2015 to 1 January 2016 for controls using the electronic frailty index (eFI; a cumulative deficit measure of frailty, available in most English primary care electronic health records, and ranging in value from 0 to 1). Latent growth mixture models were used to investigate longitudinal patterns of change and associated impact on mortality. Cases were reweighted to the population level for tests of diagnostic accuracy.
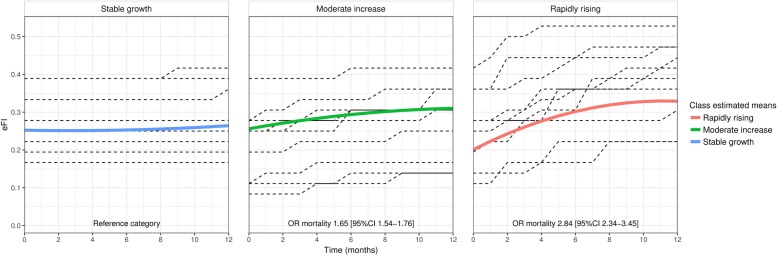
Results: Three distinct frailty trajectories were identified. Rapidly rising frailty (initial increase of 0.022 eFI per month before slowing from a baseline eFI of 0.21) was associated with a 180% increase in mortality (OR 2.84, 95% CI 2.34-3.45) for 2.2% of the sample. Moderately increasing frailty (eFI increase of 0.007 per month, with baseline of 0.26) was associated with a 65% increase in mortality (OR 1.65, 95% CI 1.54-1.76) for 21.2% of the sample. The largest (76.6%) class was stable frailty (eFI increase of 0.001 from a baseline of 0.26). When cases were reweighted to population level, rapidly rising frailty had 99.1% specificity and 3.2% sensitivity (positive predictive value 19.8%, negative predictive value 93.3%) for predicting individual risk of mortality.
Conclusions: People aged over 75 with frailty who are at highest risk of death have a distinctive frailty trajectory in the last 12 months of life, with a rapid initial rise from a low baseline, followed by a plateau. Routine measurement of frailty can be useful to support clinicians to identify people with frailty who are potential candidates for palliative care, and allow time for intervention.
Keywords: End of life; Frailty; Geriatrics; Palliative care; Primary care.
Conflict of interest statement
Ethics approval and consent to participate
Approval for this study was granted by the ResearchOne ethical review panel with oversight from the UK NHS Health Research Authority and the UK Government Health and Social Care Information Centre Confidentiality Advisory Group. ResearchOne was approved by the UK National Health Service (NHS) National Research Ethics Service (11/NE/0184).
Consent for publication
Not applicable.
Competing interests
The authors declare that they have no competing interests.
Publisher’s Note
Springer Nature remains neutral with regard to jurisdictional claims in published maps and institutional affiliations.
Figures
References
Publication types
MeSH terms
Grants and funding
LinkOut - more resources
Full Text Sources
Other Literature Sources
