. 2018 Sep 19;99(6):1274-1288.e6.
doi: 10.1016/j.neuron.2018.08.044.

Kappa Opioid Receptor Distribution and Function in Primary Afferents

Affiliations

Kappa Opioid Receptor Distribution and Function in Primary Afferents

Lindsey M Snyder et al. Neuron. .

Abstract

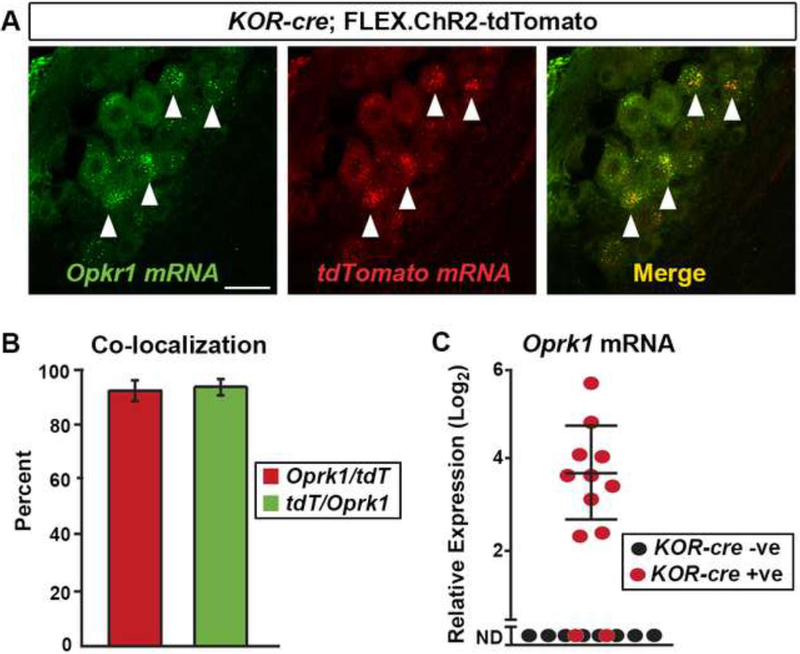
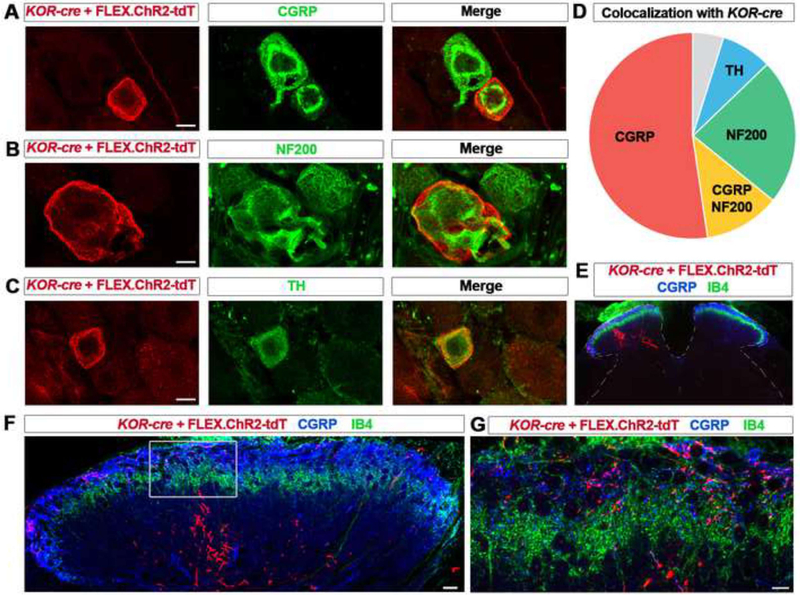
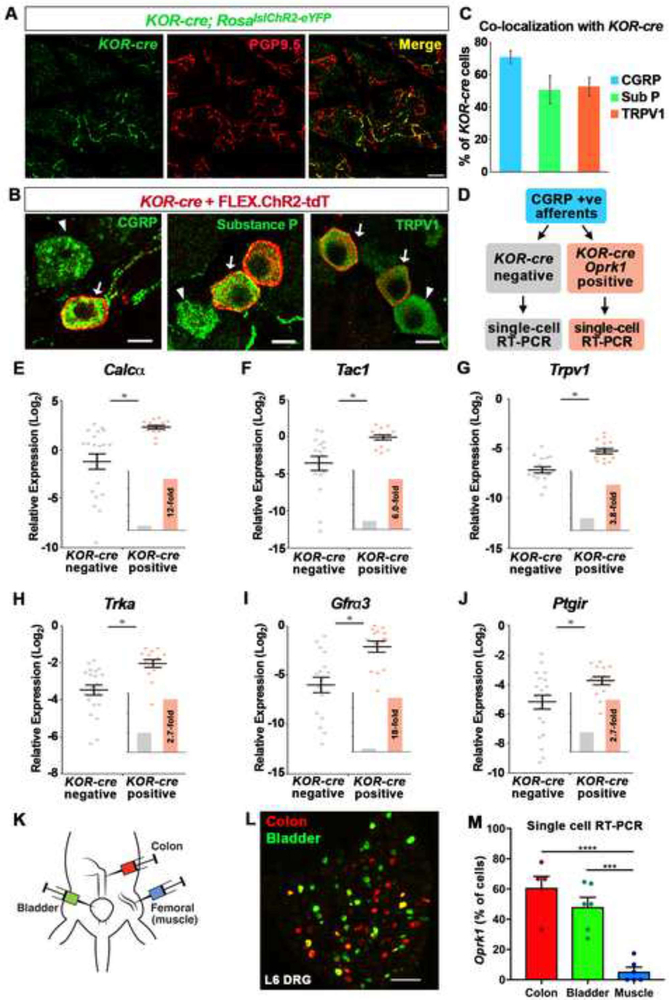
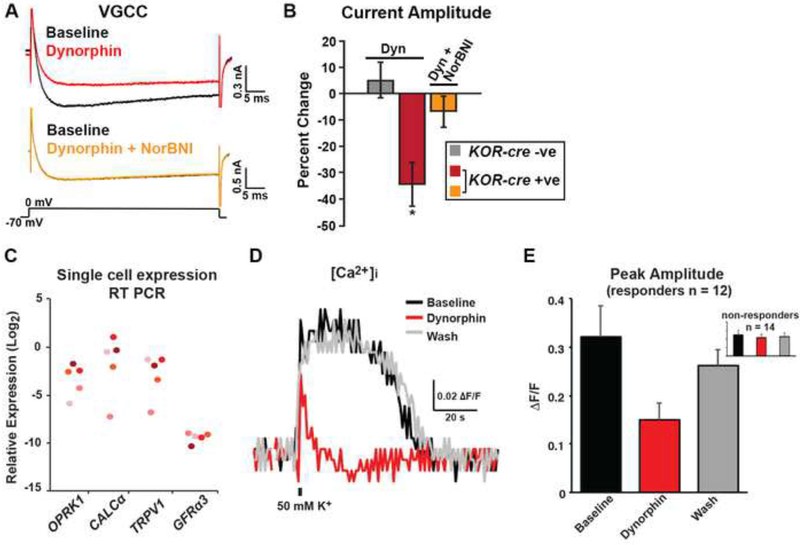
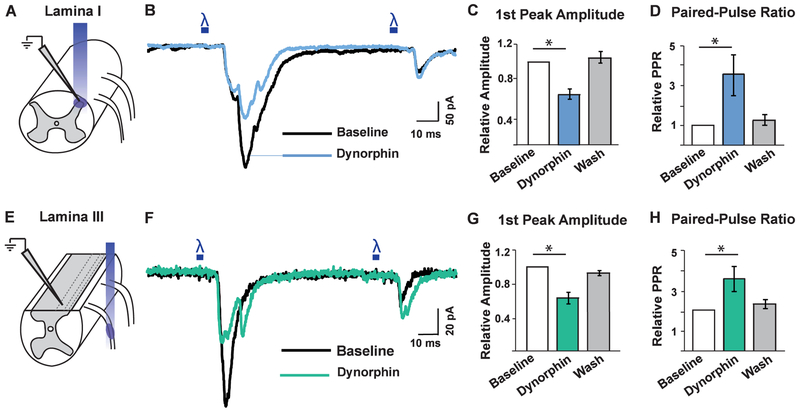
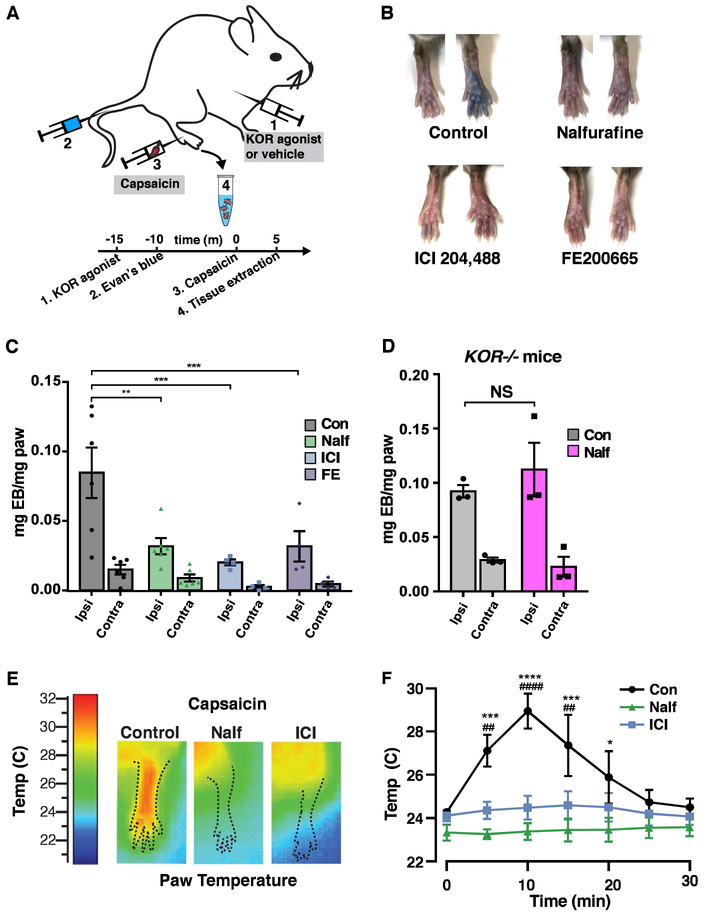
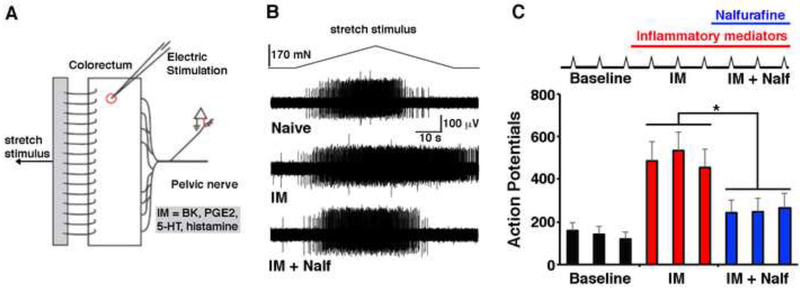
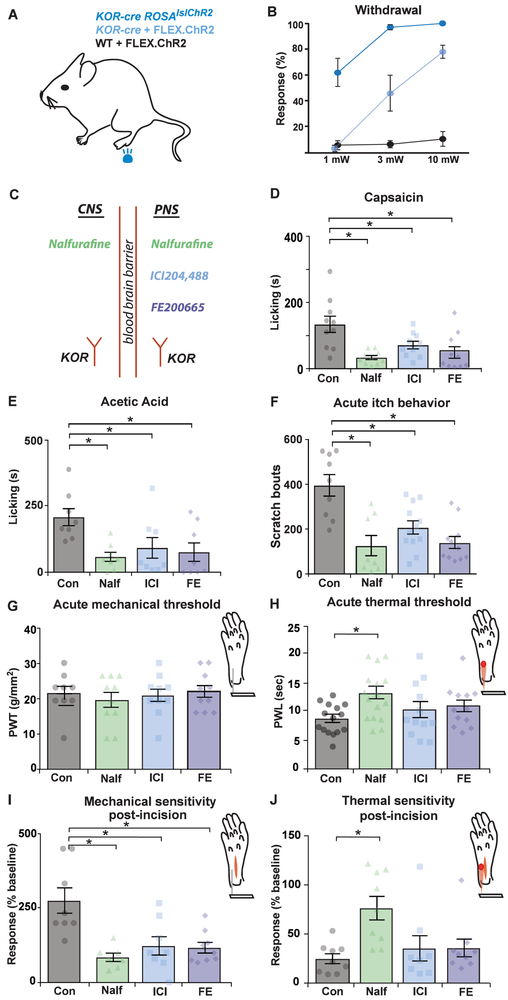
Primary afferents are known to be inhibited by kappa opioid receptor (KOR) signaling. However, the specific types of somatosensory neurons that express KOR remain unclear. Here, using a newly developed KOR-cre knockin allele, viral tracing, single-cell RT-PCR, and ex vivo recordings, we show that KOR is expressed in several populations of primary afferents: a subset of peptidergic sensory neurons, as well as low-threshold mechanoreceptors that form lanceolate or circumferential endings around hair follicles. We find that KOR acts centrally to inhibit excitatory neurotransmission from KOR-cre afferents in laminae I and III, and this effect is likely due to KOR-mediated inhibition of Ca2+ influx, which we observed in sensory neurons from both mouse and human. In the periphery, KOR signaling inhibits neurogenic inflammation and nociceptor sensitization by inflammatory mediators. Finally, peripherally restricted KOR agonists selectively reduce pain and itch behaviors, as well as mechanical hypersensitivity associated with a surgical incision. These experiments provide a rationale for the use of peripherally restricted KOR agonists for therapeutic treatment.

Keywords: DRG; Oprk1; dorsal root ganglia; dynorphin; human; itch; mouse; nalfurafine; pain; primary afferents.


Conflict of interest statement

CONFLICTS OF INTEREST

None of the authors has a conflict of interest.

Figures

Figure 1.
Figure 1.. KOR-cre as a tool for targeting KOR-expressing dorsal root ganglia (DRG) neurons
A.Dual FISH of Oprk1 (green) and tdTomato mRNA (red) shows high co-expression (merge) in DRG neurons. Lumbar DRG neurons were infected with the Cre-dependent virus (AAV.FLEX.ChR2-tdTomato) via IT injection at P40. Arrowheads indicate cells co-expressing Oprk1 and tdTomato mRNA. Scale bar = 25 μm. B. Quantification of (A). Most tdTomato positive neurons (red) co-expressed Oprk1 mRNA, and most Oprk1 postitive neurons (green) co-expressed tdTomato. n = 3 mice. Data are presented as mean ± SEM. C. Single-cell RT-PCR of lumbar DRG neurons. KOR-cre mice were infected with an AAV.FLEX.ChR2-tdTomato virus via IT injection at P40. The majority of KOR-cre; AAV.FLEX.ChR2-tdtomato positive neurons (red dots) express detectable levels of Oprk1 mRNA (10 of 12), while none (0 of 22) of the KOR-cre negative neurons (black dots) express detectable levels of Oprk1 mRNA (only 8 cells are shown for clarity; ND, not detected). Data are presented as the -log2 ΔCT expression relative to GAPDH expression within the same cell such that larger numbers represent higher mRNA expression. Dots represent values from individual cells.
Figure 2.
Figure 2.. KOR-cre labels distinct neurochemical and anatomical subsets of primary afferents
A – C. IHC of lumbar DRG neurons from KOR-cre mice labeled using a Cre-dependent virus (AAV.FLEX.ChR2-tdTomato; IT in adult) and co-stained with antibodies to CGRP (A), NF200 (B), and TH (C). Scale bar = 10 μm. D. Pie chart representing co-localization of immunohistochemical markers with virally-labeled (AAV.FLEX.ChR2-tdTomato, IT in adult) KOR-cre DRG neurons. 52% ± 5% of KOR-cre neurons co-localize with CGRP (red), 12% ± 6% co-localize with both CGRP and NF200 (yellow), 23 ± 6 % co-localize with NF200 (green), and 8% ± 2% co-localize with TH (blue). Only 5% ± 5% of KOR-cre neurons did not co-localize with any of these three markers (gray; n = 3 mice). E – F. Representative images of lumbar spinal cord section of a KOR-cre mouse following an injection of AAV.FLEX.ChR2-tdTomato into the left sciatic nerve at P40. KOR-cre + FLEX.ChR2-tdt primary afferent terminals can be seen ipsilateral to the injection in the dorsal horn (E) in both the deeper dorsal horn below the IB4 band (F) and in the superficial dorsal horn where they co-localize with CGRP (G).
Figure 3.
Figure 3.. KOR-cre mediates recombination of lanceolate afferents and circumferential field receptors
A - B. IHC illustrating examples of a KOR-cre-labeled (red) lanceolate fiber (A) or circumferential fiber (B) innervating hair follicles in the hindpaw skin and co-localization with NF200 (green). KOR-cre afferents were labeled with a Cre-dependent virus (AAV.FLEX.ChR2-tdTomato; IT in adult). Data are representative of n = 2 mice. Scale bar = 10 μm. C - D. Single fiber recordings were performed in KOR-cre, ROSAlslChR2-eYFP mice and fibers were identified with optogenetic tagging by their response to blue light stimulation of their cutaneous receptive field. A representative trace of a single fiber recording from a KOR-cre-positive rapidly adapting A-fiber (C) and large dynamic range fiber (D) upon application of a mechanical stimulus the receptive field in the skin (5 sec, 10 mN) Data are representative of n = 4 cells of each type.
Figure 4.
Figure 4.. KOR is expressed by a transcriptionally distinct subset of peptidergic DRG neurons that preferentially target viscera.
A. Wholemount IHC of the thoracic skin from a KOR-cre; RosalslChR2-eYFP mouse showing that KOR-cre-positive afferents (green) make up a subset of free nerve endings that terminate in the epidermis, as assessed by co-localization with PGP9.5 (red). Scale bar = 10 μm. B. IHC of DRG showing KOR-cre-labeled neurons co-localize with markers of peptidergic neurons. KOR-cre afferents were labeled with a Cre-dependent virus (AAV.FLEX.ChR2-tdTomato; IT in adult) Arrows indicate co-localization; arrowheads indicate CGRP-, Substance P- (SP), or TRPV1-expressing neurons that are not KOR-cre positive. Scale bar = 10 μm. C. Quantification of (B) showing the percentage of KOR-cre + FLEX.ChR2-tdT cells that co-localize with peptidergic markers. Data are presented as mean ± SEM (n = 3 mice). D. Schematic of single-cell RT-PCR experimental design. Lumbar DRG neurons from KOR-cre; RosalslChR2-eYFP mice were collected individually. Only peptidergic cells that expressed Calcα were analyzed. Transcript levels were compared between KOR-cre-labeled neurons that showed clear Oprk1 expression and KOR-cre negative neurons. E - J. Expression levels of Calcα (E), Tac1 (F), Trpv1 (G) TrkA, (H), Gfrα3 (I) and Ptgir (J) mRNA relative to GAPDH in KOR-cre negative (gray) and KOR-cre positive (orange) DRG neurons. Data are presented as the -log2 ΔCT expression relative to GAPDH expression within the same cell such that larger numbers represent higher mRNA expression. There was a significantly higher relative expression level of each transcript in KOR-cre positive neurons compared to KOR-cre negative neurons (Student’s t-test, p < 0.05). Inset shows fold-increase in the average expression level normalized to the average expression in KOR-cre negative neurons. Black bars represent mean ± SEM and colored dots represent values from individual cells (n = 20 KOR-cre negative neurons, n = 15 KOR-cre positive neurons). K. Cartoon illustrating the back-labeling of bladder, colon and muscle primary afferents using fluorophore-conjugated cholera toxin B and/or wheat germ agglutinin. L. Image of L6 DRG in which colon afferents have been back-labeled with CTB-555 (red) and bladder afferents have been back-labeled with CTB-488 (green). Note, a small fraction of afferents dually innervate colon and bladder (yellow). M. Analysis of Oprk1 expression by single cell RT-PCR in afferents that innervate bladder, colon, or muscle. The proportion of bladder afferents or colon afferents that express Oprk1 was significantly higher than the proportion of muscle afferents that express Oprk1. Data are presented as mean ± SEM and symbols represent data points from individual animals (*** < 0.001, **** < 0.0001, One-way ANOVA followed by Holm-Sidak test; n = 5 – 6 mice/condition with 9 – 22 cells per mouse).
Figure 5.
Figure 5.. Activation of KOR inhibits voltage-gated Ca2+ currents in mouse DRG neurons and Ca2+ influx in human peptidergic DRG neurons.
A. Representative traces of voltage-gated Ca2+ currents (VGCC) in a genetically-labeled cell from a KOR-cre; Rosalsl-tdTomato mouse at baseline (black traces, top and bottom), in the presence of dynorphin (1 μm, red; top trace), and in the presence of dynorphin (1 μm) + norBNI (1 μm, yellow; bottom trace). Neurons were held at −70 mV and a 50 ms step to 0 mV was applied. B. Quantification of the percent change in current amplitude of KOR-cre negative neurons (gray; n = 5), KOR-cre positive neurons in the presence of dynorphin (1 μm; red; n = 6), or KOR-cre positive neurons in the presence of dynorphin (1 μm) + norBNI (1 μm; orange; n = 3). There was a significant decrease in current amplitude in the presence of dynorphin in KOR-cre positive neurons (*, paired t-test, p < 0.05). Data are presented as mean ± SEM. C. Expression levels of OPRK1, CALCα, TRPV1, and GFRα3 mRNA in human DRG neurons. Each neuron is represented by a different color. Data are presented as the -log2 ΔCT expression relative to GAPDH expression within the same cell such that larger numbers represent higher mRNA expression. All OPRK1-expressing cells expressed mRNA for the peptidergic markers CALCα, TRPV1, and GFRα3. D - E. Representative traces (D) and quantification (E) of human DRG neuron Ca2+ responses to a brief (800 ms) application of high K+ evoked (50 mM) before (black), during (red) and after (gray) the application of dynorphin (1 μM). The response to dynorphin was significant (greater than 2 standard deviations of the baseline response) in 12 of 26 neurons from 4 donors. Inset shows 14 non-responders. Data are presented as mean ± SEM.
Figure 6.
Figure 6.. KOR activation reduces excitatory neurotransmission from primary afferents that target lamina I and lamina III.
A. Schematic illustrating the experimental set-up used to record from lamina I dorsal horn neurons while optogenetically stimulating KOR-cre primary afferent terminals. KOR-cre primary afferents were infected with a Cre-dependent virus encoding ChR2 (AAV.FLEX.ChR2-tdTomato; IP, P1) enabling selective activation of KOR-cre primary afferent terminals upon application of blue light to the spinal cord. B. Representative trace of whole-cell patch clamp recording from a lamina I neuron at baseline (black) and during bath application of dynorphin (1 μM; blue). Two 5 ms pulses of blue light were given 100 ms apart to elicit light-evoked EPSCs. C - D. Quantification of the amplitude of the first eEPSC (D) and paired-pulse ratio (D) at baseline (white), upon application of dynorphin (1 μM; blue), and following wash (gray). Dynorphin caused a significant decrease in the amplitude of the first eEPSC compared to baseline in lamina I neurons and a significant increase in the paired-pulse ratio compared to baseline, which was reversible (One-way ANOVA and Dunnett’s multiple comparison’s test, p < 0.05; n = 14 cells). Data are presented as mean ± SEM. There was no significant change in the 2nd peak amplitude during dynorphin application compared to baseline (p = 0.1; data not shown) E. Schematic illustrating the experimental set-up used to record from lamina III dorsal horn neurons while optogenetically activating KOR-cre primary afferents. KOR-cre, ROSAlslChR2-eYFP mice were used for these experiments and thus blue light stimulation was applied to the dorsal root in order to selectively activate KOR-cre primary afferents and not KOR-expressing spinal neurons. F. Representative trace of whole-cell patch clamp recording from a lamina III neuron at baseline (black) and during bath application of dynorphin (1 μM; green). Two 5 ms pulses of blue light were given 100 ms apart to elicit light-evoked EPSCs. G - H. Quantification of the first eEPSC relative amplitude (G) and paired pulse ratio (H) at baseline (white), upon application of dynorphin (1 μM; green), and following wash (gray). Dynorphin caused a significant decrease in the amplitude of the first eEPSC and a significant increase in the paired-pulse ratio compared to baseline in lamina III neurons, which was reversible (One-way ANOVA, Dunnett’s multiple comparison’s test, p < 0.05; n = 6 cells). Data are presented as mean ± SEM. There was no significant change in the 2nd peak amplitude during dynorphin application compared to baseline (p = 0.8, data not shown).
Figure 7.
Figure 7.. Peripherally restricted KOR agonists inhibit neurogenic inflammation
A. Schematic illustrating experimental design to measure the effect of KOR agonists on plasma extravasation induced by capsaicin. B - C. Representative images (B) and quantification (C) of Evans blue extravasation upon injection of capsaicin (0.1%) into the ipsilateral paw of mice pretreated with vehicle (Control), nalfurafine (20 μg/kg), ICI204,448 (10 mg/kg) or FE200665 (12 mg/kg), as indicated. Data are presented as mean ± SEM and symbols represent data points from individual animals (two-way ANOVA, Tukey’s post hoc test; * p < 0.05; n = 4 – 6 mice/condition). D. Capsaicin-induced Evans blue extravasation in KOR−/− mice treated with vehicle (Con) or nalfurafine (Nalf, 20 μg/kg). Data are represented as mean + SEM and symbols represent data points from individual animals (two-way ANOVA; NS p > 0.05; n = 3 mice/condition) E - F. Representative images (F) and quantification (G) of infrared thermography to assess paw temperature. Injection of capsaicin (0.1%) caused a transient increase in the temperature of the ipsilateral paw of mice pretreated with vehicle (Control), which was significantly greater than that observe in mice pretreated with nalfurafine (20 μg/kg) or ICI204,448 (10 mg/kg), as indicated. Data represent mean ± SEM (two-way ANOVA followed by Holm-Sidak multiple comparison test; * or # indicates p < 0.05 between nalfurafine and vehicle or ICI and vehicle groups, respectively; n = 4 – 5 mice/condition).
Figure 8.
Figure 8.. KOR signaling in the periphery inhibits inflammatory mediator-induced sensitization of nociceptive afferents
A. Schematic of the colon-nerve preparation and isolation of the receptive field. B. - C. Typical recording (B) and quantification (C) of a teased fiber response to stretch (top trace) before (baseline) and after application of inflammatory mediators (IM: histamine, bradykinin, prostaglandin E2, and serotonin, each at 10 μM) or the combination of inflammatory mediators and 10 nM nalfurafine (IM + Nalf). Data represent mean + SEM (One-way RM AVOVA, Holm-Sidak post hoc; * p < 0.05; n = 8 afferents from 8 mice).
Figure 9.
Figure 9.. Peripherally restricted KOR agonists inhibit chemical pain, itch, and mechanical hypersensitivity following incision.
A. Schematic of optogenetic withdrawal experimental design. Blue light (470 nm) LED stimulation was applied to the glabrous hindpaw for 1 s. Three different groups were tested; KOR-cre; ROSAlslChR2 mice, KOR-cre mice + FLEX.ChR2 (IP at P1), and the wild-type littermates (WT) + FLEX.ChR2 (IP at P1). B. The frequency withdrawal upon optogenetic stimulation at three different LED intensities (1 mW, 3 mW, and 10 mW). Data are presented as mean ± SEM (n = 4 – 6 mice/group with 10 stimulus presentations per mouse). C. Schematic diagram illustrating KOR agonists used in behavioral assays in D - J. Nalfurafine acts both centrally and peripherally, whereas ICI204,488 and FE200665 are peripherally restricted KOR agonists. Nalfurafine (Nalf; 20 μg/kg), ICI204,448 (ICI; 10 mg/kg), and FE200665 (FE; 12 mg/kg) were given IP 15 minutes prior to behavioral testing. All data are presented as mean ± SEM and colored symbols represent data points from individual animals. D. Capsaicin-induced licking behavior (20 μL, intraplantar, 1.5%) was significantly reduced by Nalf, ICI, or FE (One-way ANOVA with Dunnett’s multiple comparison’s test, p < 0.001; n = 10 mice/group). E. Acetic acid-induced licking behavior (20 μL intraplantar, 0.6%) was significantly reduced by Nalf, ICI, or FE (One-way ANOVA, Dunnett’s multiple comparison’s test, p < 0.05; n = 10 mice/group). F. Chloroquine-induced scratching behavior (20 μL intradermal, 200 μg) was significantly reduced by Nalf, ICI, or FE (One-way ANOVA with Dunnett’s multiple comparison’s test, p < 0.001; n = 8 – 12 mice/group). G. Paw withdrawal threshold (PWT) as measured by the von Frey test was not significantly changed by Nalf, ICI, or FE (One-way ANOVA, p = 0.8; n = 9 – 10 mice/group). H. Nalfurafine significantly increased paw withdrawal latency (PWL) as measured by the Hargreaves’ test, but ICI and FE had no effect on PWL (One-way ANOVA with Dunnett’s multiple comparison’s test (* p < 0.05; n = 12 – 16 mice/group). I. Mechanical hypersensitivity, measured 2 hours after an incision of the hindpaw, was significantly reduced by Nalf, ICI, or FE (One-way ANOVA, Dunnett’s multiple comparison’s test, p < 0.001; n = 7 – 9 mice/group). Mechanical sensitivity was recorded as the number of withdrawal responses (out of 10) to a single von Frey fiber (vF # 3.61, 0.4g) applied to the plantar surface of the paw adjacent to the incision. Data are normalized to a baseline measure recorded 24 hours prior to the incision. J. Thermal hypersensitivity, measured 2 hours after an incision of the hindpaw, was significantly reduced by Nalf (One-way ANOVA with Dunnett’s multiple comparison’s test, *, p < 0.01), whereas ICI or FE had no significant effect (p > 0.05; n = 8 – 9 mice/group). Data are normalized to a baseline measure recorded 24 hours prior to the incision.

Comment in

References

    1. Antonijevic I, Mousa SA, Schafer M, and Stein C (1995). Perineurial defect and peripheral opioid analgesia in inflammation. J Neurosci 15, 165–172. - PMC - PubMed
    1. Auh QS, and Ro JY (2012). Effects of peripheral kappa opioid receptor activation on inflammatory mechanical hyperalgesia in male and female rats. Neurosci Lett 524, 111–115. - PMC - PubMed
    1. Azimi E, Reddy VB, Pereira PJS, Talbot S, Woolf CJ, and Lerner EA (2017). Substance P activates Mas-related G protein-coupled receptors to induce itch. J Allergy Clin Immunol 140, 447–453.e443. - PMC - PubMed
    1. Bai L, Lehnert BP, Liu J, Neubarth NL, Dickendesher TL, Nwe PH, Cassidy C, Woodbury CJ, and Ginty DD (2015). Genetic Identification of an Expansive Mechanoreceptor Sensitive to Skin Stroking. Cell 163, 1783–1795. - PMC - PubMed
    1. Bailey CP, and Connor M (2005). Opioids: cellular mechanisms of tolerance and physical dependence. Curr Opin Pharmacol 5, 60–68. - PubMed

Publication types

Substances