. 2018 Oct:36:461-474.
doi: 10.1016/j.ebiom.2018.09.002. Epub 2018 Sep 17.

Retinoic acid signaling balances adult distal lung epithelial progenitor cell growth and differentiation

Affiliations

Retinoic acid signaling balances adult distal lung epithelial progenitor cell growth and differentiation

John-Poul Ng-Blichfeldt et al. EBioMedicine. 2018 Oct.

Abstract

Background: Despite compelling data describing pro-regenerative effects of all-trans retinoic acid (ATRA) in pre-clinical models of chronic obstructive pulmonary disease (COPD), clinical trials using retinoids for emphysema patients have failed. Crucial information about the specific role of RA signaling in adult rodent and human lung epithelial progenitor cells is largely missing.

Methods: Adult lung organoid cultures were generated from isolated primary mouse and human lung epithelial cells, and incubated with pharmacological pathway modulators and recombinant proteins. Organoid number and size were measured, and differentiation was assessed with quantitative immunofluorescence and gene expression analyses.

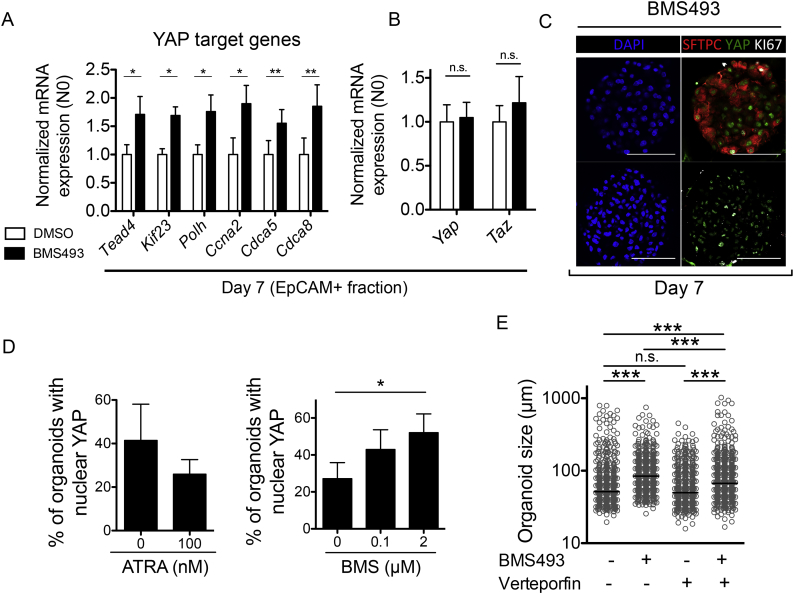
Findings: We unexpectedly found that ATRA decreased lung organoid size, whereas RA pathway inhibition increased mouse and human lung organoid size. RA pathway inhibition stimulated mouse lung epithelial proliferation via YAP pathway activation and epithelial-mesenchymal FGF signaling, while concomitantly suppressing alveolar and airway differentiation. HDAC inhibition rescued differentiation in growth-augmented lung organoids.

Interpretation: In contrast to prevailing notions, our study suggests that regenerative pharmacology using transient RA pathway inhibition followed by HDAC inhibition might hold promise to promote lung epithelial regeneration in diseased adult lung tissue. FUND: This project is funded by the Lung Foundation Netherlands (Longfonds) grant 6.1.14.009 (RG, MK, JS, PSH) and W2/W3 Professorship Award by the Helmholtz Association, Berlin, Germany (MK).

Keywords: Adult stem cells; COPD/emphysema; Lung epithelial organoids; Lung repair/regeneration; Retinoic acid.


Figures

Fig. 1
Fig. 1
Retinoic acid signaling controls adult mouse and human distal lung epithelial organoid growth. A) Schematic of mouse organoid experimental setup, based on [5,40,41]. B) Representative low magnification light microscopy image of organoid culture at day 14, with distinct morphologies highlighted. Scale bar = 200 μm. Representative high magnification examples of B') alveolar, B") airway, and B"’) mixed alveolar/airway morphologies by light microscopy (top) with corresponding immunofluorescence staining (bottom) for pro-surfactant protein C (SFTPC, green), acetylated tubulin (ACT, red), and DAPI (blue). Scale bars = 50 μm (top), 20 μm (bottom). C) Experimental plan. D-F) Effect of ATRA treatment on size and number of organoids cultured in ATRA-free media. D) Representative light microscopy images of organoid cultures treated with DMSO or with ATRA (0·1 μM, 1 μM). Scale bar = 200 μm. E) Quantification of organoid size at day 14 following treatment with DMSO or with ATRA (10 nM, 100 nM). n > 510 organoids per group from N = 5 independent isolations. Mann Whitney test, *** p < 0·001. F) Quantification of organoid number at day 7 treated with DMSO or with ATRA. Mann Whitney test, § p = not significant. G-I) Effect of RA pathway inhibition with the pan-RAR inverse agonist BMS493 on size and number of organoids cultured in media with 10 nM ATRA. G) Representative light microscopy images of organoid cultures treated with DMSO or with BMS493 (0·1 μM, 2 μM). Scale bar = 200 μm. H) Quantification of organoid size at day 14 following treatment without or with BMS493 (0·1 μM, 2 μM). n > 570 organoids per group from N = 5 independent isolations. Kruskall Wallis with Dunn's post test, *** p < 0·001. I) Quantification of organoid number at day 7 treated without or with BMS493. Kruskall Wallis with Dunn's post test, § p = not significant compared to BMS493 0 μM. J) Immunofluorescence images of human organoids at day 21 stained for E-cadherin (green) and β-tubulin (red), with DAPI (blue) as nuclear counterstain. Scale bars = 50 μm (top), 100 μm (bottom). K) Representative light microscopy images of human organoids at day 21 cultured with BMS493 (0, 1, 10 nM). Scale bars = 80 μm. L) Proportion of organoids 50-100 μm (white bars), 100-200 μm (grey bars), or > 200 μm (black bars) in diameter measured at day 21 after treatment with BMS493 (0, 10 nM, 10 nM). Bars represent sum of organoid counts pooled from 4 separate donors. M) Organoid colony forming efficiency of human organoids at day 14 after treatment with BMS493 (0, 1, 10 nM). Kruskall Wallis with Dunn's post test, § p = not significant compared to BMS493 0 nM. N = 4 donors.
Fig. 2
Fig. 2
Retinoic acid signaling balances lung progenitor cell proliferation and survival, and differentiation. A) Strategy to re-sort epithelial cells from fibroblasts in organoid cultures. B) RT-qPCR for Rarb in EpCAM+ and fibroblast cells re-sorted at day 7, following either DMSO (white bars) or BMS493 (2 μM, black bars) treatment. N = 4 independent isolations. Unpaired t-test, ** p < 0·001 compared to corresponding DMSO control. C-D) RT-qPCR for C) cell cycle genes Cdk1, Ccnb1 and Ccnd1, and D) cell survival genes Bcl2, Bik and Bax, in EpCAM+ cells re-sorted at day 7 following DMSO (white bars) or BMS493 (2 μM, black bars) treatment. N = 4 independent isolations. Paired t-test, * p < 0·05 compared to corresponding DMSO control. E) Representative immunofluorescence images of Ki67 staining (white) in organoids at day 7, showing enrichment (white arrows) in organoids following BMS493 treatment, in both alveolar (ProSFTPC+, red), and non-alveolar organoids. DAPI (blue) was used as a nuclear counterstain (blue). Scale bar = 50 μm. F) RT-qPCR on EpCAM+ cells re-sorted from organoid cultures at day 14, showing effect of RA inhibition with BMS493 (2 μM, black bars) on mRNA expression of markers of specific lung cell types, compared to DMSO (white bars). N = 3–4 independent isolations. Unpaired t-test *p < 0·05, **p < 0·01 compared to corresponding DMSO control. G) Effect of ATRA (0, 100 nM, added to ATRA-free media) on proportion of organoids expressing SFTPC and/or ACT. N = 3 independent isolations. Unpaired t-test of total SFTPC+ organoids, *p < 0·01. H) Effect of BMS493 (0, 0·1, 2 μM, added to normal culture media) on proportion of organoids expressing SFTPC and/or ACT. N = 3 independent isolations. One way ANOVA of SFTPC+/ACT organoids with Dunnett's post test, *p < 0·05. I) Representative immunofluorescence images of day 14 organoid cultures treated with ATRA or BMS493, for SFTPC (green), ACT (red) and DAPI (blue). Scale bars = 100 μm. J) Digital quantification of ACT+ area per organoid after BMS493 (2 μM) treatment. n > 46 organoids from 2 independent isolations. Mann Whitney test, **p < 0·01.
Fig. 3
Fig. 3
Retinoic acid signaling controls lung organoid size via epithelial yes-associated protein (YAP) pathway. A-B) RT-qPCR on EpCAM+ cells re-sorted from organoid cultures at day 7, for A) YAP pathway target genes, or B) Yap and Taz, following treatment with DMSO vehicle (white bars) or BMS493 (2 μM; black bars). N = 4 independent isolations. Paired t-test, *p < 0·05, **p < 0·01 compared to corresponding DMSO control. C) Representative immunofluorescence images of day 14 organoid cultures treated with BMS493 (2 μM), for SFTPC (red), Yap (green), and Ki67 (white), showing an alveolar (top) and non-alveolar (bottom) organoid. DAPI was used as a nuclear counterstain (blue). Scale bars = 50 μm. D) Quantification of proportion of organoids exhibiting nuclear Yap protein following ATRA (0, 100 nM, added to ATRA-free media, left), or BMS493 (0, 0·1, 2 μM added to normal culture media, right). Kruskal Wallis with Dunn's post test, *p < 0·05. E) Organoid diameter, measured at day 14, following treatment with DMSO, or BMS493 (2 μM) or the Yap pathway inhibitor verteporfin (4 μM) alone in combination. n > 545 organoids per group, N = 5 independent isolations. Kruskall Wallis with Dunn's post test, *** p < 0·001.
Fig. 4
Fig. 4
Fibroblast-epithelial FGF-FGFR2b signaling contributes to growth induced by RA inhibition. A) RT-qPCR for A) Fgf7 and B) Fgf10 in EpCAM+ and fibroblast cells re-sorted at day 7, following either DMSO (white bars) or BMS493 (2 μM, black bars) treatment. N = 4 independent isolations. Paired t-test, *p < 0·05, ** p < 0·001 compared to corresponding DMSO control. C-D) RT-qPCR on EpCAM+ cells re-sorted from organoid cultures at day 7, for C) FGFR2b target genes, or D) Fgfr2b, following treatment with DMSO vehicle (white bars) or BMS493 (2 μM; black bars). N = 4 independent isolations. Paired t-test, n.s. = not significant. *p < 0·05, **p < 0·01 compared to corresponding DMSO control. E) Organoid diameter, measured at day 14, following treatment with DMSO control, or BMS493 (100 nM) or the pan-FGFR inhibitor CH5183284 (100 nM) alone or in combination. n > 374 organoids per group, N = 3 independent isolations. Kruskall Wallis with Dunn's post test, *p < 0·05, *** p < 0·001. F) Organoid diameter, measured at day 14, following treatment with vehicle, recombinant FGF7 (50 ng/ml) or recombinant FGF10 (100 ng/ml). n > 900 organoids per group, N = 3 independent isolations. Kruskall Wallis with Dunn's post test, *** p < 0·001. G) Representative light microscopic images of day 14 organoid cultures showing effect of recombinant FGF7 and FGF10 on organoid size (arrowheads). Scale bars = 80 μm.
Fig. 5
Fig. 5
HDAC inhibition promotes differentiation following RA inhibition-induced growth. A) Experimental plan. B) Organoid diameter, measured at day 14, following treatment with DMSO or the indicated treatments. n > 289 organoids per group, N = 2 independent isolations. Kruskall Wallis with Dunn's post test, *** p < 0·001 compared to DMSO control, all other between-group comparisons were not significant. C) Representative light microscopic images of day 14 organoid cultures showing effect of the indicated treatments. BMS493 treatment caused an immature organoid morphology that was not restored by a washout period with 100 nM ATRA (empty arrowheads). Addition of SAHA in the washout period restored organoid morphology to similar to DMSO control (white arrowheads). Scale bars = 80 μm. D) RT-qPCR for Rarb on EpCAM+ cells re-sorted from organoid cultures at day 14 after treatment with DMSO or the indicated treatments. N = 2–3 independent isolations. One way ANOVA with Bonferroni's post-test, ***p < 0·001, **p < 0·01 compared to BMS493 (d0-d14). E) RT-qPCR for lung epithelial cell type markers in EpCAM+ cells re-sorted from organoid cultures at day 14 after treatment with DMSO or the indicated treatments. N = 3–6 independent isolations. One way ANOVA with Dunnett's post-test, **p < 0·01, *p < 0·05 compared to corresponding DMSO (14d) control. F) Representative immunofluorescence images of day 14 organoids showing effect of the indicated treatments on SFTPC (green) and SCGB3A2 (red) protein expression, with DAPI (blue) as nuclear counterstain. Scale bars = 50 μm. G) Digital quantification of SFTPC+ staining pixel intensity per organoid from day 14 organoid cultures after the indicated treatments. n > 47 organoids, N = 3 independent isolations. Kruskall Wallis with Dunn's post test, *** p < 0·001, *p < 0·05 compared to DMSO control. H) Effect of the indicated treatments on proportion of organoids expressing SFTPC and/or SCGB3A2. N = 3 independent isolations. One way ANOVA with Dunnett's post test, ** p < 0·01, *p < 0·05, § = not significant compared to corresponding DMSO control.

Similar articles

Cited by

References

    1. Rabe K.F., Watz H. Chronic obstructive pulmonary disease. Lancet. 2017 May 13;389(10082):1931–1940. [PubMed PMID: 28513453] - PubMed
    1. Vogelmeier C.F., Criner G.J., Martinez F.J., Anzueto A., Barnes P.J., Bourbeau J. Global Strategy for the diagnosis, management, and prevention of chronic obstructive lung disease 2017 report. GOLD executive summary. Am J Respir Crit Care Med. 2017 Mar 1;195(5):557–582. [PubMed PMID: 28128970] - PubMed
    1. Hogan B.L., Barkauskas C.E., Chapman H.A., Epstein J.A., Jain R., Hsia C.C. Repair and regeneration of the respiratory system: complexity, plasticity, and mechanisms of lung stem cell function. Cell Stem Cell. 2014 Aug 07;15(2):123–138. [PubMed PMID: 25105578. Pubmed Central PMCID: 4212493] - PMC - PubMed
    1. Rawlins E.L., Okubo T., Xue Y., Brass D.M., Auten R.L., Hasegawa H. The role of Scgb1a1+ Clara cells in the long-term maintenance and repair of lung airway, but not alveolar, epithelium. Cell Stem Cell. 2009 Jun 5;4(6):525–534. [PubMed PMID: 19497281. Pubmed Central PMCID: 2730729] - PMC - PubMed
    1. Barkauskas C.E., Cronce M.J., Rackley C.R., Bowie E.J., Keene D.R., Stripp B.R. Type 2 alveolar cells are stem cells in adult lung. J Clin Invest. 2013 Jul;123(7):3025–3036. [PubMed PMID: 23921127. Pubmed Central PMCID: 3696553] - PMC - PubMed

MeSH terms