. 2018 Oct;20(10):1070-1082.
doi: 10.1016/j.neo.2018.08.011.

CXCR2-Expressing Tumor Cells Drive Vascular Mimicry in Antiangiogenic Therapy-Resistant Glioblastoma

Affiliations

CXCR2-Expressing Tumor Cells Drive Vascular Mimicry in Antiangiogenic Therapy-Resistant Glioblastoma

Kartik Angara et al. Neoplasia. 2018 Oct.

Erratum in

Abstract

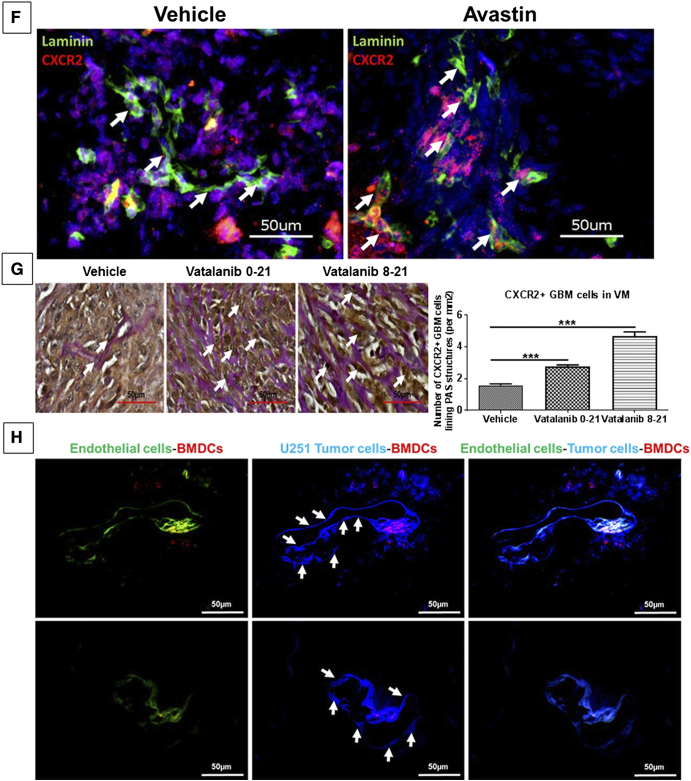
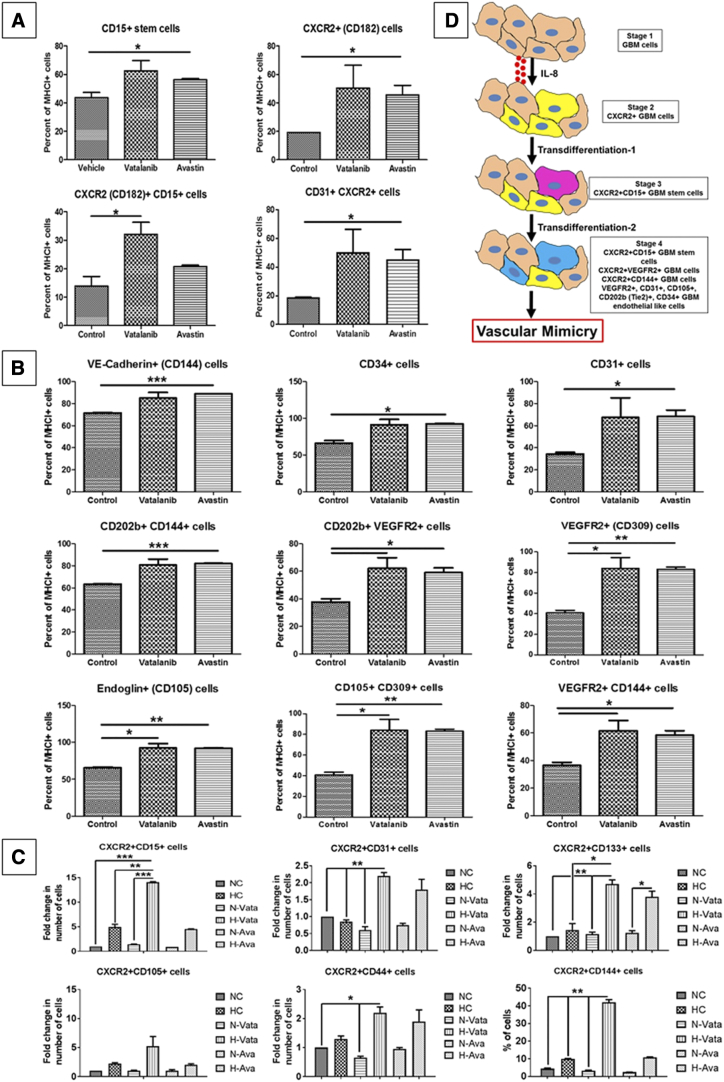
Background: Glioblastoma (GBM) was shown to relapse faster and displayed therapeutic resistance to antiangiogenic therapies (AATs) through an alternative tumor cell-driven mechanism of neovascularization called vascular mimicry (VM). We identified highly upregulated interleukin 8 (IL-8)-CXCR2 axis in tumor cells in high-grade human glioma and AAT-treated orthotopic GBM tumors.

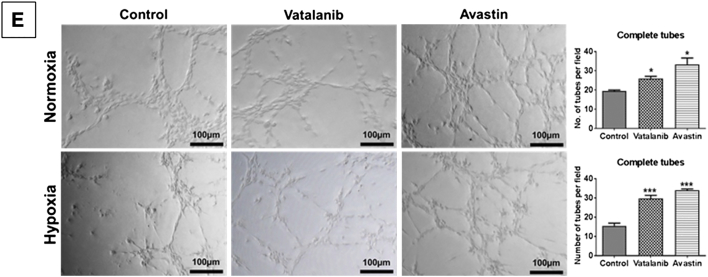
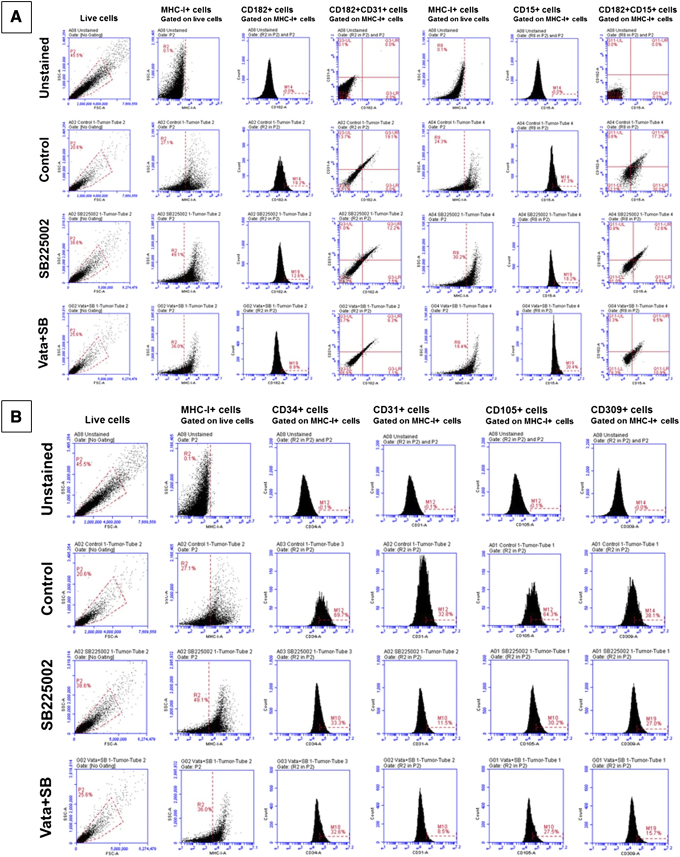
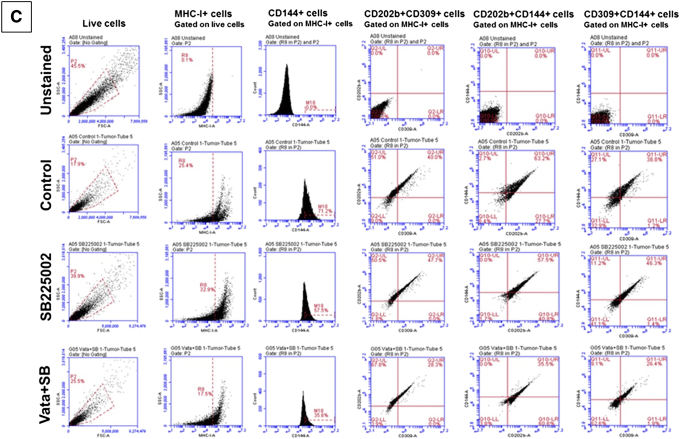
Methods: Human GBM tissue sections and tissue array were used to ascertain the clinical relevance of CXCR2-positive tumor cells in the formation of VM. We utilized U251 and U87 human tumor cells to understand VM in an orthotopic GBM model and AAT-mediated enhancement in VM was modeled using vatalanib (anti-VEGFR2) and avastin (anti-VEGF). Later, VM was inhibited by SB225002 (CXCR2 inhibitor) in a preclinical study.

Results: Overexpression of IL8 and CXCR2 in human datasets and histological analysis was identified as a bonafide candidate to validate VM through in vitro and animal model studies. AAT-treated tumors displayed a higher number of CXCR2-positive GBM-stem cells with endothelial-like phenotypes. Stable knockdown of CXCR2 expression in tumor cells led to decreased tumor growth as well as incomplete VM structures in the animal models. Similar data were obtained following SB225002 treatment.

Conclusions: The present study suggests that tumor cell autonomous IL-8-CXCR2 pathway is instrumental in AAT-mediated resistance and VM formation in GBM. Therefore, CXCR2 can be targeted through SB225002 and can be combined with standard therapies to improve the therapeutic outcomes in clinical trials.


Figures

Figure 1
Figure 1
CXCR2+ tumor cells line PAS-positive VM structures in human GBM samples and positively correlate with recurrence and grade of GBM. (A) CXCR2+ GBM cells lining the PAS-positive VM structures in normal cerebrum (i) and different grades of GBM (grade 1-ii, grade 2-iii, grade 3-iv, and grade 4-v and vi). (B) CXCR2+ cells lining PAS-positive VM structures in different areas of GBM tissue, the main body of GBM (i), the part of the GBM tissue next to necrotic area (ii), and the invasive part of GBM (iii). (C) TCGA brain data analyzed for IL-8 and CXCR2 genes to assess the overall survival and disease-free survival as a Kaplan-Meier estimate. (D) Oncomine data analysis of the different gliomas according to brain and CNS cancer type, recurrence status, and GBM grade. (E) CXCR2+ GBM cells represented by red color (white arrows) lining the VM structures carrying functional red blood cells (circular RBCs auto fluorescence in red color), thereby demonstrating the functional nature of these VM structures. Lectin (green) shows the lining of the functional vessels.
Figure 2
Figure 2
AAT increases the tumor burden, upregulates the IL-8 levels, and increases the numbers of CXCR2+ tumor cells that line the VM structures in GBM animal models. Quantitative data are expressed in mean ± SEM. *P < .05, **P < .01, and ***P < .001. (A) Representative MR images from vehicle (n = 12), vatalanib (n = 16), and avastin (n = 5) animal groups. The quantification of the tumor volume for these treatment groups is presented on the right. (B) Human cytokine array data showing upregulation of IL-8 levels in vivo and (C) in vitro. Representative immunofluorescence images showing (D) increased expression of CXCR2 (red) in vatalanib-treated tumors. (E) CXCR2+ GBM cells in the formation of VM structures in vatalanib-treated tumors. Scale = 50 μm. (F) Laminin and CXCR2 staining in vehicle- and avastin-treated groups and (G) CXCR2 and PAS staining in a rat model of U251 GBM showing increased numbers of CXCR2+ GBM cells lining PAS-positive VM structures in the early treatment vatalanib 0-21 and delayed treatment vatalanib 8-21 groups compared to vehicle-treated group (n = 9 per group); Scale = 50 μm. (H) BFP+ U251GBM (blue) cells as indicated by the white arrows incorporating into the host endothelial vascular structures (green) injected with Br1-GFP AAV; scale = 50 μm.
Figure 2
Figure 2
AAT increases the tumor burden, upregulates the IL-8 levels, and increases the numbers of CXCR2+ tumor cells that line the VM structures in GBM animal models. Quantitative data are expressed in mean ± SEM. *P < .05, **P < .01, and ***P < .001. (A) Representative MR images from vehicle (n = 12), vatalanib (n = 16), and avastin (n = 5) animal groups. The quantification of the tumor volume for these treatment groups is presented on the right. (B) Human cytokine array data showing upregulation of IL-8 levels in vivo and (C) in vitro. Representative immunofluorescence images showing (D) increased expression of CXCR2 (red) in vatalanib-treated tumors. (E) CXCR2+ GBM cells in the formation of VM structures in vatalanib-treated tumors. Scale = 50 μm. (F) Laminin and CXCR2 staining in vehicle- and avastin-treated groups and (G) CXCR2 and PAS staining in a rat model of U251 GBM showing increased numbers of CXCR2+ GBM cells lining PAS-positive VM structures in the early treatment vatalanib 0-21 and delayed treatment vatalanib 8-21 groups compared to vehicle-treated group (n = 9 per group); Scale = 50 μm. (H) BFP+ U251GBM (blue) cells as indicated by the white arrows incorporating into the host endothelial vascular structures (green) injected with Br1-GFP AAV; scale = 50 μm.
Figure 3
Figure 3
CXCR2+ tumor cells acquire endothelial and stem cell–like phenotypes following AAT. Quantitative data are expressed in mean ± SEM. *P < .05, **P < .01, and ***P < .001. n = 3. (A) Representative pictorial depiction of the acquisition of endothelial phenotypes by GBM cells. Flow cytometry data in vivo (B) showing different CXCR2 GBM subpopulations and (C) endothelial-like GBM subpopulations in the AAT-treated groups compared to the vehicle. (D) In vitro data showing CXCR2 GBM cells with endothelial cell–like and stem-like phenotypes following AAT treatment compared to control in hypoxic conditions for 24 hours. (E) U251 GBM cells treated with vehicle (control), vatalanib (10 μM), and avastin (100 μg/ml) and cultured in both normoxic (upper panel) and hypoxic (lower panel) conditions for 6 hours. Quantitative data are expressed in mean ± SEM. *P < .05 and ***P < .001.
Figure 3
Figure 3
CXCR2+ tumor cells acquire endothelial and stem cell–like phenotypes following AAT. Quantitative data are expressed in mean ± SEM. *P < .05, **P < .01, and ***P < .001. n = 3. (A) Representative pictorial depiction of the acquisition of endothelial phenotypes by GBM cells. Flow cytometry data in vivo (B) showing different CXCR2 GBM subpopulations and (C) endothelial-like GBM subpopulations in the AAT-treated groups compared to the vehicle. (D) In vitro data showing CXCR2 GBM cells with endothelial cell–like and stem-like phenotypes following AAT treatment compared to control in hypoxic conditions for 24 hours. (E) U251 GBM cells treated with vehicle (control), vatalanib (10 μM), and avastin (100 μg/ml) and cultured in both normoxic (upper panel) and hypoxic (lower panel) conditions for 6 hours. Quantitative data are expressed in mean ± SEM. *P < .05 and ***P < .001.
Figure 4
Figure 4
CXCR2-KD cells show significant overall decrease in tumor volume and form lesser laminin-positive VM structures. (A) Western blot with densitometry quantification and (B) immunofluorescence imaging showing the decreased expression CXCR2 in the CXCR2 knockdown cells (CXCR2 Cw#5) compared to scramble cells (n = 2). Representative images of (C) CXCR2-KD tumors showing significant reduction in the volume (five-fold) compared to scrambled tumors (n = 4). Immunofluorescence staining showing (D) reduction in the laminin-positive VM structures in the CXCR2-KD tumors compared to the scrambled tumors; scale = 100 μm. Quantitative data are expressed in mean ± SEM. **P < .01. (E) Absence of CXCR2+ GBM cells lining the laminin-positive structures in CXCR2-KD tumors; scale = 50 μm. (F) Scramble U251 and CXCR2 knockdown (CXCR2 DKD) U251 GBM cells were seeded on Matrigel for 6 hours in hypoxia. Quantitative data are expressed in mean ± SEM. *P < .05 and ***P < .001. (G) Differential expression patterns of phosphoproteins and proposed pathway schematic of IL8-CXCR2–mediated VM in GBM tumor cells.
Figure 4
Figure 4
CXCR2-KD cells show significant overall decrease in tumor volume and form lesser laminin-positive VM structures. (A) Western blot with densitometry quantification and (B) immunofluorescence imaging showing the decreased expression CXCR2 in the CXCR2 knockdown cells (CXCR2 Cw#5) compared to scramble cells (n = 2). Representative images of (C) CXCR2-KD tumors showing significant reduction in the volume (five-fold) compared to scrambled tumors (n = 4). Immunofluorescence staining showing (D) reduction in the laminin-positive VM structures in the CXCR2-KD tumors compared to the scrambled tumors; scale = 100 μm. Quantitative data are expressed in mean ± SEM. **P < .01. (E) Absence of CXCR2+ GBM cells lining the laminin-positive structures in CXCR2-KD tumors; scale = 50 μm. (F) Scramble U251 and CXCR2 knockdown (CXCR2 DKD) U251 GBM cells were seeded on Matrigel for 6 hours in hypoxia. Quantitative data are expressed in mean ± SEM. *P < .05 and ***P < .001. (G) Differential expression patterns of phosphoproteins and proposed pathway schematic of IL8-CXCR2–mediated VM in GBM tumor cells.
Figure 5
Figure 5
SB225002 therapy decreases the tumor burden and CXCR2+ endothelial cell-like and stem cell–like populations in GBM tumors. Quantitative data are expressed in mean ± SEM. *P < .05, **P < .01, and ***P < .001. n = 3. (A) Representative MR images from vehicle, SB225002, and vatalanib + SB225002 animal groups. The quantification of the tumor volume for these treatment groups is presented on the right. Flow cytometry data in vivo (B) showing different CXCR2 GBM subpopulations and (C) endothelial-like GBM subpopulations in vehicle, SB225002, and vatalanib + SB225002 animal groups. (D) U251 GBM cells treated with vehicle (control) and two different concentrations of SB225002 (1 μM and 2 μM) and cultured in both normoxic (upper panel) and hypoxic (lower panel) conditions for 6 hours. Quantitative data are expressed in mean ± SEM. *P < .05 and ***P < .001. (E) Representative images of the areas within the tumor showing decreased expression of CXCR2+ GBM cells and vascular laminin coverage compared to the vehicle-treated groups, n = 3.
Figure 6
Figure 6
Proposed schematic of the acquisition of VM-mediated therapy resistance to AAT and intervention using SB225002.
Figure S1
Figure S1
Laminin-positive VM structures in human GBM patient samples. Laminin and PAS staining superimpose on each other, confirming the vascular nature of the PAS-positive VM structures in human GBM samples.
Figure S2
Figure S2
U87 GBM, HF2303, and GBM811 PDX models were developed in athymic nude mice. (A) MRI data show significantly increased tumor burden in vatalanib-treated groups compared to the vehicle- and avastin-treated groups. The quantification of the tumor volume for these treatment groups is presented on the right (n=3). (B) CXCR2 and PAS staining is represented with quantification of the CXCR2+ GBM cells lining the PAS-positive structures after treatment with vehicle (control) and HET0016 in the HF2303 neurospheres (upper panel) and GBM811 PDX models. Scale: 100 μm. Quantitative data are expressed in mean ± SEM. ***P < .001 and ****P < .0001.
Figure S3
Figure S3
GBM U251 and U87 tumor cells acquire endothelial and stem cell–like phenotypes following AAT in vivo mediating resistance to treatment. Quantitative data are expressed in mean ± SEM. *P < .05 and **P < .01. n=3. (A) Flow cytometry data showing CXCR1+ and CXCR1+ CXCR2+ subpopulations in vatalanib- and avastin-treated groups compared to vehicle-treated groups in an in vivo model of U251 GBM. (B) Flow cytometry data showing different CXCR2+ subpopulations and CD15+ stem cells in vatalanib- and avastin-treated groups compared to vehicle-treated groups in an in vivo model of U87 GBM. (C) Flow cytometry data showing CD34, CD144, CD31, CD202b, and CD309 GBM cells in vatalanib- and avastin-treated groups compared to vehicle-treated groups in an in vivo model of U87 GBM. (D) U87 GBM cells treated with vehicle (control), vatalanib (10 μM), and avastin (100 μg/ml) and cultured in both normoxic (upper panel) and hypoxic (lower panel) conditions for 6 hours to determine the formation of tube-like structures. Quantitative data are expressed in mean ± SEM. *P < .05 and ***P < .001.
Figure S4
Figure S4
CXCR2-KD cells show disrupted VM structures. Quantitative data are expressed in mean ± SEM. *P < .05 and ***P < .001. (A) Scrambled and CXCR2-KD cells were implanted in athymic nude mice (four animals in each group) and underwent MRI followed by euthanasia. Collected tissues were stained for laminin and CXCR2 expression. Tumor volume measured by MRI showed significantly decreased tumor growth in CXCR2-KD group. Immunohistochemistry showed very small tumors in CXCR2-KD group with limited number of laminin+ areas compared to that of scrambled tumors (yellow arrows). Scrambled tumors showed a large number of CXCR2+ cells in the tumors (yellow circle) compared to that of CXCR2-KD tumors. CXCR2-KD tumor cells showed lower fluorescent intensity compared to that of surrounding background or brain tissues (yellow oval area). (B) Absence of CXCR2+ GBM cells lining the laminin-positive structures in CXCR2-KD tumors; Scale=50 μm. (C) Laminin-lectin and HIF-1α-laminin staining in the scramble tumor. Scale=50 μm. (D) Scramble U251 and CXCR2 knockdown (CXCR2 DKD) U251 GBM cells were seeded on Matrigel for 6 hours in normoxia. (E) IL-8 and CXCR2 are downstream target genes of the EGFR signaling pathway implicating the role of EGFR in IL-8/CXCR2 axis–mediated VM in GBM tumors.
Figure S5
Figure S5
SB225002 treatment reduces the CXCR1+ and CXCR2+ subpopulations and disrupts tube formation in U87 GBM tumors. Quantitative data are expressed in mean ± SEM. *P < .05, and ***P < .001. (A) SB225002 decreases CXCR1+ and CXCR1+ CXCR2+ populations in an in vivo model of U87 GBM. (B) U87 GBM cells treated with vehicle (control) and two different concentrations of SB225002 (1 μM and 2 μM) and cultured in both normoxic (upper panel) and hypoxic (lower panel) conditions for 6 hours. (C) Cell survival was assessed using increasing concentrations of SB225002 on U251 GBM cells for 24 and 48 hours.
Figure S6
Figure S6
FACS plots of different subpopulations of U251 GBM tumor cells following treatments with control, vatalanib, and avastin. (A) Different subpopulations of CXCR2+, CD15+, CXCR2+CD31+, and CXCR2+CD31+ tumor cells gated on MHC-I (HLA)+ cells. (B) Different subpopulations of CD34+, CD31+, CD105+, and CD309+ cells gated on MHC-I (HLA)+ cells. (C) Different subpopulations of CD144+, CD202b+CD309+, CD202b+CD144+, and CD309+CD144+ tumor cells gated on MHC-I (HLA)+ cells. Representative FACS plots from one animal from each group have been shown here (n=3).
Figure S6
Figure S6
FACS plots of different subpopulations of U251 GBM tumor cells following treatments with control, vatalanib, and avastin. (A) Different subpopulations of CXCR2+, CD15+, CXCR2+CD31+, and CXCR2+CD31+ tumor cells gated on MHC-I (HLA)+ cells. (B) Different subpopulations of CD34+, CD31+, CD105+, and CD309+ cells gated on MHC-I (HLA)+ cells. (C) Different subpopulations of CD144+, CD202b+CD309+, CD202b+CD144+, and CD309+CD144+ tumor cells gated on MHC-I (HLA)+ cells. Representative FACS plots from one animal from each group have been shown here (n=3).
Figure S7
Figure S7
FACS plots of different subpopulations of U251 GBM tumor cells following treatments with control, SB225002 and Vata+SB. (A) Different subpopulations of CXCR2+, CD15+, CXCR2+CD31+, and CXCR2+CD31+ tumor cells gated on MHC-I (HLA)+ cells. (B) Different subpopulations of CD34+, CD31+, CD105+, and CD309+ cells gated on MHC-I (HLA)+ cells. (C) Different subpopulations of CD144+, CD202b+CD309+, CD202b+CD144+, and CD309+CD144+ tumor cells gated on MHC-I (HLA)+ cells. Representative FACS plots from one animal from each group have been shown here (n=3).
Figure S7
Figure S7
FACS plots of different subpopulations of U251 GBM tumor cells following treatments with control, SB225002 and Vata+SB. (A) Different subpopulations of CXCR2+, CD15+, CXCR2+CD31+, and CXCR2+CD31+ tumor cells gated on MHC-I (HLA)+ cells. (B) Different subpopulations of CD34+, CD31+, CD105+, and CD309+ cells gated on MHC-I (HLA)+ cells. (C) Different subpopulations of CD144+, CD202b+CD309+, CD202b+CD144+, and CD309+CD144+ tumor cells gated on MHC-I (HLA)+ cells. Representative FACS plots from one animal from each group have been shown here (n=3).

References

    1. Remer S, Murphy ME. The challenges of long-term treatment outcomes in adults with malignant gliomas. Clin J Oncol Nurs. 2004;8:368–376. - PubMed
    1. Los M, Roodhart JM, Voest EE. Target practice: lessons from phase III trials with bevacizumab and vatalanib in the treatment of advanced colorectal cancer. Oncologist. 2007;12:443–450. - PubMed
    1. Norden AD, Drappatz J, Wen PY. Novel anti-angiogenic therapies for malignant gliomas. Lancet Neurol. 2008;7:1152–1160. - PubMed
    1. Dietrich J, Norden AD, Wen PY. Emerging antiangiogenic treatments for gliomas - efficacy and safety issues. Curr Opin Neurol. 2008;21:736–744. - PubMed
    1. Bergers G, Hanahan D. Modes of resistance to anti-angiogenic therapy. Nat Rev Cancer. 2008;8:592–603. - PMC - PubMed

Publication types

MeSH terms