. 2018 Nov;178(3):1222-1232.
doi: 10.1104/pp.18.00745. Epub 2018 Sep 20.

Evidence for the Regulation of Gynoecium Morphogenesis by ETTIN via Cell Wall Dynamics

Affiliations

Evidence for the Regulation of Gynoecium Morphogenesis by ETTIN via Cell Wall Dynamics

Amélie Andres-Robin et al. Plant Physiol. 2018 Nov.

Abstract

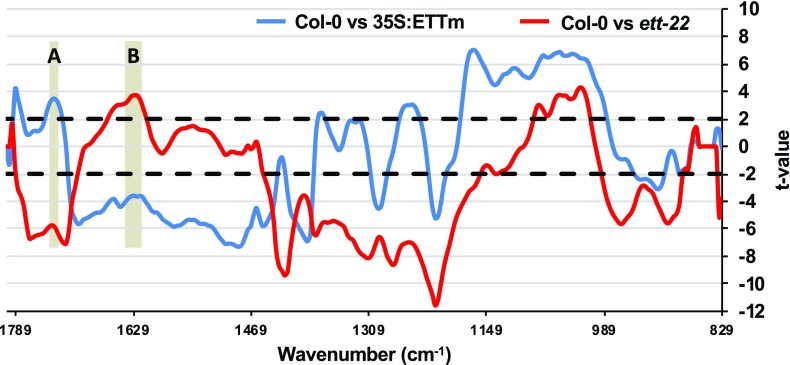
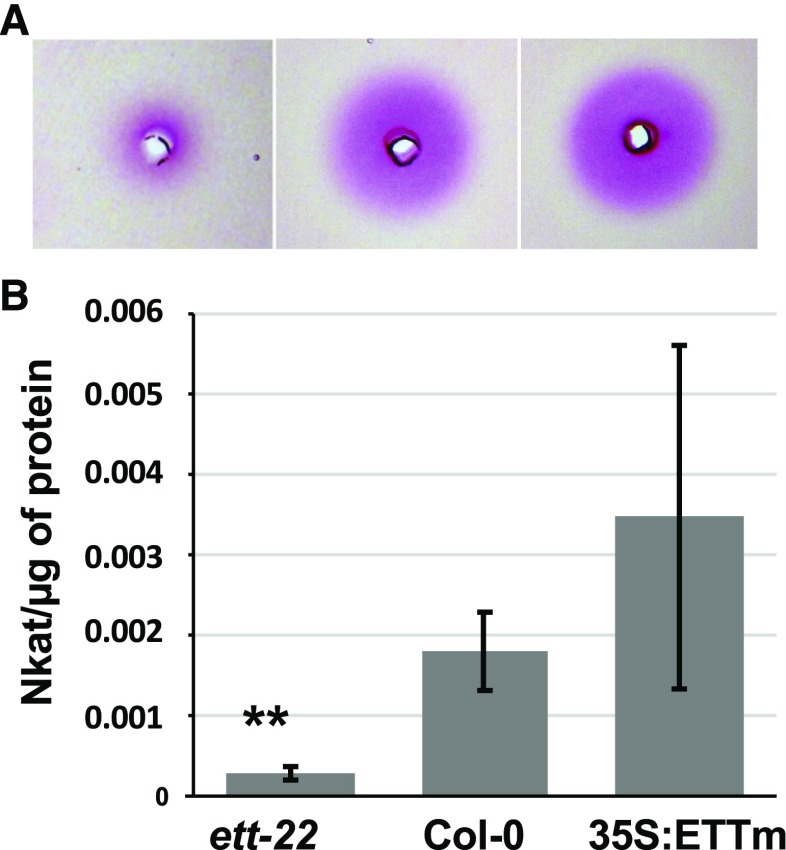
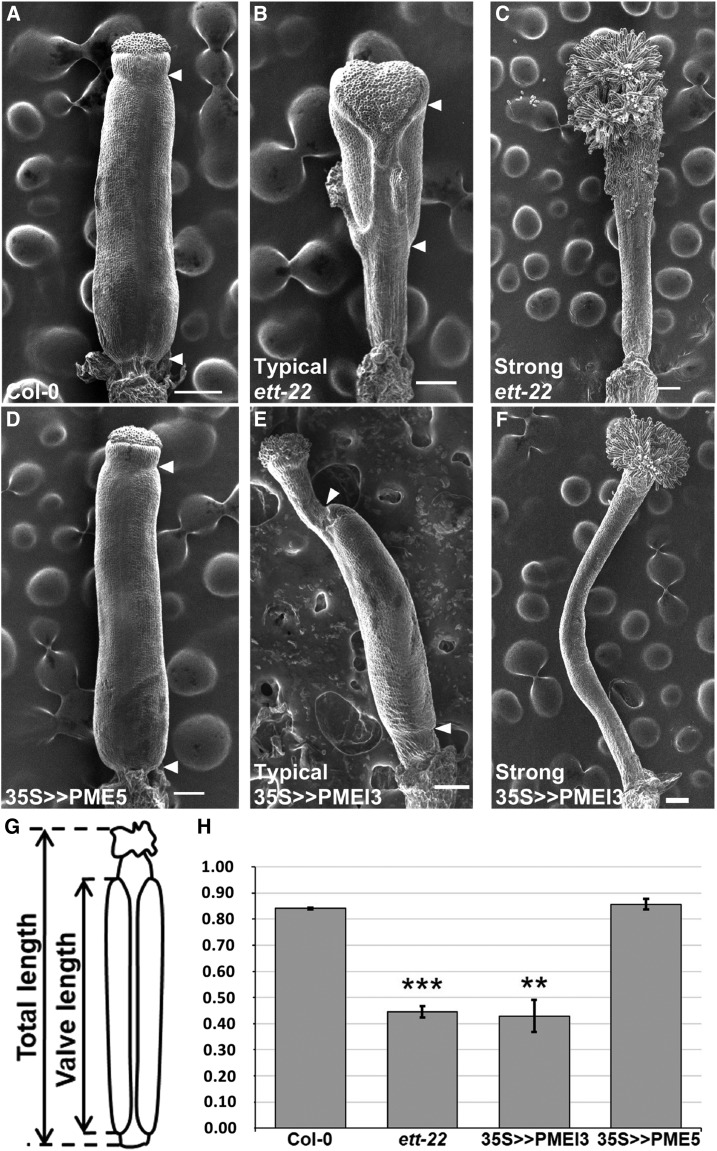
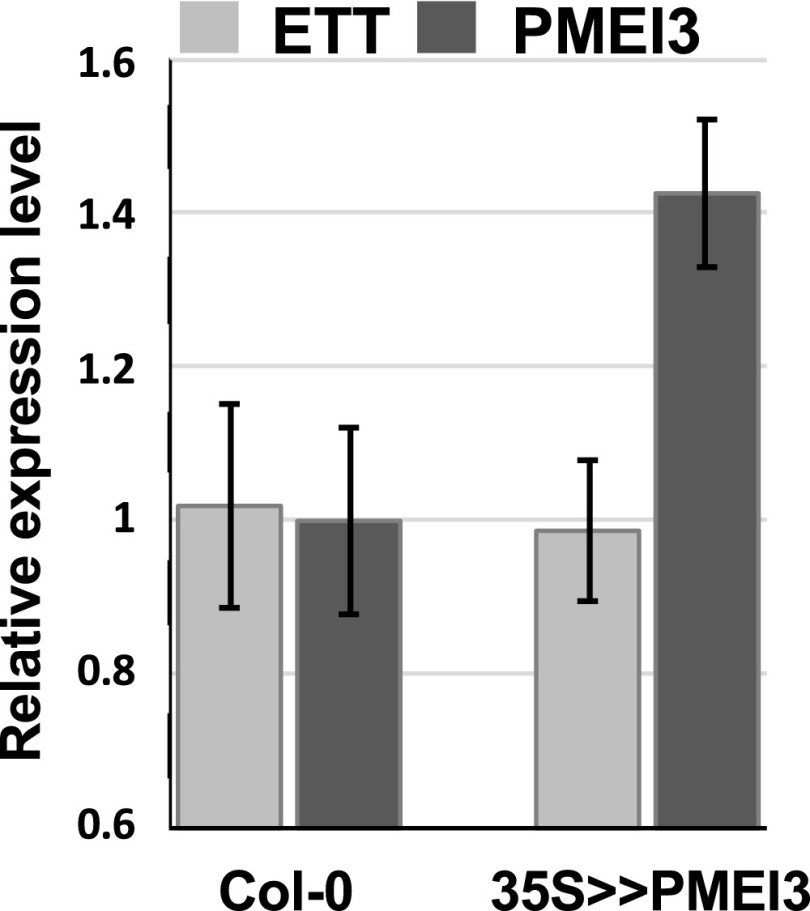
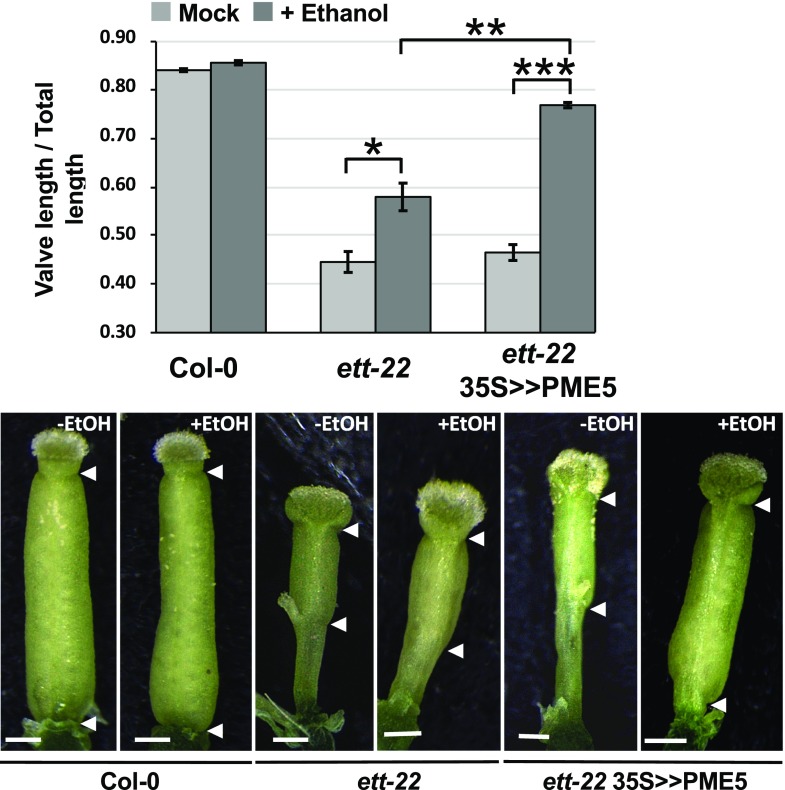
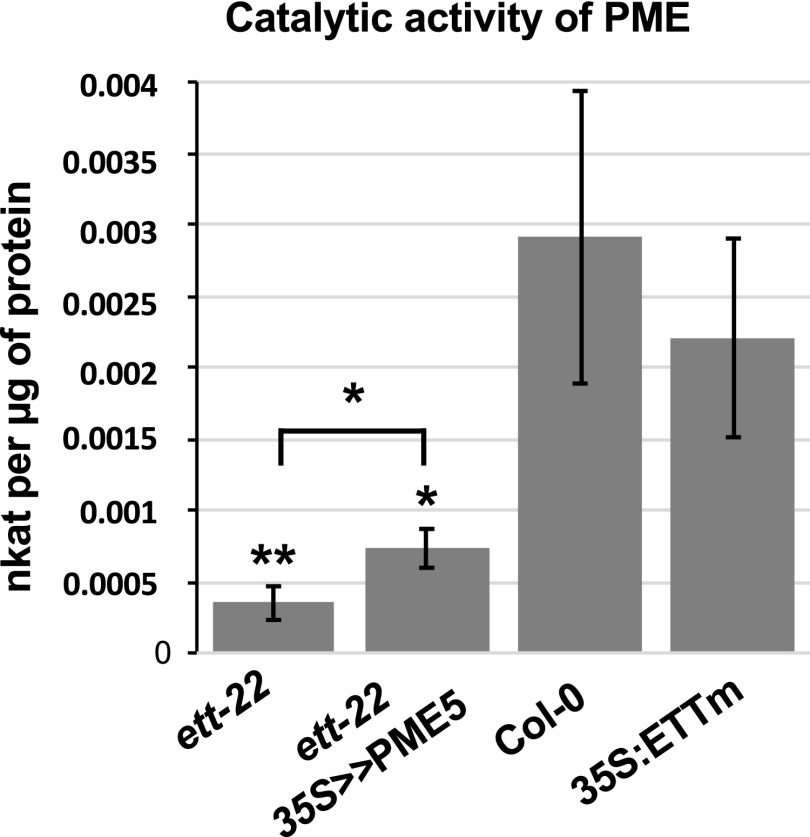
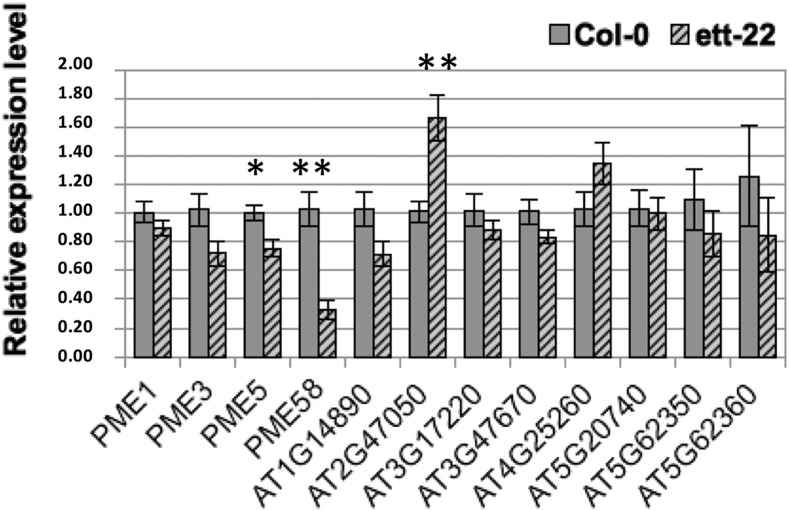
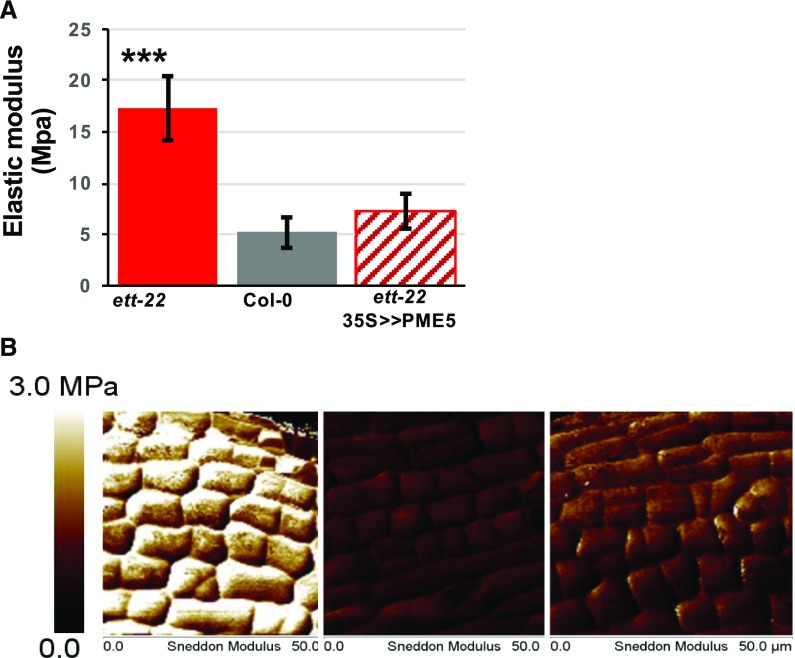
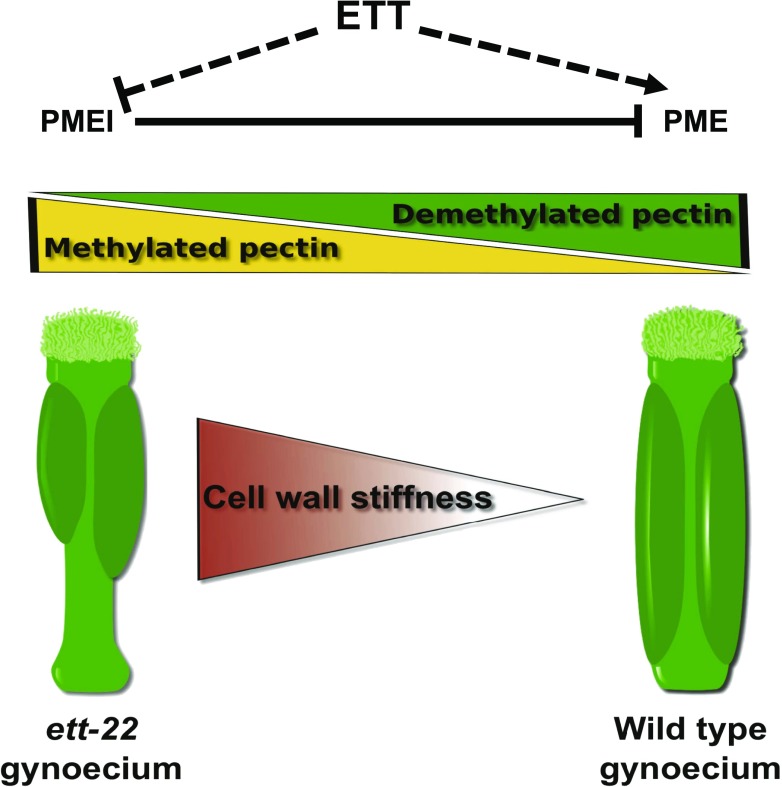
ETTIN (ETT) is an atypical member of the AUXIN RESPONSE FACTOR family of transcription factors that plays a crucial role in tissue patterning in the Arabidopsis (Arabidopsis thaliana) gynoecium. Though recent insights have provided valuable information on ETT's interactions with other components of auxin signaling, the biophysical mechanisms linking ETT to its ultimate effects on gynoecium morphology were until now unknown. Here, using techniques to assess cell-wall dynamics during gynoecium growth and development, we provide a coherent body of evidence to support a model in which ETT controls the elongation of the valve tissues of the gynoecium through the positive regulation of pectin methylesterase (PME) activity in the cell wall. This increase in PME activity results in an increase in the level of demethylesterified pectins and a consequent reduction in cell wall stiffness, leading to elongation of the valves. Though similar biophysical mechanisms have been shown to act in the stem apical meristem, leading to the expansion of organ primordia, our findings demonstrate that regulation of cell wall stiffness through the covalent modification of pectin also contributes to tissue patterning within a developing plant organ.


Figures

Figure 1.
Figure 1.
ETT negatively corresponds with pectin methylesterification status in valves. FTIR measurements were performed on valves at stage 17. Student’s t test of Fourier-transform infrared (FTIR) spectra (829–1,800 cm−1) were performed between Col-0 and ett-22 (red) and between Col-0 and 35S:ETTm (blue). The gray range noted in A corresponds to the interval 1,745 to 1,730 cm−1 (methylesterified pectin), and the gray range noted in B corresponds to the interval 1,630 to 1,600 cm−1 (demethylesterified pectin). Horizontal dotted lines refer to the P = 0.01 significance threshold.
Figure 2.
Figure 2.
ETT promotes PME activity in developing gynoecia. A, Radial gel diffusion assay showing PME activity (fuchsia halo) among proteins extracted from 40 dissected gynoecia from stage 9 to stage 12 of flower development for ett-22, Col-0, and 35S:ETTm. B, Bar diagram showing PME activity measured and calculated per µg of proteins for ett-22 (n = 6), Col-0 (n = 5), and 35S:ETTm (n = 6) from three independent experiments. P values are given by the Mann-Whitney test; *P < 0.05 and **P < 0.005. Error bars represent ses of the mean.
Figure 3.
Figure 3.
PMEI3 overexpression induces a reduction of the valve/gynoecium ratio. A to F, Scanning electron microscopy pictures of gynoecia at stage 12 from Col-0, ett-22, 35S>>PMEI3, and 35S>>PME5; arrows indicate upper and lower valve boundaries. The absence of arrow indicates an absence of valve. Scale bars represent 100 µm. G, Scheme showing how the ratio between valve length and gynoecium length was measured. H, Bar diagram representing the mean ratio between valve length and gynoecium length from Col-0 (n = 30), ett-22 (n = 30), 35S>>PMEI3 (n = 30), and 35S>>PME5 (n = 30). Asterisks represent statistically significant differences according to a Mann-Whitney test; *P < 10-3; **P < 10-6 and ***P < 10-12. Error bars represent ses of the means.
Figure 4.
Figure 4.
ETT and PMEI3 relative expression. Expressions of ETT (light gray) and PMEI3 (dark gray) were measured by real time RT-PCR in inflorescence tissues from Col-0 and 35S>>PMEI3. Error bars represent ses of the mean.
Figure 5.
Figure 5.
Overexpression of PME5 increases valve/gynoecium ratio in ett-22 mutants. Bar diagram representing the mean ratio between valve length and gynoecium length from Col-0 (n = 30), ett-22 (n = 30), and ett-22 35S>>PME5 (n = 60) before and after ethanol induction. Asterisks represent statistically significant differences according to a Mann-Whitney test; *P < 10-3; **P < 10-6; and ***P < 10-12. Error bars represent ses of the means. Scale bars, 0.25 mm.
Figure 6.
Figure 6.
PME activity increases in gynoecia after ethanol induction of PME5 expression. PME activity was measured and calculated per µg of proteins extracted from 40 dissected gynoecia from stage 9 to stage 12 of flower development for ett-22 (n = 7), ett-22 35S >> PME5 (n = 12), Col-0 (n = 8), and 35S:ETTm (n = 4). P values are given by the Mann-Whitney test; *P < 0.05; **P < 0.005. Error bars represent ses of the mean.
Figure 7.
Figure 7.
Relative expression levels of 12 PME and PMEI genes in Col-0 and ett-22 gynoecia. Expression of four PME and eight PMEI genes were measured by RT-qPCR in gynoecia from five plants of each genotype, Col-0 (gray), and ett-22 (striped). RNAs were extracted from 40 gynoecia from stage 9 to 12 either from Col-0 or from ett-22 mutants. GAPDH was used as a reference gene, and Student’s t test was performed between Col-0 and ett-22 for each gene. Asterisks represent statistically significant differences according to a Student’s t test: *P < 0.05 and **P < 0.005. Error bars represent ses of the mean.
Figure 8.
Figure 8.
Effect of ETT and PME activity on stiffness of developing gynoecia. A, Stiffness was measured using atomic force microscopy (AFM). Measurements were performed on dissected gynoecium at stages 9 to 10 of flower development after ethanol treatment. The diagram represents the mean elastic modulus for each genotype: Col-0 (n = 10), ett-22 (n = 14), and ett-22 35S>>PME5 (n = 8). P values are given by the Mann-Whitney test; *P < 0.05; **P < 0.005; and ***P < 0.0005. Error bars represent ses of the mean. B, Representative 50 × 50 µm stiffness map of ett-22, Col-0, and ett-22 35S>>PME5. Elastic moduli range from 0 MPa (dark) to 3 MPa (white).
Figure 9.
Figure 9.
Model linking ETT, pectin methylesterification, stiffness, and valve/gynoecium length ratio.

References

    1. Asnacios A, Hamant O (2012) The mechanics behind cell polarity. Trends Cell Biol 22: 584–591 - PubMed
    1. Boron AK, Van Loock B, Suslov D, Markakis MN, Verbelen J-P, Vissenberg K (2015) Over-expression of AtEXLA2 alters etiolated arabidopsis hypocotyl growth. Ann Bot 115: 67–80 - PMC - PubMed
    1. Boutté Y, Crosnier M-T, Carraro N, Traas J, Satiat-Jeunemaitre B (2006) The plasma membrane recycling pathway and cell polarity in plants: studies on PIN proteins. J Cell Sci 119: 1255–1265 - PubMed
    1. Braybrook SA, Peaucelle A (2013) Mechano-chemical aspects of organ formation in Arabidopsis thaliana: the relationship between auxin and pectin. PLoS One 8: e57813. - PMC - PubMed
    1. Das P, Ito T, Wellmer F, Vernoux T, Dedieu A, Traas J, Meyerowitz EM (2009) Floral stem cell termination involves the direct regulation of AGAMOUS by PERIANTHIA. Development 136: 1605–1611 - PubMed

Publication types

MeSH terms

LinkOut - more resources