Interaction between step-to-step variability and metabolic cost of transport during human walking
- PMID: 30237239
- PMCID: PMC6262764
- DOI: 10.1242/jeb.181834
Interaction between step-to-step variability and metabolic cost of transport during human walking
Abstract
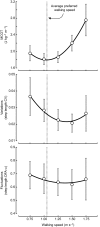
Minimizing the metabolic cost of transport can affect selection of the preferred walking speed. While many factors can affect metabolic cost of transport during human walking, its interaction with step-to-step variability is unclear. Here, we aimed to determine the interaction between metabolic cost of transport and step length variability during human walking at different speeds. In particular, two aspects of step length variability were analyzed: the amount of variations ('variations') and the organization of the step-to-step fluctuations ('fluctuations'). Ten healthy, young participants walked on a treadmill at five speeds, ranging from 0.75 to 1.75 m s-1 Metabolic cost of transport, step length variations (coefficient of variation) and step length fluctuations (quantified via detrended fluctuation analysis) were calculated. A mixed-model ANOVA revealed that variations and walking speed were strong predictors of metabolic cost of transport (R2=0.917, P<0.001), whereas fluctuations were not. Preferred walking speed (1.05±0.20 m s-1) was not significantly different from the speed at which metabolic cost of transport was minimized (1.04±0.05 m s-1; P=0.792), nor from the speed at which fluctuations were most persistent (1.00±0.41 m s-1; P=0.698). The minimization of variations occurred at a faster speed (1.56±0.17 m s-1) than the preferred walking speed (P<0.001). Step length variations likely affect metabolic cost of transport because greater variations are indicative of suboptimal, mechanically inefficient steps. Fluctuations have little or no effect on metabolic cost of transport, but still may relate to preferred walking speed.
Keywords: Energy; Fractal; Locomotion; Persistence; Step length.
© 2018. Published by The Company of Biologists Ltd.
Conflict of interest statement
Competing interestsThe authors declare no competing or financial interests.
Figures


Similar articles
-
The metabolic cost of changing walking speeds is significant, implies lower optimal speeds for shorter distances, and increases daily energy estimates.Biol Lett. 2015 Sep;11(9):20150486. doi: 10.1098/rsbl.2015.0486. Biol Lett. 2015. PMID: 26382072 Free PMC article.
-
Speed-related but not detrended gait variability increases with more sensitive self-paced treadmill controllers at multiple slopes.PLoS One. 2021 May 7;16(5):e0251229. doi: 10.1371/journal.pone.0251229. eCollection 2021. PLoS One. 2021. PMID: 33961654 Free PMC article.
-
Step time asymmetry but not step length asymmetry is adapted to optimize energy cost of split-belt treadmill walking.J Physiol. 2020 Sep;598(18):4063-4078. doi: 10.1113/JP279195. Epub 2020 Jul 28. J Physiol. 2020. PMID: 32662881
-
Comfortable walking speed and energy cost of locomotion in patients with multiple sclerosis.Eur J Appl Physiol. 2020 Mar;120(3):551-566. doi: 10.1007/s00421-019-04295-3. Epub 2020 Jan 9. Eur J Appl Physiol. 2020. PMID: 31919582 Review.
-
The Metabolic Cost of Walking in healthy young and older adults - A Systematic Review and Meta Analysis.Sci Rep. 2019 Jul 10;9(1):9956. doi: 10.1038/s41598-019-45602-4. Sci Rep. 2019. PMID: 31292471 Free PMC article.
Cited by
-
Outside testing of wearable robots for gait assistance shows a higher metabolic benefit than testing on treadmills.Sci Rep. 2021 Jul 21;11(1):14833. doi: 10.1038/s41598-021-94448-2. Sci Rep. 2021. PMID: 34290331 Free PMC article.
-
Natural variability increases human walking metabolic costs and its implications to simulation-based metabolic estimation.bioRxiv [Preprint]. 2025 Mar 15:2025.03.13.643096. doi: 10.1101/2025.03.13.643096. bioRxiv. 2025. PMID: 40161674 Free PMC article. Preprint.
-
Analysis of foothold selection during locomotion using terrain reconstruction.Elife. 2024 Dec 9;12:RP91243. doi: 10.7554/eLife.91243. Elife. 2024. PMID: 39652392 Free PMC article.
-
Effect of sampling frequency on fractal fluctuations during treadmill walking.PLoS One. 2019 Nov 7;14(11):e0218908. doi: 10.1371/journal.pone.0218908. eCollection 2019. PLoS One. 2019. PMID: 31697684 Free PMC article.
-
Locomotor patterns change over time during walking on an uneven surface.J Exp Biol. 2019 Jul 16;222(Pt 14):jeb202093. doi: 10.1242/jeb.202093. J Exp Biol. 2019. PMID: 31253712 Free PMC article.
References
-
- Brockway J. M. (1987). Derivation of formulae used to calculate energy expenditure in man. Hum. Nutr. Clin. Nutr. 41, 463-471. - PubMed
Publication types
MeSH terms
Grants and funding
LinkOut - more resources
Full Text Sources
Other Literature Sources

