. 2018 Oct 8;145(19):dev168468.
doi: 10.1242/dev.168468.

Functional redundancy of frizzled 3 and frizzled 6 in planar cell polarity control of mouse hair follicles

Affiliations

Functional redundancy of frizzled 3 and frizzled 6 in planar cell polarity control of mouse hair follicles

Bo Dong et al. Development. .

Abstract

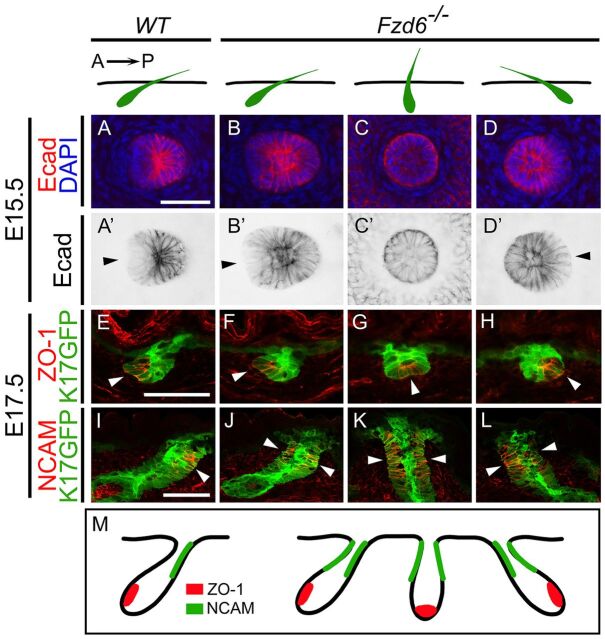
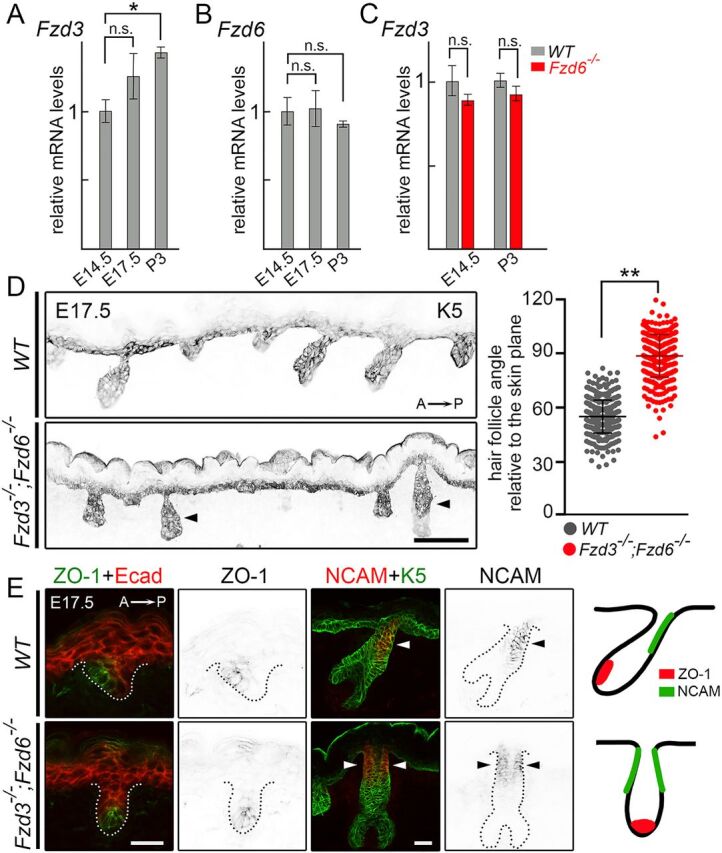
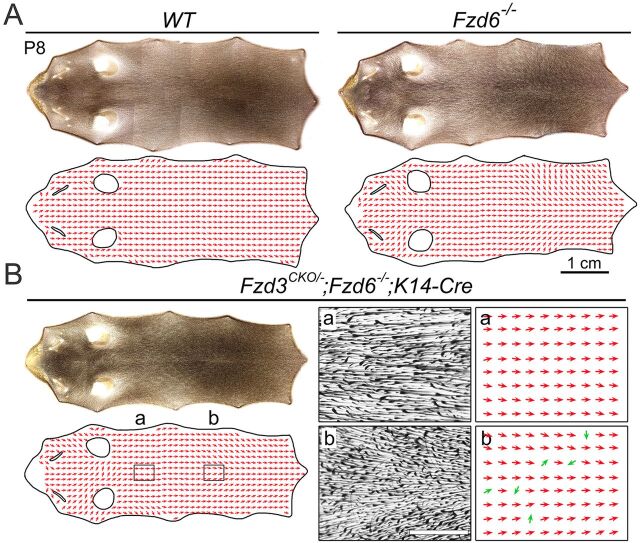
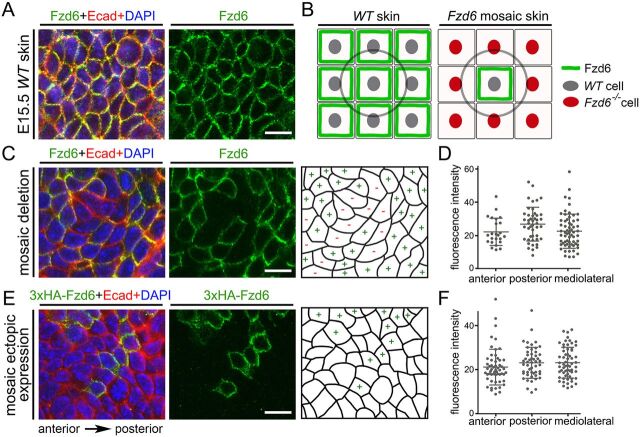
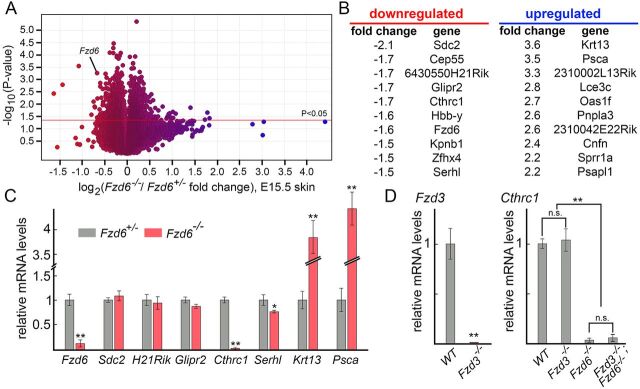
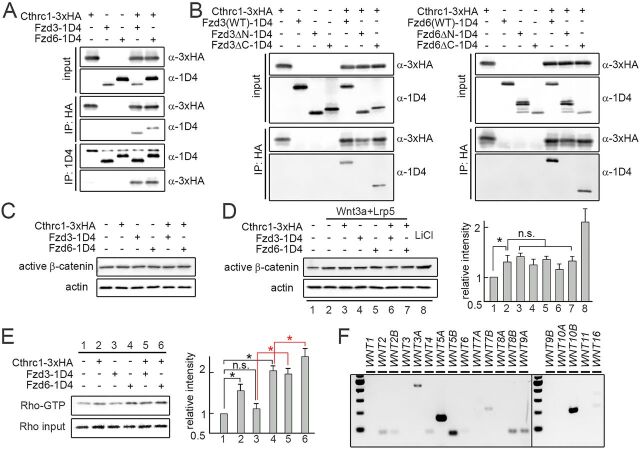
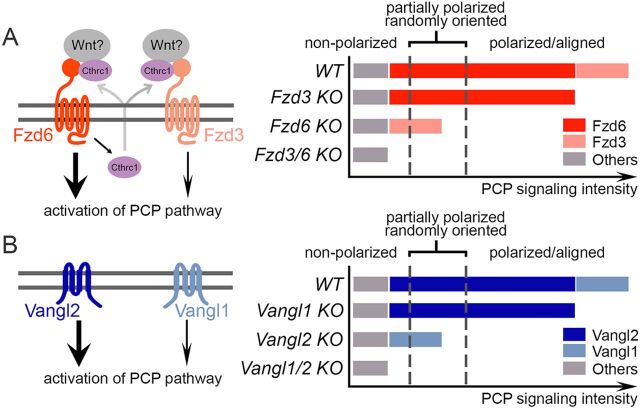
The orientation of mouse hair follicles is controlled by the planar cell polarity (PCP) pathway. Mutations in PCP genes result in two categories of hair mis-orientation phenotype: randomly oriented and vertically oriented to the skin surface. Here, we demonstrate that the randomly oriented hair phenotype observed in frizzled 6 (Fzd6) mutants results from a partial loss of the polarity, due to the functional redundancy of another closely related frizzled gene, Fzd3 Double knockout of Fzd3 and Fzd6 globally, or only in the skin, led to vertically oriented hair follicles and a total loss of anterior-posterior polarity. Furthermore, we provide evidence that, contrary to the prevailing model, asymmetrical localization of the Fzd6 protein is not observed in skin epithelial cells. Through transcriptome analyses and in vitro studies, we show collagen triple helix repeat containing 1 (Cthrc1) to be a potential downstream effector of Fzd6, but not of Fzd3. Cthrc1 binds directly to the extracellular domains of Fzd3 and Fzd6 to enhance the Wnt/PCP signaling. These results suggest that Fzd3 and Fzd6 play a redundant role in controlling the polarity of developing skin, but through non-identical mechanisms.

Keywords: Fzd3; Fzd6; Hair follicle; Mouse development; Planar cell polarity; Skin.


Conflict of interest statement

Competing interestsThe authors declare no competing or financial interests.

Figures

Fig. 1. Partial loss of anterior-posterior polarity in Fzd6−/− hair follicles. Diagrams above panels depict the sectional view of hair follicles (green) in WT and Fzd6−/− skin. In WT skin, hair follicles extend from the dermis to the skin surface, all pointing from anterior to posterior. In Fzd6−/− skin, the orientations of hair follicles are nearly randomized. (A-D′) Whole-mount immunostaining of E15.5 back skins with E-cadherin (Ecad) antibodies. Hair follicles in WT skin show a tilted angle, hair follicles in anterior cells have reduced levels of E-cadherin and adopt shapes different from posterior cells. Hair follicles in Fzd6−/− skin show a combination of different orientations. Arrowheads indicate cells with low Ecad expression. (E-L) Sagittal sections of E17.5 back skins stained with an anterior marker, ZO-1 (E-H), or a posterior marker, NCAM (I-L). Hair follicles were visualized using the fluorescence of a K17GFP transgene (green). (M) Diagrams showing the asymmetrical distribution of ZO-1 and NCAM in WT hair follicles (left) and that the asymmetry of NCAM is lost in Fzd6−/− hair follicles (right). A→P, anterior-to-posterior. Scale bars: 50 µm.
Fig. 1.
Partial loss of anterior-posterior polarity in Fzd6−/− hair follicles. Diagrams above panels depict the sectional view of hair follicles (green) in WT and Fzd6−/− skin. In WT skin, hair follicles extend from the dermis to the skin surface, all pointing from anterior to posterior. In Fzd6−/− skin, the orientations of hair follicles are nearly randomized. (A-D′) Whole-mount immunostaining of E15.5 back skins with E-cadherin (Ecad) antibodies. Hair follicles in WT skin show a tilted angle, hair follicles in anterior cells have reduced levels of E-cadherin and adopt shapes different from posterior cells. Hair follicles in Fzd6−/− skin show a combination of different orientations. Arrowheads indicate cells with low Ecad expression. (E-L) Sagittal sections of E17.5 back skins stained with an anterior marker, ZO-1 (E-H), or a posterior marker, NCAM (I-L). Hair follicles were visualized using the fluorescence of a K17GFP transgene (green). (M) Diagrams showing the asymmetrical distribution of ZO-1 and NCAM in WT hair follicles (left) and that the asymmetry of NCAM is lost in Fzd6−/− hair follicles (right). A→P, anterior-to-posterior. Scale bars: 50 µm.
Fig. 2. Fzd3 and Fzd6 act redundantly in controlling hair follicle polarity. (A) Expression of Fzd3 in WT skins by qRT-PCR. (B) Expression of Fzd6 in WT skins by qRT- PCR. (C) Expression of Fzd3 in WT and Fzd6−/− skin by qRT-PCR. All data are mean±s.e.m. of three biological replicates. GAPDH was used as a control. In A and B, the mRNA expression levels of Fzd3 and Fzd6 in E17.5 and P3 back skins were compared with E14.5 skins using ANOVA followed by Dunnett's multiple comparison test. In C, the Fzd3 expression levels in WT and Fzd6 knockout skins were compared using the Student's t-test at both time points (*P<0.05; n.s., not significant). (D) Epithelial cells and developing hair follicles were visualized by keratin 5 (K5) immunostaining on sagittal sections of E17.5 back skins. In the absence of both Fzd3 and Fzd6, hair follicles are vertically oriented. Hair follicle angles to the plane of the skin were compared using the Student's t-test. **P<0.01. WT, n=456 hair follicles; Fzd3−/−; Fzd6−/−, n=402 hair follicles. Arrowheads indicate vertically oriented hair follicles. (E) Complete loss of anterior-posterior polarity in Fzd3−/−; Fzd6−/− hair follicles. Sagittal sections of E17.5 back skins stained with anterior marker ZO-1 (left panels) or posterior marker NCAM (middle panels). E-cadherin (Ecad) and K5 antibodies were used to highlight skin epithelia and hair follicles. Dotted lines outline the hair follicles. Diagrams show the asymmetrical distribution of ZO-1 and NCAM in WT hair follicles and the complete loss of anterior-posterior polarity in Fzd3−/−; Fzd6−/− hair follicles (right panels). Arrowheads indicate NCAM expressing cells. A→P, anterior-to-posterior. Scale bars: 100 µm in D; 25 µm in E.
Fig. 2.
Fzd3 and Fzd6 act redundantly in controlling hair follicle polarity. (A) Expression of Fzd3 in WT skins by qRT-PCR. (B) Expression of Fzd6 in WT skins by qRT- PCR. (C) Expression of Fzd3 in WT and Fzd6−/− skin by qRT-PCR. All data are mean±s.e.m. of three biological replicates. GAPDH was used as a control. In A and B, the mRNA expression levels of Fzd3 and Fzd6 in E17.5 and P3 back skins were compared with E14.5 skins using ANOVA followed by Dunnett's multiple comparison test. In C, the Fzd3 expression levels in WT and Fzd6 knockout skins were compared using the Student's t-test at both time points (*P<0.05; n.s., not significant). (D) Epithelial cells and developing hair follicles were visualized by keratin 5 (K5) immunostaining on sagittal sections of E17.5 back skins. In the absence of both Fzd3 and Fzd6, hair follicles are vertically oriented. Hair follicle angles to the plane of the skin were compared using the Student's t-test. **P<0.01. WT, n=456 hair follicles; Fzd3−/−; Fzd6−/−, n=402 hair follicles. Arrowheads indicate vertically oriented hair follicles. (E) Complete loss of anterior-posterior polarity in Fzd3−/−; Fzd6−/− hair follicles. Sagittal sections of E17.5 back skins stained with anterior marker ZO-1 (left panels) or posterior marker NCAM (middle panels). E-cadherin (Ecad) and K5 antibodies were used to highlight skin epithelia and hair follicles. Dotted lines outline the hair follicles. Diagrams show the asymmetrical distribution of ZO-1 and NCAM in WT hair follicles and the complete loss of anterior-posterior polarity in Fzd3−/−; Fzd6−/− hair follicles (right panels). Arrowheads indicate NCAM expressing cells. A→P, anterior-to-posterior. Scale bars: 100 µm in D; 25 µm in E.
Fig. 3. Global patterns of hair follicle orientation in back skins of WT, Fzd6−/− and Fzd3CKO/−; Fzd6−/−;K14-Cre mice at P8. (A,B) Montage of images of back skin flatmounts and the corresponding vector maps: anterior is to the left and posterior is to the right. Vector maps are constructed by sampling hair follicle orientations at each point on the vector grid using a similar method to that described previously (Chang et al., 2015). The two narrow openings in vector maps mark the locations of eyes and the two round openings mark the locations of the ears. (A) WT and Fzd6−/− skin. (B) Fzd3CKO/−; Fzd6−/−; K14-Cre skin. The boxed areas a and b correspond to the enlarged images in the adjacent vector maps. Green arrows in b highlight the hair follicles that have orientations uncorrelated to those of their neighbors.
Fig. 3.
Global patterns of hair follicle orientation in back skins of WT, Fzd6−/− and Fzd3CKO/−; Fzd6−/−;K14-Cre mice at P8. (A,B) Montage of images of back skin flatmounts and the corresponding vector maps: anterior is to the left and posterior is to the right. Vector maps are constructed by sampling hair follicle orientations at each point on the vector grid using a similar method to that described previously (Chang et al., 2015). The two narrow openings in vector maps mark the locations of eyes and the two round openings mark the locations of the ears. (A) WT and Fzd6−/− skin. (B) Fzd3CKO/−; Fzd6−/−; K14-Cre skin. The boxed areas a and b correspond to the enlarged images in the adjacent vector maps. Green arrows in b highlight the hair follicles that have orientations uncorrelated to those of their neighbors.
Fig. 4. Localization of Fzd6 in individual skin epithelial cells by genetic mosaic labeling. (A) Whole-mount immunostaining of E15.5 WT back skins with Fzd6 (green) and E-cadherin (Ecad, red) antibodies. (B) Diagrams showing the strategy used to visualize the localization of Fzd6 in individual skin epithelial cells. Flat-mount view of nine cells are shown. The cell in the middle (circled) is used to determine the localization of the Fzd6 protein. (C) Mosaic expression of Fzd6 was induced in Fzd6CKO/−; CAGG-CreERTM embryos treated with 4-HT at E10.5. E15.5 back skins were collected and stained with Fzd6 and E-cadherin antibodies. The right panel shows the schematic of the Fzd6+ versus Fzd6– cells. (D) Quantification of fluorescence intensity on anterior, posterior and mediolateral sides of the cells at the borders of Fzd6+ and Fzd6– clones. (E) Mosaic expression of 3×HA-tagged Fzd6 on a WT background was induced in Rosa26-LSL-Fzd6;CAGG-CreERTM embryos treated with 4-HT at E10.5. E15.5 back skins were collected and stained with 3×HA (green) and E-cadherin antibodies. The right panel shows the schematic of the 3×HA-Fzd6+ versus WT cells. (F) Quantification of fluorescence intensity on anterior, posterior and mediolateral sides of the cells at the borders of 3×HA-Fzd6+ and WT clones. Scale bars: 10 µm.
Fig. 4.
Localization of Fzd6 in individual skin epithelial cells by genetic mosaic labeling. (A) Whole-mount immunostaining of E15.5 WT back skins with Fzd6 (green) and E-cadherin (Ecad, red) antibodies. (B) Diagrams showing the strategy used to visualize the localization of Fzd6 in individual skin epithelial cells. Flat-mount view of nine cells are shown. The cell in the middle (circled) is used to determine the localization of the Fzd6 protein. (C) Mosaic expression of Fzd6 was induced in Fzd6CKO/−; CAGG-CreERTM embryos treated with 4-HT at E10.5. E15.5 back skins were collected and stained with Fzd6 and E-cadherin antibodies. The right panel shows the schematic of the Fzd6+ versus Fzd6 cells. (D) Quantification of fluorescence intensity on anterior, posterior and mediolateral sides of the cells at the borders of Fzd6+ and Fzd6 clones. (E) Mosaic expression of 3×HA-tagged Fzd6 on a WT background was induced in Rosa26-LSL-Fzd6;CAGG-CreERTM embryos treated with 4-HT at E10.5. E15.5 back skins were collected and stained with 3×HA (green) and E-cadherin antibodies. The right panel shows the schematic of the 3×HA-Fzd6+ versus WT cells. (F) Quantification of fluorescence intensity on anterior, posterior and mediolateral sides of the cells at the borders of 3×HA-Fzd6+ and WT clones. Scale bars: 10 µm.
Fig. 5. Identification of Cthrc1 as a potential downstream effector of Fzd6. (A) Transcriptome changes in response to the loss of Fzd6. Mouse MOE430 2.0 Affymetrix arrays were hybridized in three biologically independent experiments with RNA from E15.5 Fzd6+/– and Fzd6–/– back skins. As expected, the probe set representing Fzd6 transcripts shows reduced hybridization with RNA from Fzd6–/– skins. Blue, upregulated; red, downregulated expression. (B) Lists of top ten genes with the highest fold-change, including both up- and downregulated genes. (C) Validation of the Affymetrix gene chip data by qRT-PCR using RNA extracted from E15.5 Fzd6+/– and Fzd6–/– back skins. (D) Expression of Cthrc1 in the skin is not affected by Fzd3 deletion. All data are mean±s.e.m. of three biological replicates. GAPDH was used as a control. Quantification of data between two groups was compared using the Student's t-test. The expression levels of Cthrc1 in panel D were compared using ANOVA followed by Tukey's test. *P<0.05; **P<0.01. n.s., not significant.
Fig. 5.
Identification of Cthrc1 as a potential downstream effector of Fzd6. (A) Transcriptome changes in response to the loss of Fzd6. Mouse MOE430 2.0 Affymetrix arrays were hybridized in three biologically independent experiments with RNA from E15.5 Fzd6+/– and Fzd6–/– back skins. As expected, the probe set representing Fzd6 transcripts shows reduced hybridization with RNA from Fzd6–/– skins. Blue, upregulated; red, downregulated expression. (B) Lists of top ten genes with the highest fold-change, including both up- and downregulated genes. (C) Validation of the Affymetrix gene chip data by qRT-PCR using RNA extracted from E15.5 Fzd6+/– and Fzd6–/– back skins. (D) Expression of Cthrc1 in the skin is not affected by Fzd3 deletion. All data are mean±s.e.m. of three biological replicates. GAPDH was used as a control. Quantification of data between two groups was compared using the Student's t-test. The expression levels of Cthrc1 in panel D were compared using ANOVA followed by Tukey's test. *P<0.05; **P<0.01. n.s., not significant.
Fig. 6. Effects of Cthrc1-Fzd3/6 on canonical and PCP signaling. (A) Binding of Cthrc1 and Fzd3/6 in vitro. Protein extracts from HEK293T cells expressing 1D4-tagged Fzd3 or Fzd6, with or without 3×HA-Cthrc1, were pulled-down with either anti-HA or anti-1D4 antibodies. Both 1D4-Fzd3 and 1D4-Fzd6 co-immunoprecipitate with 3×HA-Cthrc1 and vice versa. (B) Domain requirements of Fzd3/6 for their binding to Cthrc1. Deletion of the N-terminal domain of Fzd3 and Fzd6 abolishes the Cthrc1-Fzd binding, as Fzd3/6ΔN-1D4 fail to co-precipitate with Cthrc1. However, deletion of the C-terminal domain does not affect the Cthrc1-Fzd binding, as Fzd3/6ΔC-1D4 still co-precipitate with Cthrc1. These data suggest the N-terminal (extracellular) domains of Fzd3 and Fzd6 are required for the Cthrc1-Fzd interactions. (C) Cthrc1-Fzd3/6 does not affect the basal level of β-catenin activation in HEK293T cells, as western blotting shows no changes in the active form of β-catenin level in transiently transfected HEK293T cells. Actin was used as a control. (D) Cthrc1-Fzd3/6 does not affect the β-catenin activation induced by Wnt3a. Cells treated with 20 mM LiCl were used as a positive control. (E) There is an increase in RhoA activation in transiently transfected HEK293T cells with Cthrc1 or Fzd6 (lanes 2 and 4 versus lane 1) but not with Fzd3 (lane 3 versus lane 1). A synergistic effect between Fzd3/6 and Cthrc1 in RhoA activation is observed (lane 5 versus lane 3, lane 6 versus lane 4). Experiments were performed three times in D and E and the quantification data are mean±s.e.m. Quantification of data was compared using ANOVA followed by Tukey's t-test. *P<0.05. n.s., not significant. (F) Endogenous expression of WNT genes in HEK293T cells. Among 19 WNT genes, WNT5A, WNT5B and WNT10B are expressed at a high level, as assessed by RT-PCR.
Fig. 6.
Effects of Cthrc1-Fzd3/6 on canonical and PCP signaling. (A) Binding of Cthrc1 and Fzd3/6 in vitro. Protein extracts from HEK293T cells expressing 1D4-tagged Fzd3 or Fzd6, with or without 3×HA-Cthrc1, were pulled-down with either anti-HA or anti-1D4 antibodies. Both 1D4-Fzd3 and 1D4-Fzd6 co-immunoprecipitate with 3×HA-Cthrc1 and vice versa. (B) Domain requirements of Fzd3/6 for their binding to Cthrc1. Deletion of the N-terminal domain of Fzd3 and Fzd6 abolishes the Cthrc1-Fzd binding, as Fzd3/6ΔN-1D4 fail to co-precipitate with Cthrc1. However, deletion of the C-terminal domain does not affect the Cthrc1-Fzd binding, as Fzd3/6ΔC-1D4 still co-precipitate with Cthrc1. These data suggest the N-terminal (extracellular) domains of Fzd3 and Fzd6 are required for the Cthrc1-Fzd interactions. (C) Cthrc1-Fzd3/6 does not affect the basal level of β-catenin activation in HEK293T cells, as western blotting shows no changes in the active form of β-catenin level in transiently transfected HEK293T cells. Actin was used as a control. (D) Cthrc1-Fzd3/6 does not affect the β-catenin activation induced by Wnt3a. Cells treated with 20 mM LiCl were used as a positive control. (E) There is an increase in RhoA activation in transiently transfected HEK293T cells with Cthrc1 or Fzd6 (lanes 2 and 4 versus lane 1) but not with Fzd3 (lane 3 versus lane 1). A synergistic effect between Fzd3/6 and Cthrc1 in RhoA activation is observed (lane 5 versus lane 3, lane 6 versus lane 4). Experiments were performed three times in D and E and the quantification data are mean±s.e.m. Quantification of data was compared using ANOVA followed by Tukey's t-test. *P<0.05. n.s., not significant. (F) Endogenous expression of WNT genes in HEK293T cells. Among 19 WNT genes, WNT5A, WNT5B and WNT10B are expressed at a high level, as assessed by RT-PCR.
Fig. 7. A threshold model of PCP signaling intensity and polarity outcomes in the developing skin. (A) Left, models of Fzd3/6 signaling. Both Fzd3 and Fzd6 can induce activation of the PCP pathway. Cthrc1, the co-factor that enhances Wnt/PCP signaling, is a potential downstream effector of Fzd6. Right, the threshold model of PCP signaling intensity in determining the polarity outcomes of developing mouse skin. Black dotted lines indicate two thresholds – non-polarization and polarization (see text for details). PCP signaling contributed by Fzd6 (dark red bar), by Fzd3 (light red bar) and by others (gray bar). Note that Fzd6 plays a major role compared with Fzd3. (B) Models of Vangl1/2 signaling. Both Vangl1 and Vangl2 can induce activation of the PCP pathway, but Vangl2 plays a major role compared with Vangl1. Similar to Fzd3/6, the combined signaling intensity of Vangl1 and Vangl2 determines the fate of epithelial cells. PCP signaling contributed by Vangl2 (dark blue bar), by Vangl1 (light blue bar) and by others (gray bar).
Fig. 7.
A threshold model of PCP signaling intensity and polarity outcomes in the developing skin. (A) Left, models of Fzd3/6 signaling. Both Fzd3 and Fzd6 can induce activation of the PCP pathway. Cthrc1, the co-factor that enhances Wnt/PCP signaling, is a potential downstream effector of Fzd6. Right, the threshold model of PCP signaling intensity in determining the polarity outcomes of developing mouse skin. Black dotted lines indicate two thresholds – non-polarization and polarization (see text for details). PCP signaling contributed by Fzd6 (dark red bar), by Fzd3 (light red bar) and by others (gray bar). Note that Fzd6 plays a major role compared with Fzd3. (B) Models of Vangl1/2 signaling. Both Vangl1 and Vangl2 can induce activation of the PCP pathway, but Vangl2 plays a major role compared with Vangl1. Similar to Fzd3/6, the combined signaling intensity of Vangl1 and Vangl2 determines the fate of epithelial cells. PCP signaling contributed by Vangl2 (dark blue bar), by Vangl1 (light blue bar) and by others (gray bar).

Similar articles

Cited by

References

    1. Aw, W. Y. and Devenport, D. (2017). Planar cell polarity: global inputs establishing cellular asymmetry. Curr. Opin. Cell Biol. 44, 110-116. 10.1016/j.ceb.2016.08.002 - DOI - PMC - PubMed
    1. Bhanot, P., Brink, M., Samos, C. H., Hsieh, J.-C., Wang, Y., Macke, J. P., Andrew, D., Nathans, J. and Nusse, R. (1996). A new member of the frizzled family from Drosophila functions as a Wingless receptor. Nature 382, 225-230. 10.1038/382225a0 - DOI - PubMed
    1. Bianchi, N., Depianto, D., McGowan, K., Gu, C. and Coulombe, P. A. (2005). Exploiting the keratin 17 gene promoter to visualize live cells in epithelial appendages of mice. Mol. Cell. Biol. 25, 7249-7259. 10.1128/MCB.25.16.7249-7259.2005 - DOI - PMC - PubMed
    1. Boulais, N. and Misery, L. (2007). Merkel cells. J. Am. Acad. Dermatol. 57, 147-165. 10.1016/j.jaad.2007.02.009 - DOI - PubMed
    1. Butler, M. T. and Wallingford, J. B. (2017). Planar cell polarity in development and disease. Nat. Rev. Mol. Cell Biol. 18, 375-388. 10.1038/nrm.2017.11 - DOI - PMC - PubMed

Publication types