. 2019 Jan;17(1):250-262.
doi: 10.1158/1541-7786.MCR-18-0332. Epub 2018 Sep 20.

Targeting TAZ-Driven Human Breast Cancer by Inhibiting a SKP2-p27 Signaling Axis

Affiliations

Targeting TAZ-Driven Human Breast Cancer by Inhibiting a SKP2-p27 Signaling Axis

He Shen et al. Mol Cancer Res. 2019 Jan.

Abstract

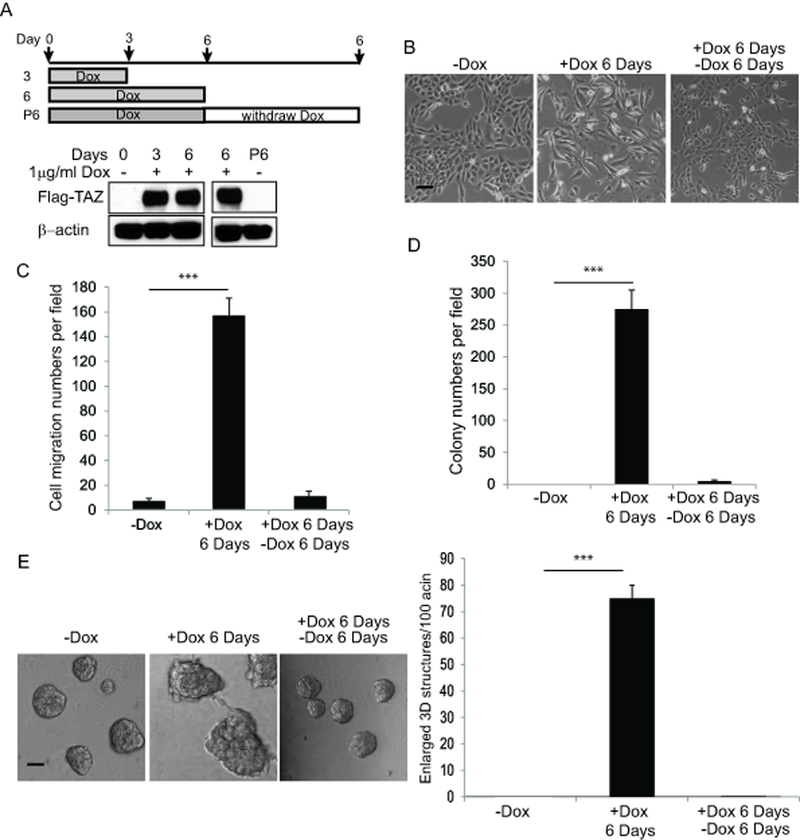
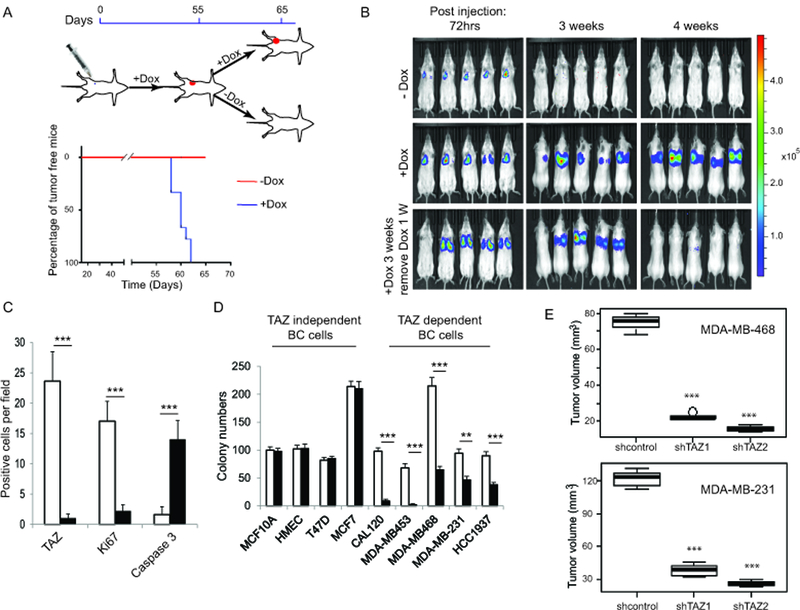
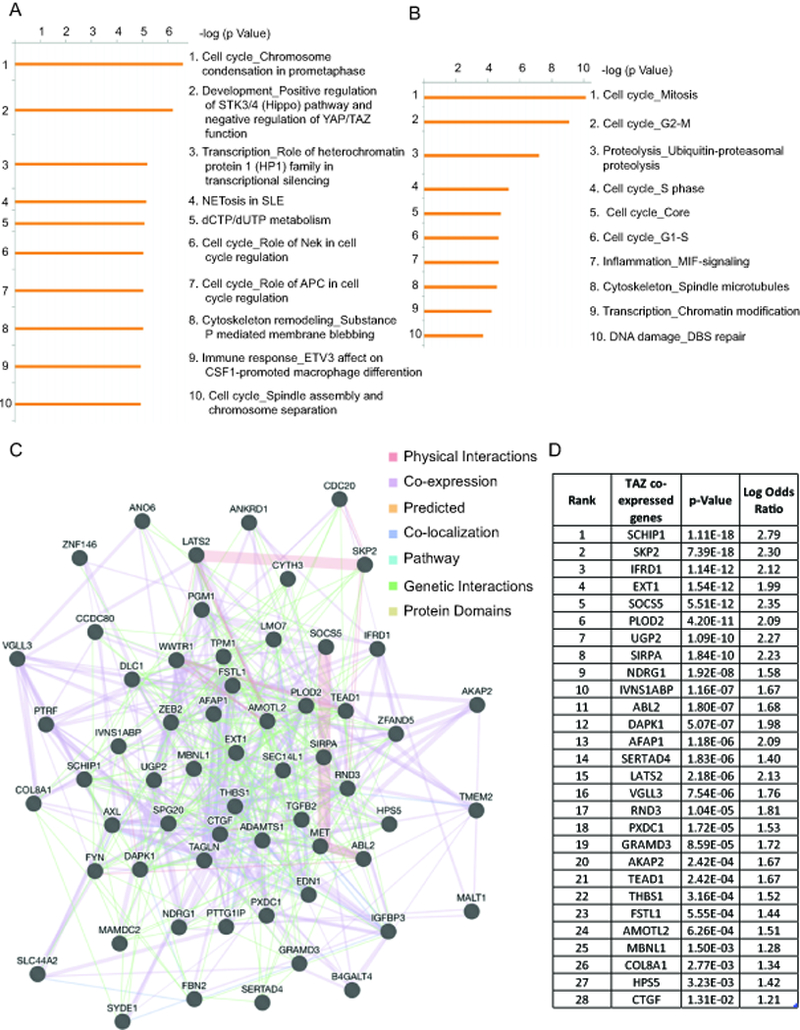
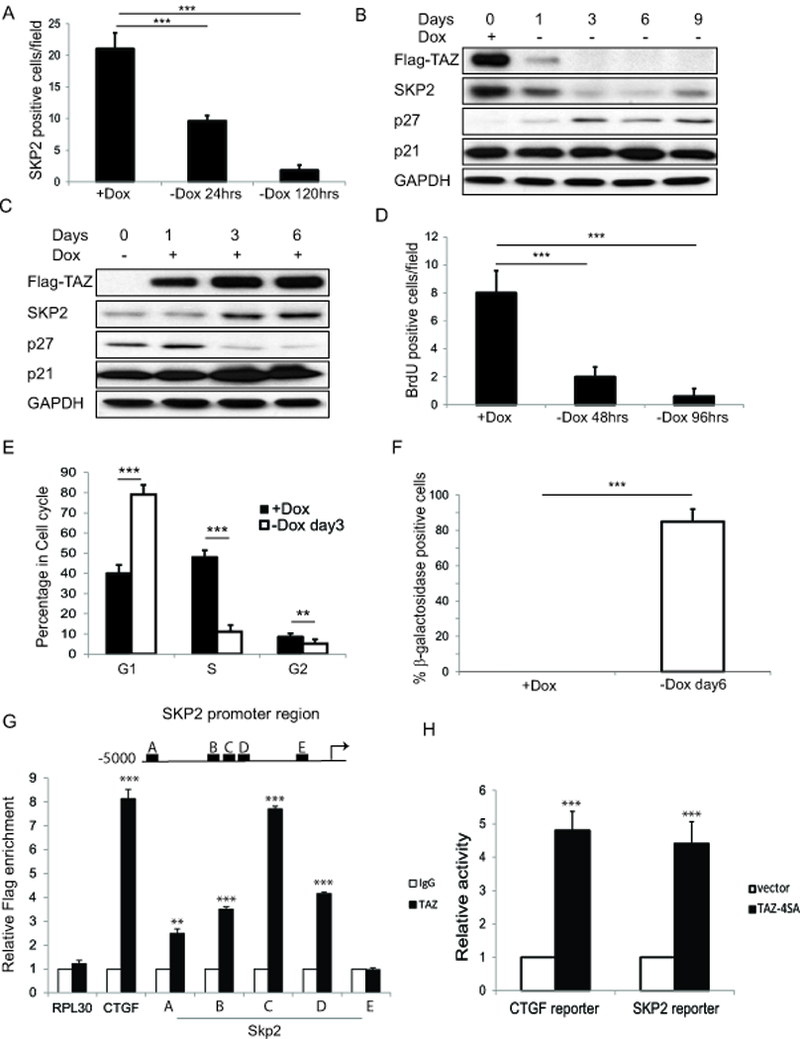
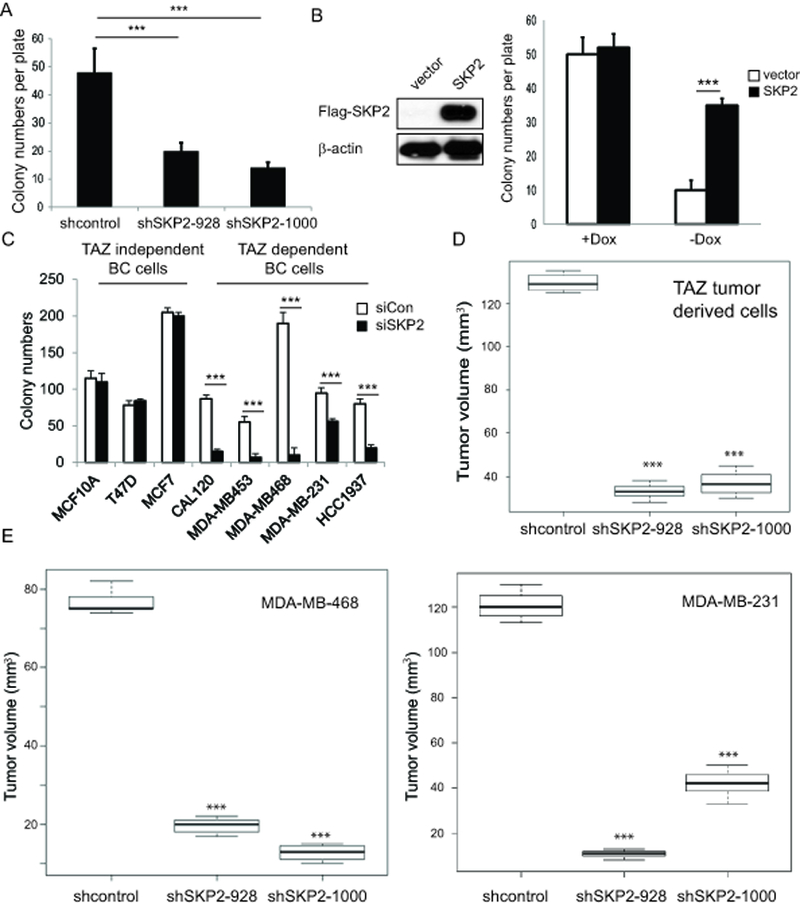
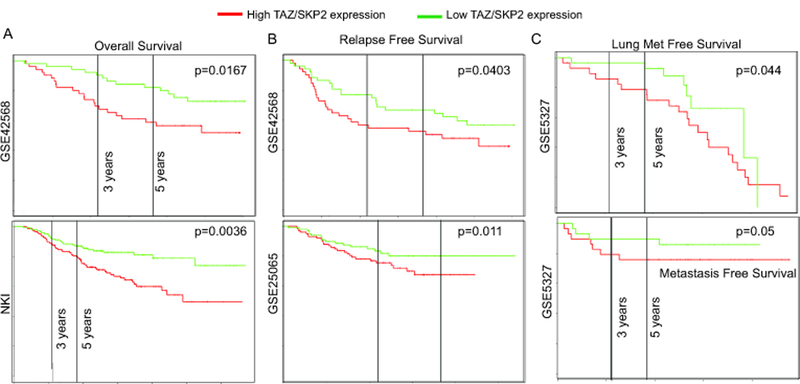
Deregulated expression of the transcriptional coactivator with PDZ-binding motif (WWTR1/TAZ) is a common feature of basal-like breast cancer (BLBC). Yet, how oncogenic TAZ regulates cell-cycle progression and proliferation in breast cancer remains poorly understood, and whether TAZ is required for tumor maintenance has not been established. Here, using an integrative oncogenomic approach, TAZ-dependent cellular programs essential for tumor growth and progression were identified. Significantly, TAZ-driven tumor cells required sustained TAZ expression, given that its withdrawal impaired both genesis and maintenance of solid tumors. Moreover, temporal inhibition of TAZ diminished the metastatic burden in established macroscopic pulmonary metastases. Mechanistic investigation revealed that TAZ controls distinct gene profiles that determine cancer cell fate through cell-cycle networks, including a specific, causal role for S-phase kinase-associated protein 2 (SKP2) in mediating the neoplastic state. Together, this study elucidates the molecular events that underpin the role of TAZ in BLBC and link to SKP2, a convergent communication node for multiple cancer signaling pathways, as a key downstream effector molecule. IMPLICATIONS: Understanding the molecular role of TAZ and its link to SKP2, a signaling convergent point and key regulator in BLBC, represents an important step toward the identification of novel therapeutic targets for TAZ-dependent breast cancer.


Conflict of interest statement

The authors declare no potential conflicts of interest.

Figures

Figure 1
Figure 1. Establishment of Tet-inducible TAZ expressing MCF10A cells.
(A) Schematic illustration of Doxycycline (Dox) administration to Tet-inducible TAZ-4SA transduced MCF10A cells. Immunoblot analyses were performed with anti-Flag and anti-β-Actin antibodies. The samples are lysates from the Tet-inducible TAZ-4SA transduced MCF10A cells without Dox treatment, Dox treatment for 3, 6days or Dox treatment for 6 days followed Dox withdrawal for 6 days. β-Actin was used as the loading control. (B) Representative images of Tet-inducible TAZ-4SA cells 2D culture without Dox, Dox treatment for 6 days or Dox treatment for 6 days followed Dox removal for 6 days. (Scale bar=20μm) (C)Quantification of cell migration assay for Tet-inducible TAZ-4SA cells without Dox, Dox treatment for 6 days or Doxtreatment for 6 days followed Dox removal for 6 days. All the experiments were performed in triplicates. Error barsrepresent SD; *** p<0.001 by two-tailed student’s t-test. (D) Quantification of colony formation in soft-agar assay for Tet-inducible TAZ-4SA cells without Dox, Dox treatment for 6 days or Dox treatment for 6 days followed Dox removal for 6 days. Error bars represent SD; *** p<0.001 by two-tailed student’s t-test. (E) Representative images and quantification of large acini formation in 3D culture for Tet-inducible TAZ-4SA cells without Dox, Dox treatment for 6 days or Dox treatment for 6 days followed Dox removal for 6 days. Error bars represent SD; *** p<0.001 by two-tailed student’s t-test.
Figure 2
Figure 2. TAZ confers reversible mammary tumorigenicity and metastasis.
(A) Schematic illustration for TAZ induced mammary gland tumors in vivo (top panel). Tumors completely regressed in response to Dox withdrawal (lower panel). (B) Representative bioluminescence images of SCID mice intravenously injected with Tet-inducible TAZ expressing cells and then receiving either normal chow, Dox containing chow or Dox containing chow for 3 weeks followed normal chow for 1 week. The colour scale represents the photon flux (photons per second) emitted from the lung region of xenografted mice. All the experiments were performed in duplicate and n=10 mice for each group. (C) Quantification of TAZ, Ki67 and cleaved caspase 3 IHC staining on the tumor samples after continued Dox treatment or Dox removal for 5 days. Error bars represent SD; *** p<0.001 by two-tailed student’s t-test. (D) Quantification of colony-formation assay for MCF10A, HMEC, T47D, MCF7, CAL120, MDA-MB-453, MDA-MB-468, MDA-MB-231 and HCC1937 breast cancer cells transduced with sicontrol or siTAZ. All experiments were performed in triplicate. Error bars represent SD; *** p<0.001 by two-tailed student’s t-test. (E) Quantification of primary tumor volume was measured after 6 weeks mammary fat pad injection of shcontrol or shTAZ transduced MDA-MB-468 and MDA-MB-231 cells into SCID mice. n=6 mice per group; error bars represent SD; *** p<0.001 by two-tailed student’s t-test and p <0.01 for the difference between shTAZ1 vs shTAZ2.
Figure 3
Figure 3. RNA-Seq analysis after short-term TAZ inactivation identifies TAZ-dependent and TAZ-independent DEG categories.
(A) Metacore pathway enrichment analysis of DEGs (multivariate-corrected P-value cut-off <0.05 by Bonferroni). (B) Pathway enrichment analysis of DEGs by DAVID bioinformatics tool (multivariate-corrected P-value cut-off <0.05 by Benjamini). (C) Fifty-six of 187 candidate key gene (CKGs) code for proteins involved in a FI subnetwork with TAZ as the hub. Edge paths are coloured according to their functions, i.e., genetic interactions, pathway, and physical interaction parameters. (D) Pairwise gene correlation analysis for FI network gene sets and TCGA expression data (GSE31979) using the Pearson correlation statistic. The top-scoring correlated genes correspond closely to the Hippo signalling pathway. The P-value threshold is 0.05. Genes were ranked by the percentile of the target genes in the top of all genes as measured in each experiment and the top gene rank percentile are summarized in the table.
Figure 4
Figure 4. TAZ inactivation reduces SKP2 expression and leads to cell cycle arrest.
(A) Quantification of SKP2 IHC staining on the tumor samples from animals treated with Dox-containing chow, or switched to normal chow for either 24 or 120 hours. Error bars represent SD; *** p<0.001 by two-tailed student’s t-test. (B) Immunoblot analyses were performed with anti-Flag, anti-SKP2, anti-p27, anti-p21 and anti-GAPDH antibodies. The samples are lysates from the tumor-derived cells after Dox treatment, or after Dox removal for 1, 3, 6 or 9 days. GAPDH was used as the loading control. (C) Immunoblot analyses were performed with anti-Flag, anti-SKP2, anti-p27, anti-p21 and anti-GAPDH antibodies. The samples are lysates from the tumor-derived cells after Dox removal for 6 days, or followed Dox treatment for 1, 3 or 6 days. GAPDH was used as the loading control. (D) Quantification of Brdu immunofluorescence staining on the tumour samples from animals treated with Dox-containing chow, or switched to normal chow for 48 or 96 hours. (E) Cell cycle distribution quantification of FACS analyses on the tumor-derived cells with Dox or after Dox removal for 3 days. (F) Quantification of β- galactosidase staining on the tumor-derived cells with Dox or after Dox removal for 6 days. (G) Chromatin immunoprecipitation (ChIP) analyses were performed with anti-TAZ or rabbit IgG. Samples were prepared from tumor-derived cells under the condition of Dox treatment. The precipitated chromatin was quantified by qPCR using primers in the promoter region of the SKP2 gene. RPL30 was used as negative control; CTGF was used as positive control. Data represent means + SD; ** p<0.01; *** p<0.001 by two-tailed student’s t-test. (H) Luciferase activity analyses were performed using CTGF or SKP2 promoter-driven luciferase reporters. Indicated luciferase reporters were co-transfected with pCDNA-TAZ-4SA and Renilla (as internal control for transfection efficiency) into 293T cells. A CTGF luciferase reporter was used as positive control. Data represent means + SD; *** p<0.001 by two-tailed student’s t-test.
Figure 5
Figure 5. Knockdown of SKP2 inhibits breast cancer cell proliferation and tumor formation.
(A) Quantification of colony-formation assay for tumor-derived cells transduced with shcontrol or two independent shSKP2 with Dox. All experiments were performed in triplicate. Data represent means + SD; *** p<0.001 by two-tailed student’s t-test. (B) Immunoblot analyses were performed with anti-Flag or anti-β-actin antibodies (left panel). The samples are lysates from vector or SKP2-WT transduced tumor-derived cells with Dox treatment. Quantifications of colony-formation assay for vector or SKP2-WT transduced tumor-derived cells with Dox or without Dox (right panel). All experiments were performed in triplicate. Data represent means + SD; *** p<0.001 by two-tailed student’s t-test. (C) Quantification of colony-formation assay for MCF10A, T47D, MCF7, CAL120, MDA-MB-453, MDA-MB-468, MDA-MB-231 and HCC1937 breast cancer cells transduced with sicontrol or siSKP2. All experiments were performed in triplicate. Data represent means + SD; *** p<0.001 by two-tailed student’s t-test. (D) Quantification of primary tumor volume was measured after 7 weeks mammary fat pad injection of shcontrol or shSKP2-transduced tumor-derived cells in SCID mice with Dox-containing chow. n=5 mice per group; error bars represent SD; ** p<0.01; *** p<0.001 by two-tailed student’s t-test. (E) Quantification of primary tumor volume was measured after 6 weeks mammary fat pad injection of shcontrol or shSKP2-transduced MDA-MB-468 or MDA-MB-231 cells in SCID mice. n=5 mice per group; error bars represent SD; *** p<0.001 by two-tailed student’s t-test.
Figure 6
Figure 6. High TAZ/SKP2 expression predicts poor breast cancer patient outcome.
(A) Kaplan-Meier overall survival (OS), (B) relapse-free survival (RFS) and (C) metastasis-free survival analysis of breast cancer patients using a median split of TAZ-SKP2 gene expression (KM-plotter). The Log-Rank test was used to measure the statistical difference between the high and low TAZ-SKP2 groups for Kaplan-Meier curves. One-way ANOVA was used to measure the differences in TAZ-SKP2 expression in breast cancer patients of various subtypes. X-axis: follow-up time in years; y-axis: cumulative survival. Four independent patient data sets were used from the Gene Expression Omnibus (GSE42568, GSE25065, GSE5327, and NKI from PROGgenv2).t

Similar articles

Cited by

References

    1. Beca F, Polyak K. Intratumor Heterogeneity in Breast Cancer. Adv Exp Med Biol. 2016;882:169–89. - PubMed
    1. Paquet ER, Hallett MT. Absolute assignment of breast cancer intrinsic molecular subtype. J Natl Cancer Inst. 2015;107:357. - PubMed
    1. Holm J, Eriksson L, Ploner A et al. Assessment of Breast Cancer Risk Factors Reveals Subtype Heterogeneity. Cancer Res. 2017;77:3708–17. - PubMed
    1. Rakha EA, Reis-Filho JS, Ellis IO. Basal-like breast cancer: a critical review. J Clin Oncol. 2008;26:2568–81. - PubMed
    1. Dey N, Smith BR, Leyland-Jones B. Targeting basal-like breast cancers. Curr Drug Targets. 2012;13:1510–24. - PubMed

Publication types

MeSH terms

Substances